 Open Access Article
Preparation and characterization of near-stoichiometric silicon carbon fibres
Yuanfeng Gan,
Xiaozhou Wang*,
Jun Wang * and
Hao Wang
Science and Technology on Advanced Ceramic Fibres and Composites Laboratory, National University of Defense Technology, Changsha 410073, People's Republic of China. E-mail: wangler2002@163.com; wangjun_nudt_cfc@163.com
First published on 14th May 2018
Abstract
Near-stoichiometric SiC fibres (CVC-S fibres) were successfully prepared by pyrolysing chemical-vapour-cured polycarbosilane fibres under hydrogen and subsequent heat treatment in inert atmosphere at 1500 °C. The composition and properties of the obtained fibres were determined by Auger electron spectroscopy, X-ray photoelectron spectroscopy, scanning electron microscopy, transmission electron microscopy, tensile strength testing, and X-ray diffraction analysis. The results reveal that the CVC-S fibres with C/Si of 1.06 and O of 1.11 wt% have high tensile strength (2.6 GPa), high tensile modulus (321 GPa), and a highly crystalline structure (crystallite size, ∼14 nm.) In addition, the high-temperature behaviour of the CVC-S fibre was also investigated via heat treatment in argon and air at different temperatures. In particular, the fibres retain ∼2.2 GPa of their original strength after heating at 1600 °C for 1 h under argon. When argon was replaced by air, the tensile strength of the fibres could still be maintained at ∼1.1 GPa after annealing at 1400 °C. The more economical and practical approach along with the excellent performance of the obtained fibres render the CVC-S fibres promising materials for high-temperature applications.
1. Introduction
Silicon carbon fibres are one of the best candidates for the reinforcement of continuous-fibre-reinforced ceramic-matrix composites (CMCs), because of their high tensile strength, high elastic modulus, and good thermal stability, especially near-stoichiometric SiC fibres, which render them widely applicable in harsh radiation environments, as components of light water reactor fuel cladding and channel boxes, fuel and in-vessel components in advanced fission reactors, and other extreme radiation services.1–10 Polymer-derived method has been regarded as the most successful approach for the synthesis of continuous SiC fibres with a fine diameter. This was first introduced by Yajima11 and later commercialized under the trade names, Nicalon, Tyranno, and Sylramic. In particular, as one of the third-generation SiC fibres, Hi-Nicalon Type S (Nippon Carbon Co., Tokyo, Japan)12–14 has low oxygen content, near-stoichiometric chemical composition, and high crystallinity, exhibiting improved thermal stability and creep resistance up to 1400 °C. Thus, near-stoichiometric SiC fibres can satisfy many of the requirements for the use of ceramic matrix composites in high-temperature structural applications and have attracted sustained attention.15–18However, the application of Hi-Nicalon Type S is still limited by the significantly high cost of production. Hi-Nicalon Type S fibres were prepared by melt-spinning polycarbosilane, followed by radiation-curing using an electron beam and subsequent pyrolysis in hydrogen and then in argon.19 The electron radiation was the main factor in the considerably high cost of Hi-Nicalon Type S, in consideration of the low irradiation dose, long period of irradiation, and expensive equipment. In order to circumvent this, researchers adopted different technologies for lowering the cost. To enhance the curing efficiency of the electron beam irradiation process at a low dose rate, Su20 prepared SiC fibres using a curing route of electron irradiation in an atmosphere with a low concentration of oxygen. However, the oxygen content of the resultant SiC fibres was 10.03%. In addition, low-oxygen SiC fibre can be prepared by the pyrolysis of polycarbosilane (PCS) fibres cured with chemical vapour curing (CVC), however, these CVC-cured fibres are not near-stoichiometric fibres and the thermal stability needs to be improved further.21–23 Therefore, near-stoichiometric SiC fibres with low cost and high performance continue to be the focus of researchers.
In this study, a new type of near-stoichiometric SiC fibres, namely CVC-S SiC fibres, were prepared via pyrolysis of chemical-vapour-cured polycarbosilane fibres in an atmosphere containing hydrogen and subsequently heat-treated in an inert atmosphere. As far as we are aware, few works have been adopted to prepare near-stoichiometric SiC fibres by using CVC-cured PCS fibres as raw materials. Specially, it is really difficult to cured PCS fibres completely via CVC process. More importantly, CVC process usually used unsaturated alkene or alkyne atmospheres to react with PCS fibres, which would introduce additional carbon to the fibres. Subsequently, the carbon elimination conducted in hydrogen atmosphere will result in higher mass loss, which will generate more defects, thus lower the fibres strength. However, the low production cost of near-stoichiometric SiC fibres by CVC process has attracted special attentions. Recently, by choosing cyclohexene gas, applying advanced equipment and strictly controlling technics, high performance near-stoichiometric SiC fibres, namely CVC-S SiC fibres, was successfully prepared from CVC-cured PCS fibres. In addition, the composition and properties of the obtained fibres as well as its comparison with Hi-Nicalon Type S were investigated. The more economical and practical approach along with the excellent performance of the obtained fibres render the CVC-S fibres promising materials for high-temperature applications.
2. Experimental procedure
2.1 Sample preparation
The PCS fibres used in this study were produced following the procedure of Yajima.24 Then, the PCS fibres were cured by heating in a tubular furnace up to 350 °C at the rate of 25 °C h−1 under the flow of nitrogen mixed with cyclohexene vapours.25 The composition and properties of the obtained CVC-cured fibres are provided in Table 1. To prepare near-stoichiometric SiC fibres, the CVC-cured fibres were heated under a gas mixture (70 vol% H2 and 30 vol% Ar) up to 800 °C at the rate of 60 °C h−1 and subsequently annealed at 1500 °C at the rate of 300 °C h−1 under inert atmosphere.| Properties | CVC cured fibres |
|---|---|
| Silicon content (wt%) | 50.42 |
| Carbon content (wt%) | 42.08 |
| Oxygen content (wt%) | 0.87 |
| Chemical formula | SiC1.95O0.03 |
| Gel (wt%) | 98.2 |
| Ceramic yield (wt%) | 82.1 |
2.2 Annealing treatments
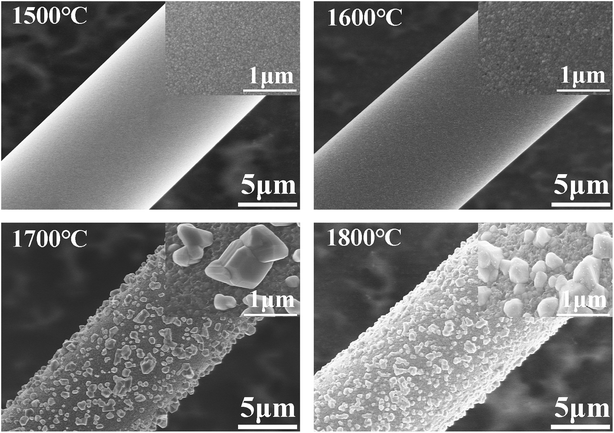
The high-temperature treatment under different environments was carried out as follows: the fibres were charged into a graphite crucible and heated under argon at 1500, 1600, 1700, and 1800 °C for 1 h.2.3 Analysis and characterization
The bulk composition of the fibres was determined by chemical analysis. Quantitative analysis of carbon was carried out using an EMIA-320V carbon/sulfur analyzer (Horiba, Japan), and oxygen was measured using an EMIA-820 oxygen/nitrogen analyzer (Horiba, Japan). The content of silicon was obtained by the alkali fusion method.The depth profile of the fibre surfaces was conducted with an Auger electron spectroscope (AES, ULVAC PHI-700, Japan) coupled with an Ar+ sputtering gun for depth profiling at a sputtering rate of 13 nm min−1 (sputtering rate reference: SiO2).
X-ray photoelectron spectroscopy (XPS, Thermo Scientific ESCALAB 250Xi, USA) spectra were recorded using Al Kα as the excitation source to detect the surface compositions and chemical bonding states in a few atomic layers. The inner layer of the fibres was revealed by etching for 100 s to XPS analysis by argon ion bombardment at a rate of 0.72 nm s−1.
Then, the structure of free carbon in the fibres were analyzed by Raman spectrometer (Bruker, Germany) employing a semiconductor laser (λ = 532 nm).
The surface and fracture morphologies of the fibres were examined using a scanning electron microscope (SEM, Hitachi FEG S4800, Japan).
Furthermore, transmission electron microscope (TEM) imaging and high-angle annular dark-filed scanning transmission electron microscope (HAADF-STEM) imaging was performed using a Titan G2 60-300 high resolution microscope (FEI, USA) equipped with an energy-dispersive spectroscope (EDS). Samples for TEM and STEM observations were cross-section slice formed by using focused ion beam (FIB) sputtering the fibres.
The tensile strength of the 25 mm long fibres was measured at room-temperature with a universal strength machine (Testometrix Micro 350, UK) using a load cell of 5 N and a crosshead speed of 5 mm min−1. The average tensile strength was obtained from the measured results of 24 filaments.
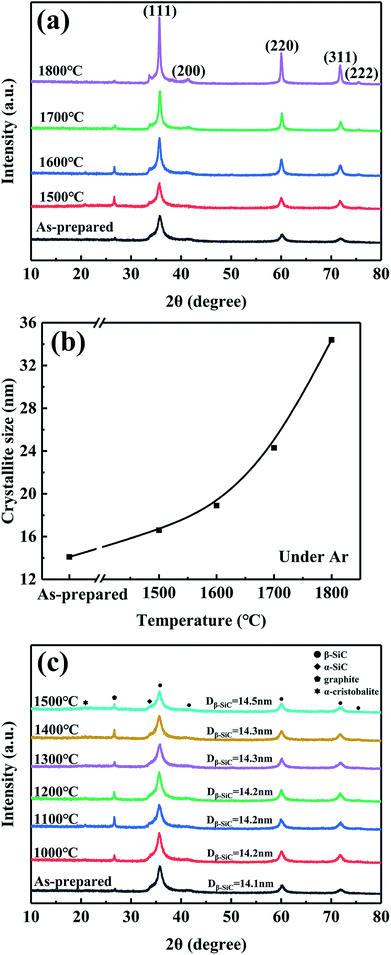
The crystal structure of the fibres was characterized by an X-ray diffractometer (XRD, Bruker D8ADVANCE, Germany) using monochromatic Cu Kα radiation (λ = 1.5406 Å), and the apparent crystallite size of β-SiC was estimated from the half-value width of the (220) peak employing the Scherrer's formula.
The thermal stability of the SiC fibres was evaluated in a high-temperature carbon-resistant furnace under argon. The oxidation test was performed in a muffle furnace under air. In addition, the fibres were placed in an alumina boat and were maintained at the annealing temperature (1000, 1100, 1200, 1300, 1400, and 1500 °C) for 1 h under air.
3. Results and discussion
3.1 Characterization of CVC-S SiC fibres
The composition and properties of the prepared CVC-S SiC fibres are listed in Table 2. The contents of silicon, carbon, and oxygen were found to be 65.68, 29.96, and 1.11 wt%, respectively; hence, CVC-S fibres had a molar composition of SiC1.06O0.03, indicating that the fibres comprised of near-stoichiometric SiC with low oxygen content. Remarkably, CVC-S fibres had slightly higher oxygen content (about 0.9 wt%) compared with Hi-Nicalon Type S, probably due to the relatively high oxygen content of the CVC-cured fibres. Besides, CVC-S SiC fibres have excellent mechanical properties, e.g., the tensile strength and Young's modulus are 2.6 GPa and 321 GPa respectively. It should be noted that the tensile strength of CVC-S SiC fibres was as high as Hi-Nicalon Type S (2.6 GPa). The excellent mechanical properties might be related to the dense microstructure, which was confirmed by their high density (2.86 g cm−3). In addition, the modulus of CVC-S SiC fibres was lower than Hi-Nicalon Type S (420 GPa), which might be caused by their different composition and structure. Since CVC curing method would introduce additional carbon as well as more oxygen, which might lower the Young's modulus.| Properties | CVC-S SiC fibres |
|---|---|
| Silicon content (wt%) | 65.68 |
| Carbon content (wt%) | 29.96 |
| Oxygen content (wt%) | 1.11 |
| Chemical formula | SiC1.06O0.03 |
| Density (g cm−3) | 2.86 |
| Diameter (μm) | 11.2 |
| Tensile strength (GPa) | 2.60 |
| Young's modulus (GPa) | 321 |
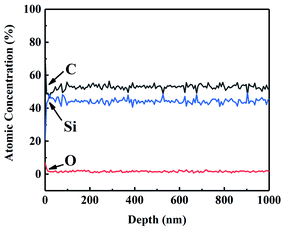
Auger electron spectroscopy (AES) was performed on CVC-S fibres to better analyse the composition of the fibres. Fig. 1 shows the AES depth profiles for CVC-S SiC fibres, which suggest that the fibre surface was enriched in both carbon and oxygen up to ∼10 nm in thickness. This part rapidly vanished after sputtering, with the composition of near-stoichiometric SiC and low content of oxygen becoming constant, indicating the outstanding thermal stability of the CVC-S fibres.
According to previous studies, cyclohexyl group can be introduced into the PCS skeleton during CVC, and it may be converted to free carbon embedded in the Si–C networks in a subsequent pyrolysis process.26,27 Considering the characteristics of the gas–solid reaction, cyclohexyl group will be incorporated to a greater extent on the surface, generating a thicker layer with excess carbon. In contrast, a carbon layer was also observed on the surface of Hi-Nicalon Type S, with its thickness being approximately 150 nm,19 which might be associated with the high-temperature properties of SiC fibres. Thus, the CVC-S SiC fibres contained near-stoichiometric SiC and low oxygen content, with carbon- and oxygen-enriched surface layers.
The composition and microstructure of the surface of the SiC fibres significantly influenced their properties. For example, the surface composition of SiC fibres affected SiC nucleation and SiO diffusion from the core to fibre surface, which influenced the formation of large grains on the surface.28 Therefore, X-ray photoelectron spectroscopy (XPS) was used to investigate the surface chemical bonding of CVC-S SiC fibres, and the results are shown in Fig. 2. In the XPS Si 2p spectra (Fig. 2a), a peak at a binding energy (BE) of 100.6 eV is observed corresponding to Si in bulk SiC. The peak at 101.3 eV is attributed to the oxidation state of silicon intermediate between its oxidation state in SiO2 and in SiC, and originates from SiCxOy.29 Therefore, the presence of amorphous SiCxOy phases on the fibre surface can be inferred. The C 1s spectrum is shown in Fig. 2b, and the peaks at 282.3, 284.3, and 285.8 eV correspond to C–Si, sp2 C![[double bond, length as m-dash]](https://www.rsc.org/images/entities/char_e001.gif) C, and C–O bonding configurations, respectively.30,31 According to these results, the fibre surface can be concluded to consist of SiC, SiCxOy, and free carbon.
C, and C–O bonding configurations, respectively.30,31 According to these results, the fibre surface can be concluded to consist of SiC, SiCxOy, and free carbon.
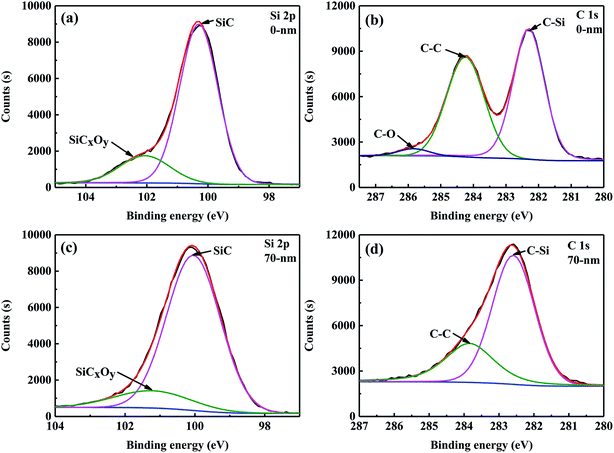 | ||
| Fig. 2 High-resolution XPS spectra of Si 2p (a and c) and C 1s (b and d) regions for the CVC-S SiC fibres before and after Ar+ etching. | ||
Apart from the surface layer (0 nm), the elemental composition of the inner layer (approximately 70 nm from the surface) of the CVC-S SiC fibres was examined by XPS and the results are tabulated in Table 3. As shown, the content of Si increased, however the content of O decreased, and the C/Si mole ratio is close to 1, indicating the presence of more SiC and less SiCxOy in the interior layer at a depth of 70 nm from the surface. According to the XPS Si 2p spectra (Fig. 2c), the type of bonding did not change. However, no C–O bonding is observed in the spectrum of C 1s (Fig. 2d). Furthermore, Table 2 shows the mole ratio of the components from the XPS Si 2p spectra to be SiC![[thin space (1/6-em)]](https://www.rsc.org/images/entities/char_2009.gif) :
:![[thin space (1/6-em)]](https://www.rsc.org/images/entities/char_2009.gif) SiCxOy = 1
SiCxOy = 1![[thin space (1/6-em)]](https://www.rsc.org/images/entities/char_2009.gif) :
:![[thin space (1/6-em)]](https://www.rsc.org/images/entities/char_2009.gif) 0.22 (0 nm, topmost surface layer) and SiC
0.22 (0 nm, topmost surface layer) and SiC![[thin space (1/6-em)]](https://www.rsc.org/images/entities/char_2009.gif) :
:![[thin space (1/6-em)]](https://www.rsc.org/images/entities/char_2009.gif) SiCxOy = 1
SiCxOy = 1![[thin space (1/6-em)]](https://www.rsc.org/images/entities/char_2009.gif) :
:![[thin space (1/6-em)]](https://www.rsc.org/images/entities/char_2009.gif) 0.16 (a layer 70 nm removed from the surface). In brief, the fibres are almost composed of SiC, with a small quantity of SiCxOy and free carbon on the surface, which is also in agreement with the results of AES depth profiling.
0.16 (a layer 70 nm removed from the surface). In brief, the fibres are almost composed of SiC, with a small quantity of SiCxOy and free carbon on the surface, which is also in agreement with the results of AES depth profiling.
| Location | Composition | Si 2p | C 1s | |||||
|---|---|---|---|---|---|---|---|---|
| Si (at%) | C (at%) | O (at%) | SiC | SiCxOy | C–Si | C–C | C–O | |
| 0 nm | 37.59 | 44.71 | 17.70 | 81.91% | 18.09% | 52.24% | 45.18% | 2.58% |
| 70 nm | 47.98 | 44.58 | 7.44 | 86.23% | 13.77% | 69.92% | 30.08% | — |
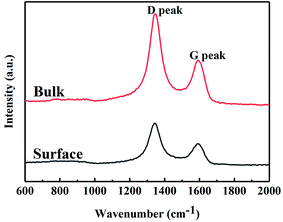
Free carbon phases would affect many of the properties of SiC fibres. Raman spectroscopy was used to analyse the microstructure of free carbon. The Raman spectra of SiC fibres (Fig. 3) consist of two peaks at ∼1345 and 1590 cm−1, which are attributed to the D (disordered) and G (graphitic) bands, respectively; hence, the carbon consists of disordered carbon and micro-crystalline graphite embedded in the disordered carbon. In order to obtain more information, the Raman spectra were fitted using the Lorentzian function for D band and the Breit–Wigner–Fano function for G band,32 and the Raman characteristics of the two bands are compiled in Table 4. The full width at half maximum (FWHM) of the G band and integrated intensity ratio of the D to G band (ID/IG) for the surface, as calculated from the Raman spectra are 71.5 and 2.11 cm−1, respectively. In addition, the FWHM of G band of the bulk fibres is larger than that of the surface, indicating that the graphitization of free carbon of surface was higher than that of bulk. In general, ID/IG is used to approximate the crystallite size of micro-crystalline graphite, using the expression,33 La (nm) = (2.4 × 10⁻¹⁰)λ4(ID/IG)−1, where, La is the crystallite size and λ (532 nm) is the wavelength of the laser used in the Raman experiment. Based on this expression, the value of La of the surface and bulk were both calculated to be ∼9 nm.
| Test points | D peak (cm−1) | G peak (cm−1) | ID/IG | ||
|---|---|---|---|---|---|
| Position | FWHM | Position | FWHM | ||
| Surface | 1343 | 73.9 | 1590 | 71.5 | 2.11 |
| Bulk | 1345 | 74.2 | 1593 | 73.6 | 2.18 |
As shown in Fig. 4a, the fibre surfaces are smooth and dense without any obvious cracks or pores. The fracture cross-section in Fig. 4b shows distinct mirror and hackle features, which are recognized as typical fracture traits of dense ceramic fibres.34 Moreover, no visible pores or defects are observed on the fracture surface, indicating the high structural uniformity of the fibres, which was similar to Hi-Nicalon Type S.
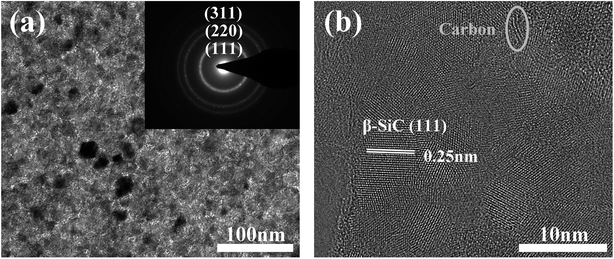
Fig. 5a shows the TEM micrograph and selected-area electron diffraction pattern (SAED) of the as-prepared fibres. The SAED pattern shows three main rings corresponding to the Bragg reflections of the (111), (220), and (311) planes of β-SiC, indicating that the observed areas consist of β-SiC grains. The fibre structure was further analyzed by HRTEM (Fig. 5b). It is clear that the as-prepared fibre is composed of silicon carbide, free carbon, and an amorphous intergranular phase. The lattice parameter of the SiC, 0.25 nm, was identified as the (111) planes of the β-SiC nanocrystal. Free carbon was stacked by slightly distorted carbon layers and the intergranular phase might be the amorphous SiCxOy phase. Furthermore, it is obvious that the primary phase of the fibres is silicon carbon and only a small quantity of free carbon and amorphous phases, which is in good agreement with the XPS analysis, as discussed previously.
3.2 High-temperature behaviour of CVC-S SiC fibres
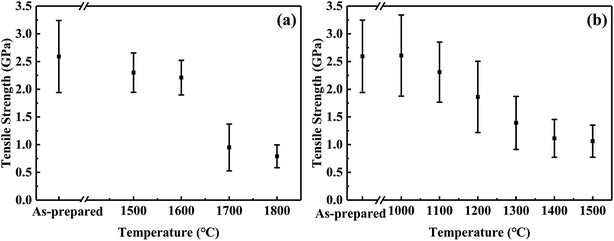 | ||
| Fig. 6 Tensile strength changes of CVC-S fibres after heat treatment in argon (a) and air (b) for 1 h. | ||
Fig. 6a shows the tensile strength of the fibres after the thermal test in argon atmosphere. The failure stress decreased very slowly below 1600 °C in argon. The fibres maintained 2.3 GPa and 2.2 GPa after 1 h at 1500 and 1600 °C, respectively. Moreover, although CVC-S fibres retained good strength (approximately 1 GPa) even after heating to 1700 °C, increased deterioration of the strength is observed. Specifically, the fibres treated in argon at 1700 and 1800 °C retained 1.0 GPa and 0.8 GPa, respectively. The decline in the strength might be caused by the decomposition of the SiCxOy phase after the high-temperature treatment (as shown in eqn (1)). Overall, CVC-S fibres had excellent thermal stability at ∼1600 °C, which was matched by that of Hi-Nicalon Type S, but the strength of CVC-S fibres after 1 h exposure in argon gas above 1700 °C was lower than that of the latter.35 This difference might be caused by the composition of a bit more oxygen (1.11 wt%), which was mainly formed as SiCxOy phase. And the decomposition of the SiCxOy phase at the high temperature might lead to some defects and flaws in CVC-S fibres. Even so, CVC-S fibres still had good mechanical properties in high-temperature condition.
| SiCxOy → SiC (s) + C (s) + SiO (g) + CO (g) | (1) |
In contrast, the results of oxidation test shown in Fig. 6b suggest a different trend than that of Fig. 6a. The tensile strength of the fibres slightly increased with an increase in the temperature to 1100 °C in air, possibly due to the generation of an oxidation layer which remedied the defect in the surface to some extent. Subsequently, the tensile strength decreased gradually with increasing temperature, which is possibly related to the thickness of the oxidation layer. After heating at 1400–1500 °C in air for 1 h, the tensile strengths of the fibres were found to be maintained at ∼1.1 GPa. Compared to Hi-Nicalon Type S (strength of ∼1.1 GPa at 1500 °C in air),35 CVC-S fibres had the similar properties, which showed the good oxidation resistance.
| SiO (g) + 3CO (g) → SiC (s) + 2CO2 (g) | (2) |
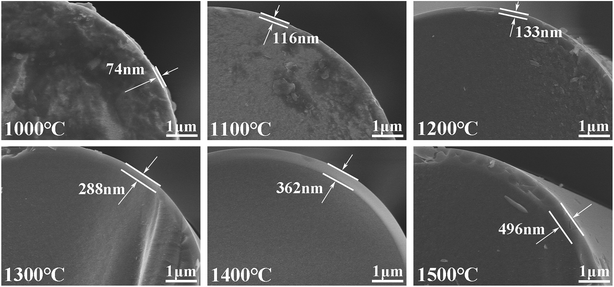
However, Fig. 8 shows that when exposed to air at different temperatures, an oxidation layer composed of silica is generated on the surface, without any large particles. The oxidation layer is mainly produced by the passive-oxidation reaction shown in eqn (3). Moreover, it is obvious that the thickness of the oxidation layers increased significantly with temperature, under air. The strength is in good agreement with the thickness of the oxidation layer, which might be the reason for the decline in the strength.
| 2SiC (s) + 3O2 (g) → 2SiO2 (s) + 2CO (g) | (3) |
| Annealing atmosphere | Temperature (°C) | Oxygen content (wt%) | Carbon content (wt%) | Silicon content (wt%) |
|---|---|---|---|---|
| — | As-prepared | 1.11 | 29.96 | 65.68 |
| Argon | 1500 °C | 1.13 | 29.53 | 66.09 |
| 1600 °C | 0.70 | 29.60 | 66.45 | |
| 1700 °C | 0.49 | 29.75 | 66.51 | |
| 1800 °C | 0.12 | 29.74 | 66.89 | |
| Air | 1000 °C | 2.05 | 29.51 | 65.19 |
| 1100 °C | 2.73 | 29.95 | 64.07 | |
| 1200 °C | 3.54 | 29.68 | 63.63 | |
| 1300 °C | 4.92 | 29.19 | 62.64 | |
| 1400 °C | 5.17 | 28.81 | 62.77 | |
| 1500 °C | 6.84 | 28.85 | 61.06 |
4. Conclusions
The CVC-S silicon carbon fibres with near-stoichiometric composition were prepared by heating chemical-vapour-cured polycarbosilane fibres in hydrogen and then in an inert atmosphere. The general properties and microstructural evolution of the CVC-S silicon carbon fibres were characterized at high temperatures under argon and air atmospheres. The CVC-S fibres were found to be composed of SiC and an amorphous SiCxOy structure with traces of free carbon on the surface. The tensile strength was found to be 2.6 GPa. When heated to high temperatures for 1 h, the CVC-S fibres showed significant differences in the mechanical properties and microstructure depending on the surrounding atmosphere. With increasing heat treatment temperature in argon, the fibre surfaces became coarser and new defects such as large SiC particles appeared on the fibre surface, accompanied by the decomposition of the SiCxOy phase. The β-SiC grains tended to grow into larger crystals with increasing temperature in argon because of the coalescence of the grains and the decomposition of the SiCxOy phase. We established that the mechanical properties of the CVC-S SiC fibres are closely related to their microstructures. After annealing at 1600 °C under argon, the fibres still retained tensile strength of ∼2.2 GPa. When argon was replaced by air, the fibres retained tensile strength of ∼1.1 GPa at 1400 °C. The SEM observations indicated that the thickness of the oxidation layer increased with the temperature, which led to the decline in the strength of the fibres. Based on the microstructural analyses, it is likely that the β-SiC grains grew, and the surface flaws and the surface composition are responsible for the deterioration of the fibre strength after heating at high temperatures in argon or air. These results reveal the potential of the CVC-S silicon carbon fibres with near-stoichiometric composition and high tensile strength for application in high-temperature CMCs. In summary, this process is highly cost-effective for the large-scale industrial production of near-stoichiometric SiC fibres.Conflicts of interest
There are no conflicts to declare.Acknowledgements
This work was sponsored by the National Natural Science Foundation of China (51403233) and National University of Defense Technology (ZK17-XX-02). The authors are also thankful for the financial support from Aid Program for Science and Technology Innovative Research Team in Higher Education Institutions of Hunan Province, and Aid Program for Innovative Group of National University of Defense Technology.References
- L. L. Snead, T. Nozawa, M. Ferraris, Y. Katoh, R. Shinavski and M. Sawan, J. Nucl. Mater., 2011, 417, 330–339 CrossRef.
- L. Giancarli, H. Golfier, S. Nishio, R. Raffray, C. Wong and R. Yamada, Fusion Eng. Des., 2002, 61–62, 307–318 CrossRef.
- Y. Katoh, L. L. Snead, I. Szlufarska and W. J. Weber, Curr. Opin. Solid State Mater. Sci., 2012, 16, 143–152 CrossRef.
- K. Yueh, D. Carpenter and H. Feinroth, Nucl. Eng. Int., 2010, 55, 14–16 Search PubMed.
- K. E. Barrett, M. P. Teague, I. J. V. Rooyen, S. M. Bragg-Sitton, K. D. Ellis, C. Glass, G. Roth, K. McHugh, J. Garnier, G. Griffith, M. C. Teague, G. Bell, L. L. Snead and Y. Katoh, Trans. Am. Nucl. Soc., 2012, 107, 886–889 Search PubMed.
- K. A. Terrani, Y. Yang, Y.-J. Kim, R. Rebak, H. M. Meyer III and T. J. Gerczak, J. Nucl. Mater., 2015, 465, 488–498 CrossRef.
- Y. Lee, N. O. Hee Cheon and J. I. Lee, Nucl. Eng. Des., 2017, 311, 213–223 CrossRef.
- V. A. Avincola, P. Guenoun and K. Sshirvan, Nucl. Eng. Des., 2016, 310, 280–294 CrossRef.
- V. A. Avincola, M. Grosse, U. Stegmaier, M. Steinbrueck and H. J. Seifert, Nucl. Eng. Des., 2015, 295, 468–478 CrossRef.
- M. Li, X. B. Zhou, H. Yang, S. Y. Du and Q. Huang, Scr. Mater., 2018, 143, 149–153 CrossRef.
- S. Yajima, J. Hayashi, M. Omori and K. Okamura, Nature, 1976, 261, 683–685 CrossRef.
- M. Takeda, A. Saeki, J. Sakamoto, Y. Imai and H. Ichikawa, J. Am. Ceram. Soc., 2000, 83, 1063–1069 CrossRef.
- A. G. Perez-Bergquist, T. Nozawa, C. Shih, K. J. Leonard, L. L. Snead and Y. Katoh, J. Nucl. Mater., 2015, 462, 443–449 CrossRef.
- Y. Katoh, T. Nozawa, C. Shih, K. Ozawa, T. Koyanagi, W. Porter and L. L. Snead, J. Nucl. Mater., 2015, 462, 450–457 CrossRef.
- J. Lamon and M. R'Mili, Acta Mater., 2017, 131, 197–205 CrossRef.
- Y. Y. Li and W. Xiao, Comput. Mater. Sci., 2015, 110, 215–220 CrossRef.
- J. Huguet-Garcia, A. Jankowiak, S. Miro, E. Meslin, Y. Serruys and J.-M. Costantini, Nucl. Instrum. Methods Phys. Res., Sect. B, 2016, 374, 76–81 CrossRef.
- X. F. Liu, L. T. Zhang, X. W. Yin, F. Ye, Y. S. Liu and L. F. Cheng, Ceram. Int., 2017, 43, 3267–3273 CrossRef.
- H. Ichikawa, J. Ceram. Soc. Jpn., 2006, 114, 455–460 CrossRef.
- Z. M. Su, L. T. Zhang, Y. C. Li, S. W. Li and L. F. Chen, J. Am. Ceram. Soc., 2015, 98, 2014–2017 CrossRef.
- W. Toreki, C. D. Batich, M. D. Sacks, M. Saleem, G. J. Choi and A. A. Morrone, Compos. Sci. Technol., 1994, 51, 145–159 CrossRef.
- Y. Hasegawa, J. Inorg. Organomet. Polym., 1992, 2, 161–169 CrossRef.
- Y. Hasegawa, Compos. Sci. Technol., 1994, 51, 161–166 CrossRef.
- S. Yajima, J. Hayashi and K. Okamura, Nature, 1977, 266, 521–522 CrossRef.
- Q. Yuan, Y. Q. Li and Y. C. Song, Ceram. Int., 2017, 43, 9128–9132 CrossRef.
- X. H. Mao, Y. C. Song, W. Li and D. X. Yang, J. Appl. Polym. Sci., 2007, 105, 1651–1657 CrossRef.
- D. Y. Wang, X. H. Mao, Y. C. Song and Y. D. Wang, Sci. China: Technol. Sci., 2010, 53, 1038–1042 CrossRef.
- S. Y. Cao, J. Wang and H. Wang, CrystEngComm, 2016, 18, 3674–3682 RSC.
- L. Porte and A. Sartre, J. Mater. Sci., 1989, 24, 271–275 CrossRef.
- K. Yamamoto, Y. Koga and S. Fujiwara, Diamond Relat. Mater., 2001, 10, 1921–1926 CrossRef.
- E. Buet, C. Sauder, S. Poissonnet, P. Brender, R. Gadiou and C. Vix-Guterl, J. Eur. Ceram. Soc., 2012, 32, 547–557 CrossRef.
- T. Y. Leung, W. F. Man, P. K. Lim, M. C. Chan, F. Gaspari and S. Zubotynki, J. Non-Cryst. Solids, 1999, 254, 156–160 CrossRef.
- L. G. Cancado, K. Takai, T. Enoki, M. Endo, Y. A. Kim, H. Mizusaki, A. Jorio, L. N. Coelho, R. Magalhães-Paniago and M. A. Pimenta, Appl. Phys. Lett., 2006, 88, 1–3 CrossRef.
- D. J. Pysher, K. C. Goretta, R. S. Hodder and R. E. Tressler, J. Am. Ceram. Soc., 1989, 72, 284–288 CrossRef.
- T. Shimoo, H. Takeuchi, M. Takeda and K. Okamura, J. Ceram. Soc. Jpn., 2000, 108, 1096–1102 CrossRef.
- T. Shimoo, K. Okamura, M. Ito and M. Takeda, J. Mater. Sci., 2000, 35, 3733–3739 CrossRef.
- F. He, Carbon fibres and its application technology, Chemical Industry Press, China, 2004 Search PubMed.
| This journal is © The Royal Society of Chemistry 2018 |

