 Open Access Article
Flexible C–Mo2C fiber film with self-fused junctions as a long cyclability anode material for sodium-ion battery†
Wenjie Zhanga,
Zeyu Guoa,
Qinghua Lianga,
Ruitao Lv ab,
Wanci Shena,
Feiyu Kanga,
Yuqing Wenga and
Zheng-Hong Huang
 *ab
*ab
aState Key Laboratory of New Ceramics and Fine Processing, School of Materials Science and Engineering, Tsinghua University, Beijing 100084, P. R. China. E-mail: zhhuang@tsinghua.edu.cn
bKey Laboratory of Advanced Materials (MOE), School of Materials Science and Engineering, Tsinghua University, Beijing 100084, P. R. China
First published on 8th May 2018
Abstract
Electrospun carbon fiber films have high contact resistance at the fiber junctions, which causes poor cycling stability and limits their further improvement in energy storage performances. To eliminate the contact resistance of the film, we provide a new strategy to fuse the fiber junctions by introducing MoO2 in the fibers, which replaces the C–C interface by a more active C–MoO2–C interface at the fiber junction to promote mass transfer. MoO2 reacts with C matrix to generate Mo2C and form self-fused junctions during the carbonization process. Due to much lower charge transfer and sodium diffusion resistance, the C–Mo2C fiber film with self-fused junctions shows much better cyclability with capacity retention of 90% after 2000 cycles at a constant current density of 1 A g−1. Moreover, the Mo2C particles provide many electrochemically active sites, leading to additional improvement in sodium storage. The C–Mo2C fiber film has a capacity of 134 mA h g−1 at 1 A g−1 and a high capacity of 99 mA h g−1 even at 5 A g−1.
1. Introduction
As the demand for better rechargeable batteries keeps increasing, one of the major challenges is to provide low cost and environmentally friendly high power energy resources. Sodium-ion batteries (SIBs) have attracted much attention because of the abundance and low cost of sodium.1,2 SIBs have shown potential to occupy the market for large-scale energy storage, in particular for smart electric grids.3–6 However, the graphite anode used in LIBs is not suitable for sodium-ion storage because of the weak interaction between Na and C and the large ionic radius of sodium.7,8 Hard-carbon materials with low graphitization have proven to be more suitable for Na+ storage because of their large interlayer distance and disordered structure.7,9–11 Among the hard-carbon materials, electrospun carbon fiber films show great promise as SIB electrodes because of their high electron conductivity, potential as backbone to support other active materials, easy production at the industrial-scale, and cost-effectiveness.12–14However, these fibers have high contact resistance at the junctions, leading to a prolonged charge transfer path, which causes poor cycling stability and limits their further improvement in energy storage performances,12 especially for SIBs with large Na+ radius and sluggish Na-ion transport. Therefore, it is a great challenge to achieve fibers with adequate cyclability for Na-storage. Researchers have attempted to introduce graphene or carbon nanotubes into the fibers to enhance cycle performance.15,16 To the best of our knowledge, there are very few reports on eliminating the contact resistance of carbon fibers for achieving better cycling performance, which is important for basic studies and industrial production of SIBs.
Eliminating the contact resistance requires fusing the fiber junctions, which is still a challenge for 1D materials.17–19 Cheng et al. merged the junctions via carbonization of electrospun PAN/PVP/TPA hybrid composite fibers, which resulted in reduced electrical resistance and enhanced electrochemical energy storage properties.12 However, the formation of fused fibers is largely affected by the solvent evaporation rate, need for heating power and a relatively humidity of 10–20% in the electrospinning chamber. An et al. achieved a junctioned copper fiber film through electrospinning and electroplating, which dramatically reduced the contact resistance at the junctions.17 Thermal post-processing or mechanical pressing was also reported to merge the junctions.20,21 However, these methods are complicated and not practical for low-cost materials.
It is crucial to improve mass transfer in the carbonization process for fusing the fiber junctions. The mass transfer can be accelerated by producing a highly active solid phase interface. In the present study, we provide a new strategy to fuse the fiber junctions for reducing the contact resistance. Herein, we introduce MoO2 in the carbon fibers to replace the C–C interface by the more active C–MoO2–C interface at the fiber junction. During the carbonization process, MoO2 reacts with the C matrix to generate Mo2C, which promotes the mass transfer; this in turn results in the fusing of the fiber junctions. The fused junctions effectively reduce the contact resistance at the junctions, resulting in fast charge and ionic transport. Compared with the non-fused C fiber film, the self-fused C–Mo2C fiber film exhibits excellent flexibility and much better cyclability with a capacity retention of 90% after 2000 cycles at a constant current density of 1 A g−1.
2. Experimental section
2.1 Material synthesis
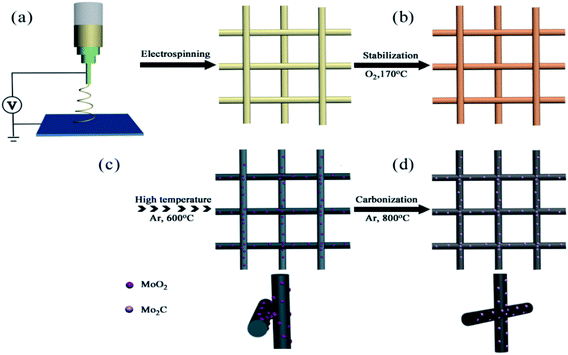
In a typical synthesis, 1.5 g polyacrylonitrile (PAN) and 0.3 g hexaammoniumheptamolybdate tetrahydrate were dissolved in 18 g dimethylformamide (DMF). The obtained mixture solution was electrospun at 1 ml h−1 and 25 kV (Fig. 1a). After electrospinning, the obtained fiber film was pre-oxidation in air at 170 °C for 12 h (Fig. 1b), in which PAN can be oxidized and then stable in air, followed by carbonization at 800 °C for 5 h in an Ar atmosphere (Fig. 1d). For comparison, a pure C fiber film was also prepared without adding hexaammoniumheptamolybdate tetrahydrate in DMF.2.2 Characterizations
Crystal structures of the samples were examined by X-ray diffraction (XRD, Bruker D8-ADVANCE) under an accelerating voltage of 40 kV. Morphologies and structures were characterized by scanning electron microscopy (SEM, Dual-beam FIB 235, FEI Strata) and transmission electron microscopy (TEM, JEM-2100F, JEOL). Chemical compositions and structures were analyzed using X-ray photoelectron spectroscopy (XPS, ESCALAB 250Xi). The weight percentage of Mo2C was determined by thermogravimetric analysis (TGA, Mettler Toledo TGA/DSC1) under air at a heating rate of 10 °C min−1. N2 adsorption studies were carried out at 77 K on the BELSORP-mini II system. The specific surface area and pore size distribution were analyzed by Brunauer–Emmett–Teller and nonlocal density functional theory method, respectively. Raman spectra were obtained using laser excitation at 532 nm (Renishaw, InVia-Reflex).2.3 Electrochemical testing
The electrochemical performance was evaluated by using coin-type cells. The C–Mo2C and C fiber films were used as the working electrodes without any additives or binders. A sodium foil and Whatman GF/A glass fiber were used as the counter electrode and separator, respectively. NaClO4 (1 M) dissolved in an EC/DEC (1![[thin space (1/6-em)]](https://www.rsc.org/images/entities/char_2009.gif) :
:![[thin space (1/6-em)]](https://www.rsc.org/images/entities/char_2009.gif) 1 by volume ratio) solution was used as the electrolyte. The cells were assembled in an argon-filled glove box where the concentrations of moisture and oxygen were maintained below 0.1 ppm. Electrochemical measurements were carried out after 24 h of battery assembly. The galvanostatic charge/discharge experiments were tested in the voltage range of 0.01–3 V at various current densities ranging from 20 to 5000 mA g−1 using the Land battery testing system (Jinnuo Electronics Co., Wuhan, China). Cyclic voltammetry (CV) and electrochemical impedance spectroscopy (EIS) measurements were obtained using an electrochemical workstation (VMP3, Bio-Logic). CV curves were tested in the potential range of 0.01–3 V at a scan rate of 0.5 mV s−1. EIS measurements were carried out at an AC amplitude of 10 mV in the frequency range from 100 kHz to 0.01 Hz.
1 by volume ratio) solution was used as the electrolyte. The cells were assembled in an argon-filled glove box where the concentrations of moisture and oxygen were maintained below 0.1 ppm. Electrochemical measurements were carried out after 24 h of battery assembly. The galvanostatic charge/discharge experiments were tested in the voltage range of 0.01–3 V at various current densities ranging from 20 to 5000 mA g−1 using the Land battery testing system (Jinnuo Electronics Co., Wuhan, China). Cyclic voltammetry (CV) and electrochemical impedance spectroscopy (EIS) measurements were obtained using an electrochemical workstation (VMP3, Bio-Logic). CV curves were tested in the potential range of 0.01–3 V at a scan rate of 0.5 mV s−1. EIS measurements were carried out at an AC amplitude of 10 mV in the frequency range from 100 kHz to 0.01 Hz.
3. Results and discussions
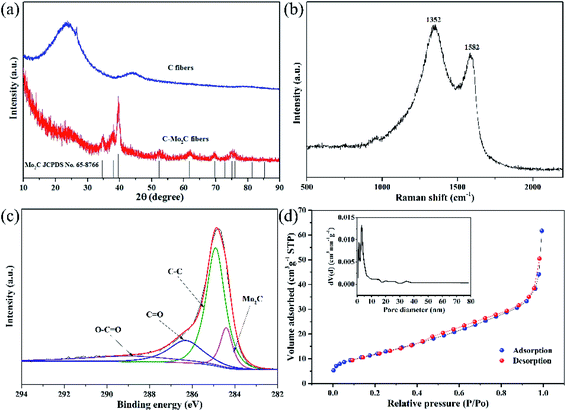
Fig. 2a shows the XRD patterns of the C–Mo2C and C fiber films after carbonization at 800 °C. For the C fiber film, there are two broad diffraction peaks at around 23° and 44° corresponding to amorphous carbon. In the case of the C–Mo2C fiber film, the characteristic peaks of amorphous carbon as well as Mo2C with the space group of P63/mmc (JCPDS no. 65-8766) are seen. Besides, the diffraction peak of amorphous carbon is weaker relative to that of the C fiber film. This can be due to the fact that some of the amorphous carbon transforms into a crystalline product (Mo2C) by reaction with MoO2. Fig. 2b shows the Raman spectrum of the C–Mo2C fiber film, with two intense peaks at 1352 and 1582 cm−1 corresponding to the D band and G bands of carbon.22,23 This suggests that the amorphous carbon matrix is derived from the decomposition of PAN. Fig. 2c shows the C 1s XPS spectra of the C–Mo2C fiber film. The peak at 284.4 eV corresponds to the C–Mo bonds in Mo2C, whereas the other peaks at 284.9, 286.3, and 288.9 eV correspond to the C–C, C![[double bond, length as m-dash]](https://www.rsc.org/images/entities/char_e001.gif) O, and O–C
O, and O–C![[double bond, length as m-dash]](https://www.rsc.org/images/entities/char_e001.gif) O bonds.24,25 Fig. 2d shows the N2 adsorption–desorption isotherms of the C–Mo2C fiber film; from the results, we can infer that it has a specific surface area of 44 m2 g−1 and pore diameters of ∼1.1 and ∼3.1 nm. In addition, the curve also shows some weak peaks between 20 and 35 nm, indicating the presence of few mesopores with diameters in the range of 20–35 nm.
O bonds.24,25 Fig. 2d shows the N2 adsorption–desorption isotherms of the C–Mo2C fiber film; from the results, we can infer that it has a specific surface area of 44 m2 g−1 and pore diameters of ∼1.1 and ∼3.1 nm. In addition, the curve also shows some weak peaks between 20 and 35 nm, indicating the presence of few mesopores with diameters in the range of 20–35 nm.
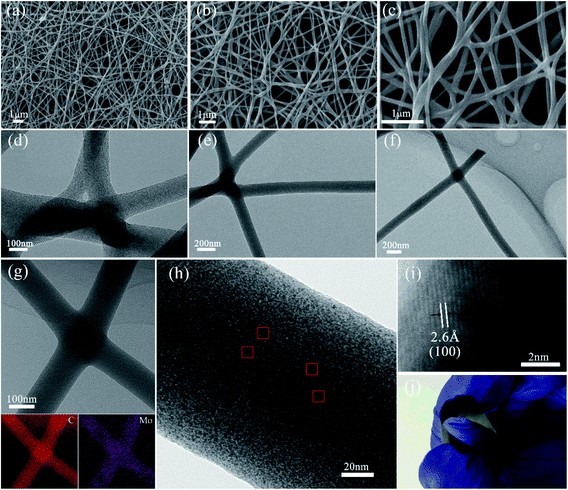
Fig. 3 shows the morphology and microstructure of the C–Mo2C fiber film. The fibers with a diameter of 50–160 nm are randomly distributed and intersect to form a 3D reticular network, which retains the shape of the electrospun precursor fiber but is finer (Fig. S1†). The SEM and TEM images clearly show that the fiber junctions are fused with the aid of MoO2. In contrast, the fiber junctions are not fused in the pure C fiber film (Fig. S3†). It is crucial to improve the mass transfer during the carbonization process for fusing the fiber junctions. Amorphous carbon reacts easily with MoO2 because of lower activation energy of the reaction when compared with that of a reaction between amorphous carbons. (NH4)6Mo7O24·4H2O in the precursor fiber is decomposed into MoO2 above 600 °C and forms highly active C–MoO2–C interface at the fiber junction (Fig. 1c and S2†). When carbonized at 800 °C, MoO2 reacts with the C matrix to generate Mo2C at the C–MoO2–C interface, which increases the mass transfer, leading to the fusing of fiber junctions. To study the distribution of Mo species (Mo2C), energy dispersive X-ray spectroscopy (EDS) mapping was performed, as shown in Fig. 3g, which confirmed that molybdenum is uniformly distributed in the carbon fiber. Fig. 3h shows that Mo2C particles with size of 2–4 nm were dispersed uniformly on the carbon fiber (marked by red squares). The high-resolution TEM image revealed a set of lattice fringes with an interplane spacing of 2.6 Å, which corresponded to the (100) plane of hexagonal Mo2C (Fig. 4i). Due to the fused fiber junctions, the C–Mo2C fiber film showed excellent flexibility, which was better than that of the C fiber film, as shown in Fig. 3j and Movie S1.†
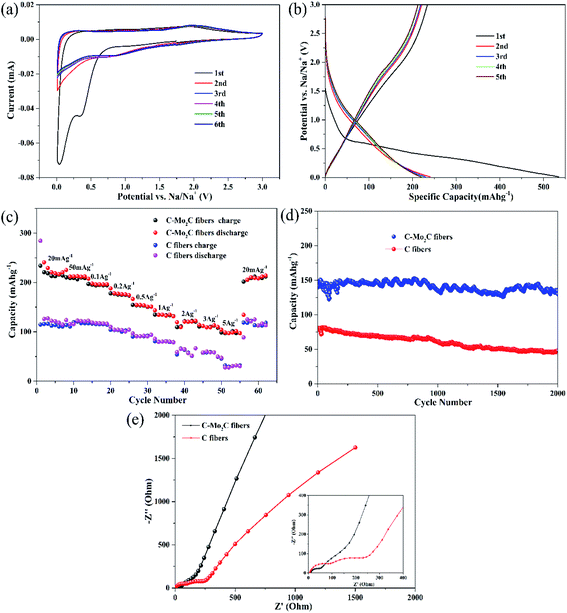
Fig. 4 shows electrochemical performances of the C–Mo2C and C fiber films as anodes of SIBs. The free-standing C–Mo2C and C fiber films are directly used as the working electrodes without additives and binders. Fig. 4a shows the cyclic voltammetry (CV) curves of the C–Mo2C fiber film with the first six cycles in the potential range of 0.01–3 V (vs. Na/Na+) at a scan rate of 0.5 mV s−1. In the first cathodic scan, a broad peak at 0.3 V corresponds to the formation of a solid electrolyte interface (SEI).26,27 In the subsequent cycles, the broad peak around 0.9 V can be due to the conversion reactions between Mo2C and Na+. In the anodic process, the peak around 1.9 V is assigned to the extraction of Na+ from Mo2C. Fig. 4b shows the discharge/charge curves of the C–Mo2C fiber film at a current density of 20 mA g−1 between 0.01 and 3 V versus Na/Na+. The initial discharge and charge capacities are 534.6 and 233.9 mA h g−1, respectively, leading to a limited initial coulombic efficiency (CE) of 43.8%. The huge capacity drop between the first two cycles can be due to the irreversible processes such as SEI formation, decomposition of electrolyte molecules, and trapping of some sodium in the lattice of Mo2C. From the third cycle onwards, CE is higher than 95%, implying high reversibility and stability. The discharge/charge curves of the C fiber film have a CE of 40.3%, which is close to the value for the C–Mo2C fiber film (Fig. S4†). Fig. 4c shows the rate capabilities of C–Mo2C and C fiber films. The C–Mo2C fiber film exhibits higher discharge capacities than the C fiber film under different current densities. The C–Mo2C fiber film exhibits capacities of 212, 134, and 99 mA h g−1, whereas the C fiber film shows low values of 121, 80, and 30 mA h g−1 at current densities of 50, 1000, and 5000 mA g−1, respectively. Fig. 4d shows the cycling performance at a current density of 1 A g−1. The C–Mo2C fiber film exhibits high capacity retention of 90% after 2000 cycles. However, the capacity retention of the C fiber film is 60%. Fig. 4e shows the electrochemical impedance spectroscopy (EIS) curves for C–Mo2C and C fiber films. The C–Mo2C fiber film shows a much lower charge transfer resistance and sodium diffusion resistance when compared with the C fiber film. This reveals that the fused fiber junctions can dramatically reduce the contact resistance of the fibers, which is beneficial for both fast ionic and electronic transport, resulting in excellent cycling stability and high capacity. Additionally, the Mo2C particles provide many electrochemically active sites, leading to additional improvement in sodium storage.
4. Conclusion
In summary, we have presented a new approach to fuse fiber junctions by introducing MoO2, which results in the formation of a highly active C–MoO2–C interface at the fiber junction, and this promotes mass transfer. The fused junction eliminates the contact resistance at the fiber junctions, and this can significantly accelerate the ion/electron transport. Therefore, the self-fused C–Mo2C fiber film shows excellent flexibility and high electrochemical performance. This approach opens up a vast array of new opportunities in flexible high-performance batteries and other low-cost, large-area energy storage devices.Conflicts of interest
There are no conflicts to declare.Acknowledgements
This study was supported by the National Natural Science Foundation of China (grant no. 51672151) and 973 Program of China (No. 2014CB932401).References
- N. Yabuuchi, K. Kubota, M. Dahbi and S. Komaba, Chem. Rev., 2014, 114, 11636–11682 CrossRef CAS PubMed.
- M. D. Slater, D. Kim, E. Lee and C. S. Johnson, Adv. Funct. Mater., 2013, 23, 947–958 CrossRef CAS.
- S.-W. Kim, D.-H. Seo, X. Ma, G. Ceder and K. Kang, Adv. Energy Mater., 2012, 2, 710–721 CrossRef CAS.
- V. Palomares, P. Serras, I. Villaluenga, K. B. Hueso, J. Carretero-Gonzalez and T. Rojo, Energy Environ. Sci., 2012, 5, 5884–5901 CAS.
- M. D. Slater, D. Kim, E. Lee and C. S. Johnson, Adv. Funct. Mater., 2013, 23, 947–958 CrossRef CAS.
- P. Barpanda, T. Ye, S.-i. Nishimura, S.-C. Chung, Y. Yamada, M. Okubo, H. Zhou and A. Yamada, Electrochem. Commun., 2012, 24, 116–119 CrossRef CAS.
- S. Komaba, W. Murata, T. Ishikawa, N. Yabuuchi, T. Ozeki, T. Nakayama, A. Ogata, K. Gotoh and K. Fujiwara, Adv. Funct. Mater., 2011, 21, 3859–3867 CrossRef CAS.
- P.-c. Tsai, S.-C. Chung, S.-k. Lin and A. Yamada, J. Mater. Chem. A, 2015, 3, 9763–9768 CAS.
- K. Tang, L. Fu, R. J. White, L. Yu, M. M. Titirici, M. Antonietti and J. Maier, Adv. Energy Mater., 2012, 2, 873–877 CrossRef CAS.
- S. Wenzel, T. Hara, J. Janek and P. Adelhelm, Energy Environ. Sci., 2011, 4, 3342–3345 CAS.
- Y. Yan, Y. X. Yin, Y. G. Guo and L. J. Wan, Adv. Energy Mater., 2014, 4, 1301584–1301588 CrossRef.
- Y. Cheng, L. Huang, X. Xiao, B. Yao, L. Yuan, T. Li, Z. Hu, B. Wang, J. Wan and J. Zhou, Nano Energy, 2015, 15, 66–74 CrossRef CAS.
- C. Lai, Z. Zhou, L. Zhang, X. Wang, Q. Zhou, Y. Zhao, Y. Wang, X.-F. Wu, Z. Zhu and H. Fong, J. Power Sources, 2014, 247, 134–141 CrossRef CAS.
- Z. Tai, X. Yan, J. Lang and Q. Xue, J. Power Sources, 2012, 199, 373–378 CrossRef CAS.
- B. Zhang, J. Huang and J. K. Kim, Adv. Funct. Mater., 2015, 25, 5222–5228 CrossRef CAS.
- J. Zhu, G. Zhang, X. Yu, Q. Li, B. Lu and Z. Xu, Nano Energy, 2014, 3, 80–87 CrossRef CAS.
- S. An, H. S. Jo, D.-Y. Kim, H. J. Lee, B.-K. Ju, S. S. Al-Deyab, J.-H. Ahn, Y. Qin, M. T. Swihart, A. L. Yarin and S. S. Yoon, Adv. Mater., 2016, 28, 7149–7154 CrossRef CAS PubMed.
- P. C. Hsu, S. Wang, H. Wu, V. K. Narasimhan, D. S. Kong, H. R. Lee and Y. Cui, Nat. Commun., 2013, 4, 2522–2528 Search PubMed.
- H. Wu, D. S. Kong, Z. C. Ruan, P. C. Hsu, S. Wang, Z. F. Yu, T. J. Carney, L. B. Hu, S. H. Fan and Y. Cui, Nat. Nanotechnol., 2013, 8, 421–425 CrossRef CAS PubMed.
- W. Gaynor, G. F. Burkhard, M. D. McGehee and P. Peumans, Adv. Mater., 2011, 23, 2905–2910 CrossRef CAS PubMed.
- E. C. Garnett, W. S. Cai, J. J. Cha, F. Mahmood, S. T. Connor, M. G. Christoforo, Y. Cui, M. D. McGehee and M. L. Brongersma, Nat. Mater., 2012, 11, 241–249 CrossRef CAS PubMed.
- Y. Xiao, P. Sun and M. Cao, ACS Nano, 2014, 8, 7846–7857 CrossRef CAS PubMed.
- Y. Xiao, L. Zheng and M. Cao, Nano Energy, 2015, 12, 152–160 CrossRef CAS.
- R. Li, S. Wang, W. Wang and M. Cao, Phys. Chem. Chem. Phys., 2015, 17, 24803–24809 RSC.
- Q. Gao, X. Y. Zhao, Y. Xiao, D. Zhao and M. H. Cao, Nanoscale, 2014, 6, 6151–6157 RSC.
- L. David, R. Bhandavat and G. Singh, ACS Nano, 2014, 8, 1759–1770 CrossRef CAS PubMed.
- J. Zhang, D.-W. Wang, W. Lv, S. Zhang, Q. Liang, D. Zheng, F. Kang and Q.-H. Yang, Energy Environ. Sci., 2017, 10, 370–376 CAS.
Footnote |
| † Electronic supplementary information (ESI) available: Includes 8 pages containing 2 equations, 5 tables and 1 figure. See DOI: 10.1039/c8ra01908h |
| This journal is © The Royal Society of Chemistry 2018 |


