 Open Access Article
Creative Commons Attribution 3.0 Unported Licence
Hydrogen storage in Mg2Ni(Fe)H4 nano particles synthesized from coarse-grained Mg and nano sized Ni(Fe) precursor
Xi Chena,
Jianxin Zou *abd,
Shuqing Huangc,
Guangli Hec,
Ning Zhaoa,
Xiaoqin Zengabd and
Wenjiang Dingabd
aNational Engineering Research Center of Light Alloy Net Forming, State Key Laboratory of Metal Matrix Composites, Shanghai Jiao Tong University, Shanghai, 200240, P. R. China. E-mail: zoujx@sjtu.edu.cn; Fax: +86-21-34203730; Tel: +86-21-54742381
bShanghai Engineering Research Center of Mg Materials and Applications, School of Materials Science and Engineering, Shanghai Jiao Tong University, Shanghai, 200240, P. R. China
cNational Institute of Clean-and-Low-Carbon Energy, Beijing, 102211, P. R. China
dShanghai Light Alloy Net Forming National Engineering Research Center Co.,Ltd., P. R. China
First published on 23rd May 2018
Abstract
In this work, Mg2Ni(Fe)H4 was synthesized using precursors of nano Ni(Fe) composite powder prepared through arc plasma method and coarse-grained Mg powder. The microstructure, composition, phase components and the hydrogen storage properties of the Mg–Ni(Fe) composite were carefully investigated. It is observed that the Mg2Ni(Fe)H4 particles formed from the Mg–Ni(Fe) composite have a diameter of 100–240 nm and a portion of Fe in the Ni(Fe) nano particles transformed into α-Fe nano particles with the diameter of 40–120 nm. DSC measurements showed that the peak desorption temperature of the Mg2Ni(Fe)H4 was reduced to 501 K and the apparent activation energy for hydrogen desorption of the Mg2Ni(Fe)H4 was 97.2 kJ mol−1 H2. The formation enthalpy of Mg2Ni(Fe)H4 was measured to be −53.1 kJ mol−1 H2. The improvements in hydrogen sorption kinetics and thermodynamics can be attributed to the catalytic effect from α-Fe nano particles and the destabilization of Mg2NiH4 caused by the partial substitution of Ni by Fe, respectively.
1 Introduction
Magnesium hydride has a relatively high hydrogen storage capacity (7.6 wt%), an environmentally friendly nature and low cost, which meets some basic requirements for onboard and stationary applications set by the US DOE. However, the high thermodynamic stability of MgH2 (ΔH = −75 kJ mol−1 H2) is a big hurdle for lowering the hydrogen desorption temperature of Mg-based hydrides.1,2 It has been established that when Mg alloys contain a non-hydride forming element, the value of hydrogenation enthalpy can be decreased. Therefore, alloying is a traditional and effective strategy for altering the thermodynamics of Mg-based alloys for hydrogen storage.One of the typical examples is Mg2Ni, which can react with H2 to form Mg2NiH4. It should be noted that the formation enthalpy of Mg2NiH4 (ΔH = −64.5 kJ mol−1 H2) is lower than that of MgH2 which allows the former to desorb at lower temperatures than MgH2.3 Morinaga et al. found that hydrogen interacted more strongly with Ni atoms rather than Mg atoms in Mg2NiH4.4 This existence of Ni in Mg2NiH4 weakened the Mg–H bond as compared to MgH2, and leads to a lower formation enthalpy of Mg2NiH4. The crystallographic and hydrogen storage properties of Mg2NiH4 were firstly reported by Reilly and Wiswall.3 Since single phase Mg2Ni cannot be simply obtained by casting as phase separation occurs during solidification,5,6 reactive mechanical alloying (RMA), mechanical milling (MM) and high-energy ball milling (HEBM) have been employed to synthesize Mg2Ni or Mg2NiH4.7–11 However, it usually takes a long time to prepare Mg2Ni or Mg2NiH4 via these methods. Therefore, the size of the raw material was reduced to nano-scale to promote the formation of Mg2Ni or Mg2NiH4.12,13 Shao et al. prepared Mg2Ni from Mg and Ni nanoparticles produced by hydrogen plasma-metal reaction.13 It was established that at 553 K and 3 MPa hydrogen pressure, Mg2NiH4 could be generated.
More recently a number of research groups focused on various synthesis methods for doping with additives to further improve the kinetic properties of Mg2Ni.14–17 Xie et al. synthesized nanostructured Mg2Ni1−xCox (x = 0.05, 0.1) alloys through hydrogen plasma–metal reaction.14 The alloys could absorb 2 wt% H2 at 473 K but desorption still required about 573 K. Hara et al. synthesized Mg2Ni alloys with the addition of Y and depleted Mg by casting and vacuum heating.15 The alloys could absorb ∼2–3 wt% H2 at 473 K. Lu et al. prepared the alloy Mg90In5Ni5 containing the Mg14In3Ni3 phase by sintering followed by mechanical milling.16 The alloy has higher reversible hydrogen storage capacity of 3.3 wt% and the minimum dehydrogenation temperature is reduced to 493 K.
Iron is considered as a good catalytic/alloying element to improve kinetics/thermodynamics of Mg-based hydrogen storage materials.18,19 In addition, the hydride of Fe is highly unstable, which may be beneficial for the structural reversibility of Mg2Ni in dehydriding.18 In the present work, the Ni(Fe) nano particles were prepared through an arc plasma method described in previous works.13,20 The formation of the Mg2Ni(Fe)H4 by using Ni(Fe) precursor and its hydrogen sorption kinetic and thermodynamic properties were carefully investigated. Based on the experimental investigations, the mechanisms of the formation and hydrogen sorption behaviors of the Mg2Ni(Fe)H4 were proposed.
2 Experimental
2.1 Sample preparation
In this work, the Ni(Fe) composite nano powder was prepared by an arc plasma evaporation apparatus.20 The purities of commercially available pure Ni and Fe powders are over 99.5% and the particle size ranges from 50 to 150 μm. The preparation of the powder involves several steps. First, pure Ni and Fe powders were mixed homogeneously with a Ni to Fe weight ratio of 3![[thin space (1/6-em)]](https://www.rsc.org/images/entities/char_2009.gif) :
:![[thin space (1/6-em)]](https://www.rsc.org/images/entities/char_2009.gif) 1. Then the mixture was compressed to cylinders with a diameter of 10 mm and height of 7 mm under a uniaxial pressure of 15 MPa at room temperature. These cylinders were put into the reaction chamber of arc plasma evaporation apparatus filled with mixed gases of 0.01 MPa H2 and 0.05 MPa Ar. The Ni(Fe) composite nano powder was produced using arc evaporation with the current set at 150 A. After evaporation and condensation, the powder was passivated in mixed argon and air (7
1. Then the mixture was compressed to cylinders with a diameter of 10 mm and height of 7 mm under a uniaxial pressure of 15 MPa at room temperature. These cylinders were put into the reaction chamber of arc plasma evaporation apparatus filled with mixed gases of 0.01 MPa H2 and 0.05 MPa Ar. The Ni(Fe) composite nano powder was produced using arc evaporation with the current set at 150 A. After evaporation and condensation, the powder was passivated in mixed argon and air (7![[thin space (1/6-em)]](https://www.rsc.org/images/entities/char_2009.gif) :
:![[thin space (1/6-em)]](https://www.rsc.org/images/entities/char_2009.gif) 1) for 12 h.
1) for 12 h.
About 2.0 g mixture of the commercially available Mg powder and Ni(Fe) composite nano powder in a 2![[thin space (1/6-em)]](https://www.rsc.org/images/entities/char_2009.gif) :
:![[thin space (1/6-em)]](https://www.rsc.org/images/entities/char_2009.gif) 1 molar ratio was ball milled for 4 h in a planetary ball miller. The Mg powder has a purity of 99.5% and its particle size ranges from 50 to 150 μm. The ball milling was carried out in a 50 ml stainless steel vessel under 0.1 MPa Ar atmosphere at 200 rpm with a ball-to-powder weight ratio of 30
1 molar ratio was ball milled for 4 h in a planetary ball miller. The Mg powder has a purity of 99.5% and its particle size ranges from 50 to 150 μm. The ball milling was carried out in a 50 ml stainless steel vessel under 0.1 MPa Ar atmosphere at 200 rpm with a ball-to-powder weight ratio of 30![[thin space (1/6-em)]](https://www.rsc.org/images/entities/char_2009.gif) :
:![[thin space (1/6-em)]](https://www.rsc.org/images/entities/char_2009.gif) 1. Then these samples were further heated up to 623 K and 673 K in hydrogen under a pressure of 3.7 MPa. After hydrogenation, samples were cooled down to room temperature and the sample container was evacuated to 10−3 Pa.
1. Then these samples were further heated up to 623 K and 673 K in hydrogen under a pressure of 3.7 MPa. After hydrogenation, samples were cooled down to room temperature and the sample container was evacuated to 10−3 Pa.
2.2 Characterization
The compositions of the Ni(Fe) and Mg–Ni(Fe) powders were analyzed by using inductive coupled plasma emission spectrometer (ICP). The phase identifications of as-milled and hydrogenated composite powders were carried out by X-ray diffraction (XRD) using a D/max 2550VL/PCX apparatus equipped with a Cu Kα radiation source. The morphology and microstructure of the powders were characterized by a JEM-2100F transmission electron microscope (TEM) equipped with an energy dispersive spectrometer (EDS) micro-analysis and a backscattered electron detector. The hydrogen sorption isotherms at various temperatures were obtained using a Sievert type pressure–composition–temperature (PCT) volumetric apparatus provided by Shanghai institute of microsystem and information technology. The dehydriding behaviors of hydrogenated samples were investigated by using differential scanning calorimetry (DSC, Netzsch STA449F3 Jupiter) under 0.1 MPa Ar atmosphere at heating rates of 3, 5 and 10 K min−1 from room temperature to 773 K.3 Results and discussions
3.1 Formation of Mg2Ni(Fe)H4 from Mg and Ni(Fe) powders
Fig. 1 shows the XRD pattern of the as prepared Ni(Fe) powder. These peaks correspond to Ni phase but shift to low angles, suggesting the increased lattice parameter. Based on the XRD patterns, the lattice constant of this phase is determined to be: a = 0.3548 nm, which is higher than that of Ni (a = 0.3535 nm). Such a lattice expansion of Ni can be only attributed to the partial substitution of Ni by Fe. Based on the Scherrer's equation,21 the average grain size of Ni(Fe) is determined to be 80 nm.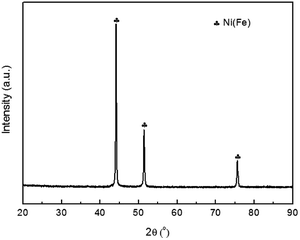 | ||
| Fig. 1 The X-ray diffraction (XRD) pattern of the Ni(Fe) composite powder prepared using arc plasma method. | ||
ICP analysis revealed that Ni content in the as prepared Fe(Ni) composite powder is 61.2 wt%, lower than that in the original mixture (75 wt%). According to the Ohno's model, the vapor generation rate of a metal through hydrogen plasma reaction method is proportional to its reaction parameter (Rp), which can be expressed by the following equation:22
 | (1) |
TEM observations have been done on the as prepared Ni(Fe) composite powder. As seen from Fig. 2a, the shapes of the particles in the Ni(Fe) composite powder are mostly spherical and the particle size ranges from 50 nm to 260 nm with an average size of about 80 nm. Such morphology and size distribution were also observed in pure Ni powder produced by arc plasma method.23,24 The corresponding elemental distribution maps of Ni and Fe (Fig. 2b and c) confirm the fairly homogeneous distributions of Ni and Fe in the Ni(Fe) powder.
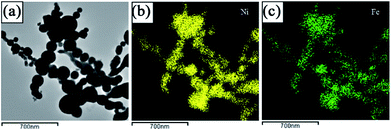 | ||
| Fig. 2 A bright field TEM micrograph of as prepared Ni(Fe) composite powder (a) and the corresponding EDS elemental distribution maps of Ni (b) and Fe (c). | ||
Furthermore, EDS analyses also reveal that the Ni to Fe weight ratio is 59.2![[thin space (1/6-em)]](https://www.rsc.org/images/entities/char_2009.gif) :
:![[thin space (1/6-em)]](https://www.rsc.org/images/entities/char_2009.gif) 40.8, which is in good agreement with the result obtained by the ICP measurement.
40.8, which is in good agreement with the result obtained by the ICP measurement.
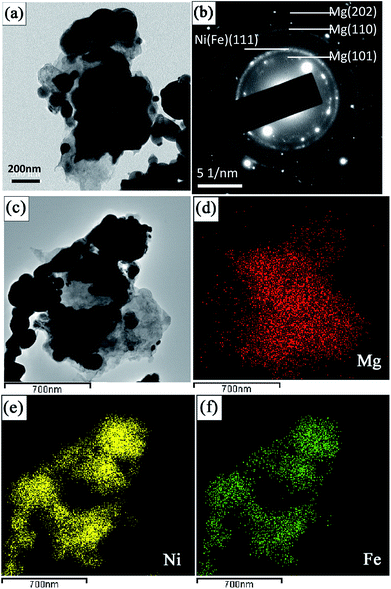
Fig. 3a is the TEM image of the mixture of coarse-grained commercial Mg powder and Ni(Fe) nano powder. It can be seen that there are many smaller particles surrounding those larger ones in this Mg–Ni(Fe) powder. The corresponding SAED pattern (Fig. 3b), with diffraction rings of Mg and Ni(Fe) included, confirms the presence of these phases. The corresponding EDS maps of Mg, Ni and Fe (Fig. 3d–f) confirm the segregations of Ni and Fe elements in the smaller spherical particles and the uniform distribution of Mg element in the bigger irregular ones. Therefore, there are many Ni(Fe) nano particles surrounding coarse-grained commercial Mg particles in the Mg–Ni(Fe) mixture.
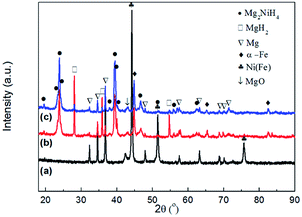
Fig. 4 shows the XRD patterns of the Mg–Ni(Fe) samples before and after hydrogenation. From Fig. 4a, the main phases present in the as milled Mg–Ni(Fe) composite powder are Mg and Ni(Fe). The result is consistent with the SAED pattern of the composite powder (Fig. 3b). For the synthesis of Mg2NiH4, the Mg–Fe(Ni) samples were hydrogenated at 623–673 K under 3.7 MPa H2 for 48 h. The phase components of the Mg–Ni(Fe)–H powders under different conditions were examined using XRD and the results were shown in Fig. 4b and c. Based on the RIR analysis of those XRD patterns, the phase components in the hydrogenated powders were calculated and the results were given in Table 1. After hydrogenation at 623 K under 3.7 MPa H2 for 48 h, peaks from Mg2NiH4 and α-Fe appear on the XRD pattern of the Mg–Ni(Fe)–H powder (Fig. 4b). Meanwhile, Ni(Fe) content reduces from 57.8 wt% in as milled Mg–Ni(Fe) powder to 2.0 wt% in the hydrogenated one. Therefore, with the presence of Ni(Fe) in the Mg–Ni(Fe) powder, Mg2NiH4 is able to be synthesized and then most of Ni(Fe) have been transformed into α-Fe. As the temperature increases from 623 K to 673 K, the diffraction peaks of β-MgH2 become weaker and Ni(Fe) could hardly be detected on the XRD pattern of Mg–Fe(Ni)–H powder. Indeed, higher temperature favors the diffusion of H, Mg and Ni atoms, thus, after hydrogenation at 673 K under 3.7 MPa H2 for 48 h, the yield of Mg2NiH4 increases to 61.2 wt% in the Mg–Ni(Fe)–H powder.
| Sample | Mg–Ni(Fe) | Mg–Ni(Fe)–H (623 K, 3.7 MPa H2) | Mg–Ni(Fe)–H (673 K, 3.7 MPa H2) |
|---|---|---|---|
| β-MgH2 | — | 27.2 | 10.2 |
| MgO | — | 3.0 | 3.0 |
| Mg | 42.2 | 10.7 | 6.8 |
| α-Fe | — | 21.3 | 19.8 |
| Ni(Fe) | 57.8 | 2.0 | — |
| Mg2NiH4 | — | 35.8 | 61.2 |
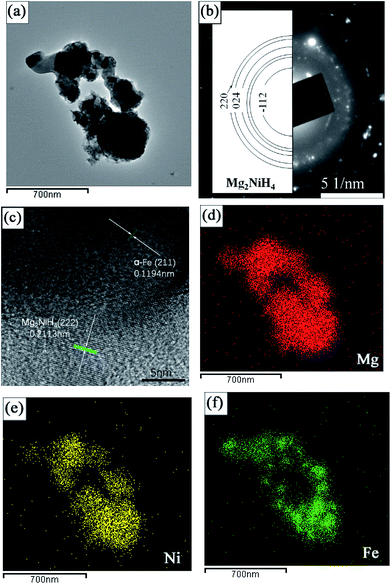
Fig. 5a presents the typical bright field TEM micrograph of Mg2NiH4 in the Mg–Ni(Fe)–H powder prepared at 673 K under a 3.7 MPa hydrogen pressure for 48 h. The size of the Mg2NiH4 nano particles is in the range from 100 to 400 nm. The corresponding SAED pattern is given in Fig. 5b, superimposed with the simulated ring patterns of Mg2NiH4. The majority of the diffraction pattern can be indexed with Mg2NiH4 phase. In addition, the HRTEM observation was further carried out to study the microstructure of nano particles in more detail, as shown in Fig. 5c. It is clearly shown that the bigger bright particles are Mg2NiH4 and the smaller dark particles are α-Fe, according to the measurements of inter-planar spacing. The corresponding EDS maps of Mg, Ni and Fe (Fig. 6d–f) confirm the segregation of Fe element in the smaller spherical particles and the uniform distributions of Ni and Mg elements in the bigger irregular ones. Therefore, after hydrogenation at 673 K under a 3.7 MPa hydrogen pressure for 48 h, Ni atoms diffused from Ni(Fe) nano particles to the coarse-grained Mg particles to form Mg2NiH4 and then a portion of Fe atoms in the Ni(Fe) nano particles transformed into α-Fe nano particles with smaller particle size. The shapes of the α-Fe nano particles are mostly spherical and the particle size ranges from 40 nm to 120 nm with an average size of about 60 nm. In addition, a portion of Fe atoms have also diffused with Ni atoms to form Mg2Ni(Fe)H4, as confined by the EDS analyses.
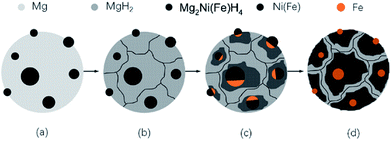 | ||
| Fig. 6 Schematic illustrations showing the formation procedures of the Mg2Fe(Ni)H6 from coarse-grained Mg powder and γ-Fe(Ni) nano particles. | ||
During hydrogenation, two reactions occur in the Mg–Ni(Fe) powder:
| Mg + H2 → MgH2, | (2) |
| 2MgH2 + Ni(Fe) → Mg2NiH4 + α-Fe. | (3) |
The formation of Mg2NiH4 requires a long-distance diffusion of not only small H atoms but also the large metallic species Mg and Ni. Owing to the low diffusion rates of Mg and Ni, the formation of the Mg2NiH4 generally suffers from poor kinetics. In systems based on Mg and Ni that are tailored mainly toward fast sorption kinetics, MgH2 would rather form prior to Mg2NiH4.13,25 Fig. 6 shows a sketch illustrating the formation of Mg2Ni(Fe)H4 nano particles. Firstly, the mixed Mg powders in micron scale and Ni(Fe) nano particles are heated in hydrogen, as shown in Fig. 6a. At the beginning of the absorption, because of the catalytic effect from nickel and iron on the dissociation of gaseous hydrogen,26 MgH2 will form through hydrogen spill over mechanism while Ni(Fe) particles still exists, as seen in Fig. 6b. Then Mg2NiH4 will nucleate at the phase boundaries between MgH2 and Ni(Fe) (Fig. 6c). Due to the partial substitution of Ni by Fe in Ni(Fe) lattice, a portion of Fe atoms have dissolved into the Mg2NiH4 to form Mg2Ni(Fe)H4. Consequently, when most of MgH2 transformed into Mg2Ni(Fe)H4 in the Mg–Ni(Fe)–H powder, Fe in the Ni(Fe) particles transformed into α-Fe nano particles with smaller grain sizes surrounding the Mg2Ni(Fe)H4 particles (see Fig. 6d).
3.2 Hydrogen sorption behaviors of the Mg–Ni(Fe) powder
Fig. 7a shows the PCT curves of the hydrogen absorption–desorption processes for the Mg–Ni(Fe) samples at 598, 623, 648 and 673 K. The data obtained from PCT curves are summarized in Table 2. During H2 absorption, two plateaus are clearly visible on each profile. According to the XRD results given above, two types of hydrides, MgH2 and Mg2Ni(Fe)H4, formed after hydrogenation. It is worth noting that Mg2NiH4 has higher equilibrium pressure than MgH2 due to its lower thermodynamic stability.29,30 The maximum hydrogen absorption capacities at 598, 623, 648 and 673 K are 3.0, 3.1, 3.6 and 3.9 wt%, respectively. It is noticed that the capacities at 598 and 623 K are lower than the theoretical value of 3.6 wt% for Mg2Ni. This is due to the existence of MgO, the residual Mg in the hydride Mg–Ni(Fe) composites, as shown in Fig. 4b. However, when the hydrogenated temperature is above 648 K, the capacity is higher than 3.6 wt%. Since the original molar ratio of Mg and Ni(Fe) in the Mg–Ni(Fe) is 2![[thin space (1/6-em)]](https://www.rsc.org/images/entities/char_2009.gif) :
:![[thin space (1/6-em)]](https://www.rsc.org/images/entities/char_2009.gif) 1 and the ICP analysis revealed that Ni content in the Fe(Ni) powder is 61.2 wt%, the molar ratio of Mg to Ni in the Mg–Ni(Fe) is actually 3.3
1 and the ICP analysis revealed that Ni content in the Fe(Ni) powder is 61.2 wt%, the molar ratio of Mg to Ni in the Mg–Ni(Fe) is actually 3.3![[thin space (1/6-em)]](https://www.rsc.org/images/entities/char_2009.gif) :
:![[thin space (1/6-em)]](https://www.rsc.org/images/entities/char_2009.gif) 1, higher than 2
1, higher than 2![[thin space (1/6-em)]](https://www.rsc.org/images/entities/char_2009.gif) :
:![[thin space (1/6-em)]](https://www.rsc.org/images/entities/char_2009.gif) 1. Therefore, after complete hydrogenation, the maximum hydrogen absorption capacities of the Mg–Ni(Fe) can be higher than 3.6 wt%.
1. Therefore, after complete hydrogenation, the maximum hydrogen absorption capacities of the Mg–Ni(Fe) can be higher than 3.6 wt%.
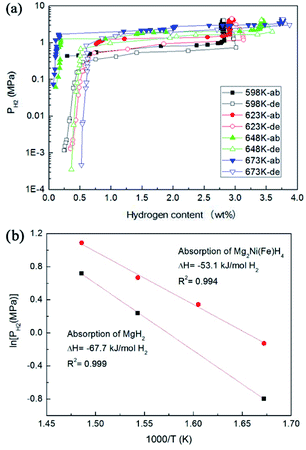 | ||
| Fig. 7 PCT curves at various temperatures of the Mg–Ni(Fe) sample (a), the corresponding van't Hoff plots for MgH2 and Mg2Ni(Fe)H4 in the Mg–Ni(Fe)–H sample (b). | ||
| Temperature (K) | Low plateau of absorption (MPa) | High plateau of absorption (MPa) | Maximum hydrogen content (wt%) |
|---|---|---|---|
| 598 | 0.45 | 0.88 | 3.0 |
| 623 | — | 1.41 | 3.1 |
| 648 | 1.27 | 1.95 | 3.6 |
| 673 | 2.05 | 2.97 | 3.9 |
The van't Hoff plot (ln![[thin space (1/6-em)]](https://www.rsc.org/images/entities/char_2009.gif) P versus 1/T) is used to estimate the thermal stability of hydrides, as shown in Fig. 7b. Table 3 presents the value of the formation enthalpy (ΔH) for the Mg2Ni(Fe)H4 in this work and the ones for the Mg2NiH4 reported in literature. According to the linear fittings of ln
P versus 1/T) is used to estimate the thermal stability of hydrides, as shown in Fig. 7b. Table 3 presents the value of the formation enthalpy (ΔH) for the Mg2Ni(Fe)H4 in this work and the ones for the Mg2NiH4 reported in literature. According to the linear fittings of ln![[thin space (1/6-em)]](https://www.rsc.org/images/entities/char_2009.gif) P versus 1000/T in Fig. 8b, the van't Hoff equations for the hydrogenation are ln(Plow) = −6.392 × 10³/T + 10.57 for MgH2 and ln(Phigh) = −8.138 × 10³/T + 12.81 for Mg2Ni(Fe)H4. The hydrogenation enthalpies (ΔHab) for MgH2 and Mg2Ni(Fe)H4 are therefore calculated to be −67.7 and −53.1 kJ mol−1 H2, respectively. In contrast, Pourabdoli et al. reported that the integral heat of H2 desorption for the MgH2-10 wt% (9Ni–2Mg–Y) nano-composite was about 78 kJ mol−1 H2 measured by using adsorption micro-calorimetry.31 Therefore, the formation enthalpy of Mg2Ni(Fe)H4 is obviously higher than those reported in literature. Van Setten et al. have studied the influence of transition metals (Cu, Fe and Co) on the structural and hydrogen sorption properties of Mg2NiH4 using first-principle based calculations.18 Doping with Co or Cu leads to octahedron is distorted. The hydrogen tetrahedra around such Ni atoms are distorted with Ni–H distances from 1.51 to 1.80 Å, whereas in undoped Mg2NiH4 they are between 1.56 and 1.58 Å. Therefore, the highest hydriding enthalpy, −55.5 kJ mol−1 H2, is found for the Fe doped Mg2NiH4.18 This value is higher than the simulated value for Mg2NiH4 (−63.5 kJ mol−1 H2). Therefore, the results present in this work also confirm that doping with Fe would remarkably destabilize Mg2NiH4 through increasing the formation enthalpy. In addition, the thermodynamics of marginally stable compounds, whereas doping with Fe leads to an unstable compound. In the Fe doped Mg2NiH4, the hydrogenation of MgH2 in the Mg–Ni(Fe) is also slightly improved by the addition of Ni(Fe) nanoparticles, which is in accordance with recent experimental results and theoretical calculations. For instance, the hydriding enthalpies of Mg–Ni nanocomposite coprecipitated from solution and MgH2–Ni/Ti prepared by ball milling were reduced to −70.0 and −67.8 kJ mol−1 H2.32,33 Dai and Shevlin carried out theoretical calculations and found that the significant electronic density donation from the H− ions to an empty d-state of the Ni dopant was able to reduce the H− anion charge to weaken the hydrogen bonding.34,35 Thus, doping with Ni would also remarkably destabilize MgH2 to improve the thermodynamics of MgH2.
P versus 1000/T in Fig. 8b, the van't Hoff equations for the hydrogenation are ln(Plow) = −6.392 × 10³/T + 10.57 for MgH2 and ln(Phigh) = −8.138 × 10³/T + 12.81 for Mg2Ni(Fe)H4. The hydrogenation enthalpies (ΔHab) for MgH2 and Mg2Ni(Fe)H4 are therefore calculated to be −67.7 and −53.1 kJ mol−1 H2, respectively. In contrast, Pourabdoli et al. reported that the integral heat of H2 desorption for the MgH2-10 wt% (9Ni–2Mg–Y) nano-composite was about 78 kJ mol−1 H2 measured by using adsorption micro-calorimetry.31 Therefore, the formation enthalpy of Mg2Ni(Fe)H4 is obviously higher than those reported in literature. Van Setten et al. have studied the influence of transition metals (Cu, Fe and Co) on the structural and hydrogen sorption properties of Mg2NiH4 using first-principle based calculations.18 Doping with Co or Cu leads to octahedron is distorted. The hydrogen tetrahedra around such Ni atoms are distorted with Ni–H distances from 1.51 to 1.80 Å, whereas in undoped Mg2NiH4 they are between 1.56 and 1.58 Å. Therefore, the highest hydriding enthalpy, −55.5 kJ mol−1 H2, is found for the Fe doped Mg2NiH4.18 This value is higher than the simulated value for Mg2NiH4 (−63.5 kJ mol−1 H2). Therefore, the results present in this work also confirm that doping with Fe would remarkably destabilize Mg2NiH4 through increasing the formation enthalpy. In addition, the thermodynamics of marginally stable compounds, whereas doping with Fe leads to an unstable compound. In the Fe doped Mg2NiH4, the hydrogenation of MgH2 in the Mg–Ni(Fe) is also slightly improved by the addition of Ni(Fe) nanoparticles, which is in accordance with recent experimental results and theoretical calculations. For instance, the hydriding enthalpies of Mg–Ni nanocomposite coprecipitated from solution and MgH2–Ni/Ti prepared by ball milling were reduced to −70.0 and −67.8 kJ mol−1 H2.32,33 Dai and Shevlin carried out theoretical calculations and found that the significant electronic density donation from the H− ions to an empty d-state of the Ni dopant was able to reduce the H− anion charge to weaken the hydrogen bonding.34,35 Thus, doping with Ni would also remarkably destabilize MgH2 to improve the thermodynamics of MgH2.
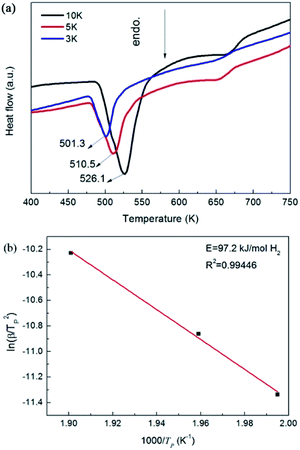 | ||
| Fig. 8 DSC profiles of the Mg–Ni(Fe)–H sample measured at different heating rates (a) and the corresponding ln(β/Tp2)–1000/Tp plot (b). | ||
Fig. 8a shows DSC curves obtained by heating the Mg–Ni(Fe)–H powder up to 723 K at heating rates of 3, 5 and 10 K min−1 under Ar. These curves suggest a two-step desorption behavior by showing two endothermic peaks. The first one is a strong and broad endothermic peak in the lower temperature range, while the second one is a relatively weaker peak in the higher temperature range. Clearly, the strong peak corresponds well to the decomposition of Mg2Ni(Fe)H4 while the weak one results from the decomposition of the MgH2. The peak dehydrogenation temperatures of the Mg2Ni(Fe)H4 in the Mg–Ni(Fe)–H powder at heating rates of 3, 5 and 10 K min−1 are 501.3, 510.6 and 526.1 K, respectively. Zou et al. prepared the Mg-rich Mg–Ni ultrafine particles through the arc plasma method.27 DSC analyses showed that there are three endothermic peaks appeared at 513, 643 and 668 K, which correspond to the phase transformation of Mg2NiH4 from its low temperature form to the high temperature form, the dehydriding of Mg2NiH4 and MgH2, respectively. Therefore, the peak dehydrogenation temperature of the Mg2Ni(Fe)H4 in the Mg–Fe(Ni)–H powder is 117 K lower than that of the Mg2NiH4 in the Mg-rich Mg–Ni ultrafine particles. In addition, it is noteworthy that the peak dehydrogenation temperatures of the Mg2Ni(Fe)H4 in the Mg–Ni(Fe)–H powder is indeed in the temperature range of the phase transformation of Mg2NiH4.36,37 Thus, doping with Fe would improve the hydrogen desorption properties of Mg2NiH4 through promoting the decomposition of the low temperature form of Mg2NiH4.
To further study the desorption behavior of the Mg–Ni(Fe)–H powder, the dehydrogenation activation energy (Ede) was calculated by using Kissinger's method:16,20
 | (4) |
4 Conclusions
In the present work, the formation of Mg2Ni(Fe)H4 in the mixed precursors of the coarse-grained Mg powder and the Ni(Fe) nano powder prepared through arc plasma method was investigated. The microstructure, composition, phase components and hydrogen storage properties of the Mg–Ni(Fe) powder were characterized and the main results are as follows.(1) After sintering of the Mg–Ni(Fe) powder at 673 K under 3.7 MPa H2 for 48 h, the yield of Mg2Ni(Fe)H4 reached 61.2 wt% and a portion of Fe atoms in the Ni(Fe) nano particles transformed into α-Fe nano particles.
(2) Mg2Ni(Fe)H4 shows lower hydrogen desorption temperature and better desorption kinetics when compared to the Mg2NiH4 obtained from arc plasma evaporated Mg–Ni powder. The peak dehydrogenation temperature of Mg2Ni(Fe)H4 is reduced to 501.3 K and the dehydrogenation activation energy is reduced to 97.2 kJ mol−1 H2.
(3) The formation enthalpy of Mg2Ni(Fe)H4 is determined to be −53.1 kJ mol−1 H2, higher than the values reported in literature for Mg2NiH4. The improvements in hydrogen sorption kinetics and thermodynamics can be attributed to the catalytic effect of α-Fe nano particles surrounding the Mg2Ni(Fe)H4 and the destabilization effect caused by Fe substitution for Ni in the Mg2Ni(Fe)H4, respectively.
Conflicts of interest
There are no conflicts to declare.Acknowledgements
This work is supported by the National Key Research and Development Program of China (2016YBF0301001) and National Nature Science Foundation (No. 51771112). Prof. Zou would like to thank the support from the Science and Technology Commission of Shanghai Municipality under grant No. 14JC1491600 and the “Shuguang” scholar project (16SG08) from Shanghai Education Commission.Notes and references
- F. Cheng, Z. Tao, J. Liang and J. Chen, Chem. Commun., 2012, 48, 7334 RSC.
- H. Shao, G. Xin, J. Zheng and X. Li, Nano Energy, 2012, 1, 590 CrossRef.
- J. J. Reilly and R. H. Wiswall, Inorg. Chem., 1968, 7, 2254 CrossRef.
- M. Morinaga and H. Yukawa, Mater. Sci. Eng., A, 2002, 329, 268 CrossRef.
- T. B. Massalski, Binary Alloy Phase Diagrams, American Society for Metals, 1986 Search PubMed.
- A. A. Nayeb-Hashemi and J. B. Clark, J. Phase Equilib., 1985, 6, 238 Search PubMed.
- C. C. Koch, Nanostruct. Mater., 1997, 9, 13 CrossRef.
- J. Huot, H. Enoki and E. Akiba, J. Alloys Compd., 2008, 453, 203 CrossRef.
- A. K. Singh and O. N. Srivastava, J. Alloys Compd., 1995, 227, 63 CrossRef.
- L. Zaluski, A. Zaluska and J. O. Ström-Olsen, J. Alloys Compd., 1995, 217, 245 CrossRef.
- R. A. Varin and T. Czujko, Mater. Manuf. Processes, 2002, 17, 129 CrossRef.
- M. D. Hampton, J. K. Lomness and L. A. Giannuzzi, Int. J. Hydrogen Energy, 2002, 27, 79 CrossRef.
- H. Shao, T. Liu, X. Li and L. Zhang, Scr. Mater., 2003, 49, 595 CrossRef.
- L. Xie, H. Shao, Y. Wang, Y. Li and X. Li, Int. J. Hydrogen Energy, 2007, 32, 1949 CrossRef.
- M. Hara, S. Morozumi and K. Watanabe, J. Alloys Compd., 2006, 414, 207 CrossRef.
- Y. Lu, H. Wang, J. Liu, L. Z. Ouyang, L. Zhu, D. Zhang and M. Zhu, J. Phys. Chem. C, 2015, 119, 26858 Search PubMed.
- L. Z. Ouyang, Z. J. Cao, H. Wang, J. W. Liu, D. L. Sun, Q. A. Zhang and M. Zhu, Int. J. Hydrogen Energy, 2013, 38, 8881 CrossRef.
- M. J. VanSetten and G. A. Wijs, Phys. Rev. B: Condens. Matter Mater. Phys., 2007, 76, 075125 CrossRef.
- S. A. Shevlin and Z. X. Guo, J. Phys. Chem. C, 2013, 117, 10883 Search PubMed.
- J. X. Zou, X. Q. Zeng, Y. J. Ying, X. Chen, H. Guo, S. Zhou and W. J. Ding, Int. J. Hydrogen Energy, 2013, 38, 2337 CrossRef.
- A. L. Patterson, X-ray and Neutron Diffraction, 1966, p. 243 Search PubMed.
- S. Ohno and M. Uda, J. Jpn. Inst. Met., 1984, 48, 640 CrossRef.
- Z. L. Cui, L. F. Dong and C. C. Hao, Adv. Mater. Res., 2013, 734, 1555 Search PubMed.
- Z. Cui, Z. Zhang, C. Hao, L. Dong, Z. Meng and L. Yu, Thin Solid Films, 1998, 318, 76 CrossRef.
- H. Y. Shao, H. Xu, Y. Wang and X. G. Li, Nanotechnology, 2004, 15, 269 CrossRef.
- G. Liang, J. Huot, S. Boily, A. VanNeste and R. Schukz, J. Alloys Compd., 1999, 292, 247 CrossRef.
- J. X. Zou, H. Q. Sun, X. Q. Zeng, G. Ji and W. J. Ding, J. Nanomater., 2012, 592147 Search PubMed.
- E. Rönnebro, J. Jensen, D. Noréus and N. Bjerrum, J. Alloys Compd., 1999, 293, 146 CrossRef.
- K. Nomura, E. Akiba and S. Ono, Int. J. Hydrogen Energy, 1981, 6, 295 CrossRef.
- G. Liang, S. Boily, J. Huot, A. Neste and R. Schulz, J. Alloys Compd., 1998, 268, 302 CrossRef.
- M. Pourabdoli, S. Raygan, H. Abdizadeh and D. Uner, Int. J. Hydrogen Energy, 2013, 38, 11910 CrossRef.
- Y. N. Liu, J. X. Zou, X. Q. Zeng, X. M. Wu, D. J. Li and W. J. Ding, J. Phys. Chem. C, 2014, 118, 18401 Search PubMed.
- H. B. Lu, C. K. Poh, L. C. Zhang, Z. P. Guo, X. B. Yu and H. K. Liu, J. Alloys Compd., 2009, 481, 152 CrossRef.
- J. H. Dai, Y. Song and R. Yang, J. Phys. Chem. C, 2010, 114, 11328 Search PubMed.
- S. A. Shevlin and Z. X. Guo, J. Phys. Chem. C, 2013, 117, 10883 Search PubMed.
- M. L. Post and J. J. Murray, J. Less-Common Met., 1987, 134, 15 CrossRef.
- L. Q. Li, T. Akiyama and J. Yagi, Intermetallics, 1999, 7, 671 CrossRef.
- T. H. Hur, J. S. Han, J. H. Kim and B. K. Kim, J. Nanosci. Nanotechnol., 2011, 11, 6499 CrossRef PubMed.
- J. Cermak and L. Kral, Defect Diffus. Forum, 2009, 283, 639 CrossRef.
- S. Giusepponi and M. Celino, Int. J. Hydrogen Energy, 2013, 38, 15254 CrossRef.
- M. Polanski, J. Bystrzycki, R. A. Varin and T. Plocinski, Int. J. Hydrogen Energy, 2001, 36, 1059 CrossRef.
- A. Bassetti, E. Bonetti, L. Pasquini, A. Montone, J. Grbovic and M. Vittori Antisari, Eur. Phys. J. B, 2005, 43, 19 CrossRef.
| This journal is © The Royal Society of Chemistry 2018 |

