 Open Access Article
Effect of thiophene S on the enhanced ORR electrocatalytic performance of sulfur-doped graphene quantum dot/reduced graphene oxide nanocomposites†
Fei Li‡
a,
Lang Sun‡a,
Yi Luoa,
Ming Li*a,
Yongjie Xua,
Guanghui Hua,
Xinyu Lia and
Liang Wang *b
*b
aCollege of Science, Guilin University of Technology, Guilin 541004, P. R. China. E-mail: liming928@163.com
bInstitute of Nanochemistry and Nanobiology, School of Environmental and Chemical Engineering, Shanghai University, Shanghai 200444, P. R. China. E-mail: wangl@shu.edu.cn
First published on 29th May 2018
Abstract
In this study, a novel and simple hydrothermal method was developed to synthesize sulfur-doped graphene quantum dots (S-GQDs) with a diameter of 1–6 nm and S-GQD/reduced graphene oxide hybrids. The results indicated that an increase in the sulfur content led to superior ORR electrocatalytic activity. Moreover, it is found that thiophene S plays a significant role in the electrocatalytic activity. In addition, the average electron transfer number depends on the content of thiophene S. It is believed that the proposed synthesis strategy is a general and effective method for designing high-performance metal-free electrocatalytic materials.
1. Introduction
In fuel cells1,2 and metal–air batteries,3 the oxygen reduction reaction (ORR) plays an important role in energy conversion and other applications such as wastewater purification and corrosion protection.4,5 So more and more attention has been paid to the field of electrocatalysis.6,7 At present, platinum and its compound materials are the most traditional cathodic activity catalysts for the ORR.8–10 Yousaf et al. have investigated the electrocatalytic performance of Pt and Pd alloys for methanol oxidation reactions and ORR.11,12 However, platinum and its alloys have disadvantages, such as high cost, scarce resources and inferior durability, that impede their widespread commercialization and limit their performance.1,8 Therefore, there is an urgent need to search for new cheap metal or metal-free catalysts with unexceptionable electrocatalytic properties for ORRs.Graphene quantum dots (GQDs) are emerging as a new type of quantum dots with zero-dimensional carbon nanostructures of size below 10 nm; in addition to all the features of graphene, GQDs exhibit edge effects and quantum confinement;13 therefore, development of efficient methods for the preparation of GQDs has gained researchers' interest.14–18 The edge effect of GQDs plays an important role in electrocatalysis as electrochemically catalyzed reactions occur at underlying affluent edge sites rather than at basal planes; for example, Jin et al. have investigated the ORR and found that GQDs cleave the graphene nanoribbons and result in superb electrocatalytic activity in alkaline media.19 Yang et al. reported that graphene doped with sulfur and selenium also showed better property for catalytic performance than the commercial Pt/C in alkaline media.20 However, the abovementioned studies are mainly focused on the synthesis and the corresponding enhanced electrocatalytic performance of GQDs, and investigations on the effect of S-bonding configuration on the electrocatalytic performance have rarely been reported.
Therefore, in this study, we synthesized S-doped graphene quantum dots (S-GQDs) with different S-bonding configurations and investigated the effect of S-bonding configuration on the microstructures and electrocatalytic performance. S-GQDs/reduced graphene oxide (S-GQDs/r-GO) was prepared by a facile hydrothermal method via the addition of sulfur powder. The results indicated that an increase in the sulfur content led to better electrocatalytic activity. Moreover, it can be observed that thiophene S plays an important role in the electrocatalytic activity. In addition, the average electron transfer number depends on the content of thiophene S. To the best of our knowledge, this is the first report about the effect of S-bonding configuration on the electrocatalytic performance.
2. Experimental
2.1. Preparation of GO
We can prepare graphene oxide by the modified Hummers method via oxidation of graphene powder.21 The preparation was conducted as follows: graphite (3.0 g) was added to concentrated sulfuric acid (70 mL) and mixed well at room temperature followed by the addition of sodium nitrate (1.5 g); then, the temperature was cooled down to 0 °C. To maintain the temperature of the mixture solution below 20 °C, we added potassium permanganate (KMnO4, 9.0 g). Then, the mixture solution was kept in a water bath at 35–40 °C for about 30 min to obtain a thick paste; the obtained mixture was diluted by adding 140 mL of water, and the suspension was stirred for another 15 min. Further, 20 mL of H2O2 (30%) was added slowly followed by the addition of 500 mL of water. The obtained solution changed from brown to yellow. The solution was filtered and washed with an aqueous solution of HCl (250 mL) to remove metal ions, then washed repeatedly with deionized water, and centrifuged to dislodge the acid. The resulting solid was dissolved in water, and an aqueous solution of GO (0.5 wt%) was obtained by ultrasonication for 60 min. To remove any aggregates, the brown dispersion was centrifuged at 4000 rpm for about 0.5 h; finally, the obtained mixture was purified by dialysis for about 7 days to dislodge the residual impurities and stored for use in further experiments.2.2. Preparation of S-GQDs
S-GQDs were prepared using a method reported in the literature.22,23 Briefly, S-GQDs were prepared by typical hydrothermal treatment. Herein, 1.5 g GQDs was first dissolved in 300 mL H2O containing different amounts of sulfur powder (the weights of S were 0.12, 0.63 and 0.25 g for S-GQDs-0.12, S-GQDs-0.63 and S-GQDs-0.25 samples, respectively) and mixed to produce a homogeneous solution. The mixture was then transferred into a Teflon-lined autoclave and heated at 180 °C for 12 h. The autoclave was cooled down to room temperature. The obtained hybrid solution was filtered using a microporous PTFE membrane (50 mm, 0.22 μm) to remove undissolved carbon particles and then dialyzed using a dialysis membrane (3500 MWCO) for 24 h to dislodge excess sulfate radicals and carbonate ions. Finally, the obtained S-GQDs were dried at 80 °C for use in further experiments.2.3. Preparation of S-GQDs/r-GO
For this, 4 mL GO aqueous dispersion (1 mg mL−1) prepared by the Hummers method was added to 15 mL deionized water. Then, 1 mL aqueous solution of S-GQDs was added to the abovementioned mixture. After 0.5 h of ultrasonication, the solution was transferred into a 50 mL Teflon-lined autoclave and heated at 180 °C for 12 h. Reduced GO (r-GO) and S-GQDs were conglutinated after the hydrothermal treatment. Then, the temperature of the autoclave was brought down to about 20 °C. Finally, the S-GQDs/r-GO solution was obtained and dried for use in the following tests.2.4. Characterization
Field-emission transmission electron microscopy (FE-TEM) was used to analyze the morphology of the sample using a JEM-2100F electron microscope. X-Ray Photoelectron Spectroscopic (XPS) data were obtained using an ESCALAB 250Xi electron spectrometer with Al Kα radiation (1486.6 eV). Electrochemical tests were carried out in a three-electrode system using an electrochemical workstation (Shanghai Chenhua CHI750E). Cyclic voltammetry (CV) tests were performed in a 0.1 M KOH solution with saturated N2 or O2. A Pt wire electrode was used as the counter electrode, and SCE was used as the reference electrode. The rotating disk electrode (RDE) measurements (Gamry Instruments) were carried out at different rotation rates (225, 400, 900, 1250, 1600, 2000, and 2500 rpm) from −1.0 V to 0.2 V in a 0.1 M KOH electrolyte. The sample solution (1 mg mL−1) contains 50 μL Nafion solution (5 wt%), 450 μL isopropyl alcohol and 500 μL deionized water. Herein, 6 μL of the sample solution was dropped onto a glassy carbon RDE electrode. For comparison, hydrothermally prepared graphene and commercial Pt/C catalyst (20 wt% platinum on carbon black) with the similar amount were studied. The commercial Pt/C catalyst (20 wt%) was purchased from Johnson Matthey.3. Results and discussion
Fig. 1 shows the schematic of preparation of S-GQDs via a typical hydrothermal treatment; polymerization of pyrene was conducted to form single-crystalline GQDs; then, S-GQDs were prepared by adding sulfur powder as the source of S and mixing with the obtained GQDs under hydrothermal conditions. We obtained two kinds of doping sulfur: thiophene sulfur and oxide sulfur, which led to the chemical reaction between sulfur and oxygen-containing groups, such as –OH, C![[double bond, length as m-dash]](https://www.rsc.org/images/entities/char_e001.gif) O, and –COOH, on the surfaces (or edges) of GQDs. We can obtain the mixture of S-GQDs and GOs through sonication. The hydrothermal treatment was conducted by heating the mixture at 180 °C and maintaining at this temperature for 12 h. The connection between the S-GQDs and GO sheets were achieved by the hydrogen bonds. Via hydrothermal treatment, hydroxyl and carboxyl functional groups of S-GQDs and GO sheets underwent intramolecular and/or intermolecular dehydration, leading to tight linkage of S-GQDs/r-GO by π–π stacking and covalent bonds.24
O, and –COOH, on the surfaces (or edges) of GQDs. We can obtain the mixture of S-GQDs and GOs through sonication. The hydrothermal treatment was conducted by heating the mixture at 180 °C and maintaining at this temperature for 12 h. The connection between the S-GQDs and GO sheets were achieved by the hydrogen bonds. Via hydrothermal treatment, hydroxyl and carboxyl functional groups of S-GQDs and GO sheets underwent intramolecular and/or intermolecular dehydration, leading to tight linkage of S-GQDs/r-GO by π–π stacking and covalent bonds.24
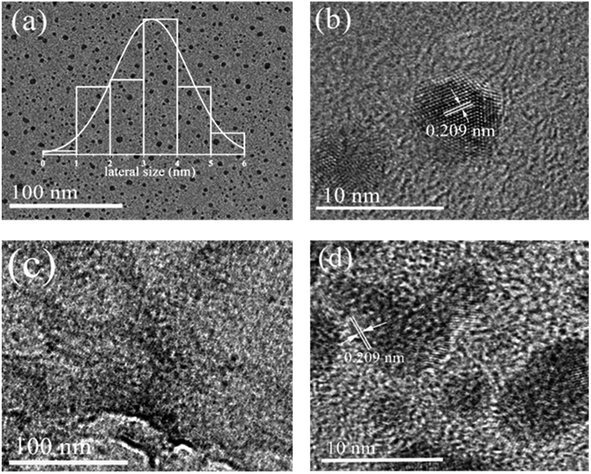
Fig. 2 shows the FETEM images of S-GQDs-0.25 (a and b) and S-GQDs-0.25/r-GO (c and d) obtained at different magnifications for the observation of morphological characteristics. Fig. 2a shows the TEM image of granular S-GQDs-0.25, and the size distribution is very uniform. The size distribution of S-GQDs was estimated by measuring the diameters of S-GQDs-0.25 in TEM images. The size of S-GQDs ranged from 1 nm to 6 nm, and the average diameter was 3 nm (insets in Fig. 2a). Fig. 2b shows the HRTEM image of S-GQDs-0.25, and we can obtain the plane lattice spacing of 0.209 nm, which is similar to the in-plane lattice spacing of graphene.25–27 Fig. 2c shows that granular S-GQDs-0.25 are uniformly distributed on r-GO after hydrothermal treatment. In addition, Fig. 2d shows that r-GO has no influence on the properties of S-GQDs.
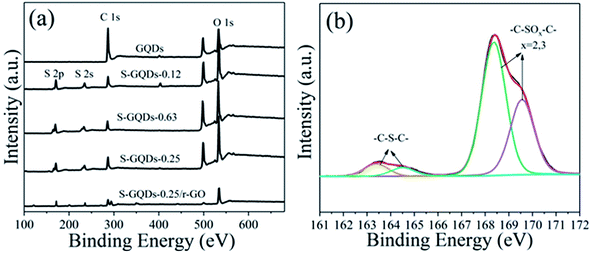
The elemental compositions and S species in S-GQDs were further investigated by XPS. The XPS full spectra (Fig. 3a) show that the same two peaks at approximately 284 eV (C1s) and 533 eV (O1s) exist in GQDs and S-GQDs. Notably, the O1s signal of S-GQDs is closely linked to sulfur-containing groups. Extra peaks at approximately 168 eV (S2p) and 229 eV (S2s) observed in S-GQDs confirmed that the S element was successfully doped into the framework of GQD.28,29 Table 1 indicates atomic analyses based on XPS measurements. The appearance of O is critical to GQDs and S-GQDs due to nitration of pyrene. In addition, the S content reached as high as 19.53%, proving the efficiency of S doping using 0.25 g S powder. The addition of excessive amounts of sulfur powder inhibits the combination between S elements and GQDs, resulting in reduced atomic percentage of S-GQDs. Under high resolution, Fig. 3b clearly shows that the S2p spectra of S-GQDs-0.25 are divided into two due to two species of S: thiophene S (approximately at 163.3 eV and 164.4 eV) and oxide S (approximately at 168.5 eV and 169.5 eV), according to their binding energies.20,30,31 Fig. S1† shows the similar peak deconvolution of S2p core level for S-GQDs-0.12 and S-GQDs-0.63.
 | ||
| Fig. 3 (a) XPS spectra of GQDs, S-GQDs-0.25, S-GQDs-0.63, S-GQDs-0.25 and S-GQDs-0.25/r-GO, and (b) peak of deconvolution of S2p core level of S-GQDs-0.25. | ||
| Samples | C (at%) | O (at%) | S (at%) |
|---|---|---|---|
| GQDs | 63.49 | 35.17 | — |
| S-GQDs-0.12 | 36.74 | 48.64 | 12.79 |
| S-GQDs-0.63 | 32.29 | 51.28 | 15.06 |
| S-GQDs-0.25 | 33.51 | 45.43 | 19.53 |
For further studying the electrocatalytic activity of doped-S in ORR, we adjusted the amount of sulfur powder in the preparation of samples with different contents of doped-S. With the addition of different amounts of sulfur powder, the S contents of different samples increased from 12.79% to 19.53% (in Table 2, the ratios of different S species are given, derived using the equation: SX% = SX/(S1 + S2) × 100%, where S1 and S2 represent the peak areas of thiophene sulfur and oxide sulfur, which are acquired from peak deconvolution of S2p XPS spectra).
| Samples | S (at%) | Thiophene S (at%) | Oxide S (at%) |
|---|---|---|---|
| S-GQDs-0.12 | 12.79 | 12.28 | 87.72 |
| S-GQDs-0.63 | 15.06 | 30 | 70 |
| S-GQDs-0.25 | 19.53 | 25.6 | 74.4 |
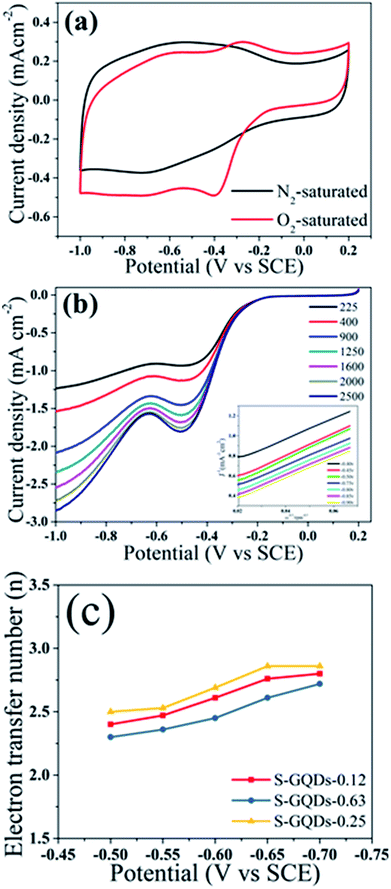
ORR is an essential electrochemical process in metal–air batteries and usually assessed using the following parameters: onset potential, electron transfer number, and oxygen reduction peak.32,33 To research the catalytic activity of these samples, cyclic voltammetry (CV) was performed in O2- or N2-saturated 0.1 M KOH electrolyte using conventional three-electrode electrochemical cells. In Fig. 4a, S-GQDs-0.25/r-GO displays capacitive currents with current density in a N2-saturated electrolyte from −1.0 V to +0.2 V. By contrast, S-GQDs-0.25/r-GO shows a distinct cathodic peak at about −0.39 V with a current density of −0.51 mA cm−2 in O2-saturated electrolytes. Linear sweep voltammetry of S-GQDs-0.25/r-GO (Fig. 4b) showed that the current density increased, conducive to accelerate diffusion in the KOH solution with the increasing rotation rate.
We can calculate the electron transfer numbers (n) to further investigate the electrocatalytic activity using the equations of Koutecky–Levich34 (in ESI†), and homologous curves of S-GQDs-0.25/r-GO are drawn from −0.7 V to −0.9 V versus SCE (inset in Fig. 4b), which uncover a first-order reaction of dissolved oxygen, as described by the matched lines. The electron transfer numbers of S-GQDs-0.25/r-GO reached 2.5–2.86 within the potential range from −0.5 V to −0.7 V. Similarly, we determined the electron transfer numbers of S-GQDs-0.12/r-GO and S-GQDs-0.63/r-GO to be 2.4–2.8 and 2.3–2.72, respectively (Fig. 4c). We observed that S-GQDs-0.25/r-GO exhibited a better four-electron reaction.
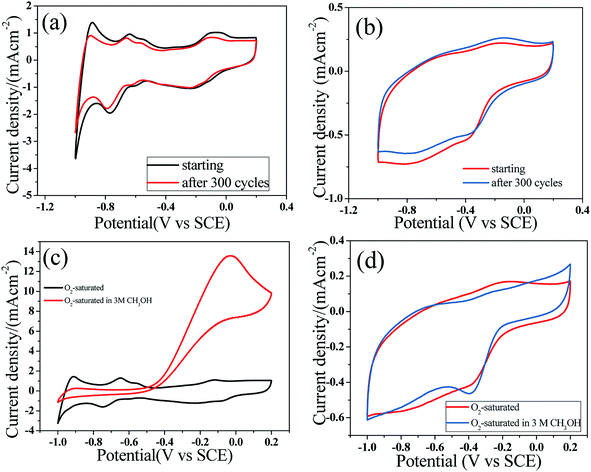
After 300 CV cycles, there was no significant decrease in current in O2-saturated KOH electrolytes. This result indicates that S-GQD-0.25/r-GO (Fig. 5b) and Pt/C (20 wt%) (Fig. 5a) have similar stable catalytic activities.34 Compared with the commercial Pt/C catalysts, the S-doped materials have excellent stability and tolerance in an O2-saturated electrolyte containing 3 M methanol.34,35 In our study, S-GQD-0.25/r-GO presented fundamental catalytic properties. S-GQD-0.25/r-GO sample also exhibited excellent methanol tolerance characteristic in an O2-saturated electrolyte containing 3 M methanol (Fig. 5d), and in the same test environment, the cathodic oxygen reduction peak of Pt/C (20 wt%) disappeared (Fig. 5c). Although S-GQD-0.25/r-GO displayed advanced stability than Pt/C (20 wt%), the onset potentials of S-GQDs-0.25/r-GO were still lower than those of Pt/C, as shown in Fig. S2.†
Fig. 6a shows the distribution of two S species in S-GQDs obtained using different S contents in the reaction. Fig. 6b and c display the average electron transfer numbers according to different S contents and thiophene S contents, respectively. As shown in Fig. 6b, the average electron transfer numbers reached 2.515 for S-GQDs-0.12/r-GO, 2.568 for S-GQDs-0.63/r-GO and 2.726 for S-GQD-0.25/r-GO. Interestingly, the average electron transfer numbers of S-GQDs/r-GO increased with the increasing thiophene S contents (Fig. 6c). Depending on these results, we can conclude that the more the S content, the better the electrocatalytic activity for these samples, and thiophene S plays an important role in the electrocatalytic activity. The electron numbers increased with the increasing thiophene S contents. Thus, the electrocatalytic activity of S-GQDs/r-GO samples can be controlled by regulating the thiophene S contents.
4. Conclusion
In summary, different amounts of sulfur (0.12, 0.25, and 0.63 g) were used to prepare S-GQDs with different S-bonding configurations in GQDs. It was observed that an increase in the sulfur content led to better electrocatalytic activity. Moreover, thiophene S plays an important role in electrocatalytic activity. In addition, the average electron transfer number depends on the thiophene S content. The present study provides some insights into the ingenious synthesis of high-performance metal-free electrocatalytic materials.Conflicts of interest
There are no conflicts to declare.Acknowledgements
This work was financially supported by the National Natural Science Foundation of China (No. 11764011 & 11364010 & 51662004 & 21671129) and the Natural Science Foundation of Guangxi Province (No. 2016GXNSFAA380008), P. R. China.References
- Y. Mun, M. J. Kim, S. A. Park, E. Lee, Y. Ye, S. Lee, Y. T. Kim, S. Kim, O. H. Kim and Y. H. Cho, ACS Sustainable Chem. Eng., 2018, 222, 191–199 Search PubMed.
- A. B. Yousaf, M. Imran, A. Zeb, X. Xie, K. Liang, X. Zhou, C. Z. Yuan and A. W. Xu, Catal. Sci. Technol., 2016, 6, 4794–4801 Search PubMed.
- E. M. Erickson, M. S. Thorum, R. Vasic, N. S. Marinkovic, A. I. Frenkel, A. A. Gewirth and R. G. Nuzzo, J. Am. Chem. Soc., 2012, 134, 197–200 CrossRef PubMed.
- A. Goux, T. Pauport and D. Lincot, Electrochim. Acta, 2006, 51, 3168–3172 CrossRef.
- Z. Y. Lin, G. H. Waller, Y. Liu, M. L. Liu and C. P. Wang, Carbon, 2013, 53, 130–136 CrossRef.
- A. B. Yousaf, M. Imran, M. Farooq and P. Kasak, RSC Adv., 2018, 8, 3374–3380 RSC.
- A. B. Yousaf, M. Imran, S. J. Zaidi, P. Kasak, T. M. Ansari, S. Manzoor and G. Yasmeen, J. Mater. Chem. A, 2017, 5, 10704–10712 Search PubMed.
- N. M. Markovic, T. J. Schmidt, V. Stamenkovic and P. N. Ross, Fuel Cells, 2001, 1, 105–116 CrossRef.
- B. Lim, M. Jiang, P. H. C. Camargo, E. C. Cho, J. Tao, X. M. Lu, Y. M. Zhu and Y. N. Xia, Science, 2009, 324, 1302–1305 CrossRef PubMed.
- S. J. Gou and S. H. Sun, J. Am. Chem. Soc., 2012, 134, 2492–2495 CrossRef PubMed.
- A. B. Yousaf, M. Imran, P. Kasak, F. S. Zavahir, S. J. Zaidi and C. Fernandz, Catal. Sci. Technol., 2017, 7, 3283–3290 Search PubMed.
- A. B. Yousaf, M. Imran, N. Uwitonze, A. Zeb, S. J. Zaidi, T. M. Ansari, G. Yasmeen and S. Manzoor, J. Phys. Chem. C, 2017, 121, 2069–2079 Search PubMed.
- D. Y. Pan, J. C. Zhang, Z. Li and M. H. Wu, Adv. Mater., 2010, 46, 3681–3683 Search PubMed.
- T. Palaniselvam, M. O. Valappil, R. Illathvalappil and S. Kurungot, Energy Environ. Sci., 2014, 7, 1059–1067 Search PubMed.
- L. Tang, J. J. Wang, C. T. Jia, G. X. Lv, G. Xu, W. T. Li, L. Wang, J. Y. Zhang and M. H. Wu, Appl. Catal., B, 2017, 205, 587–596 CrossRef.
- L. Wang, B. Wu, W. T. Li, Z. Li, J. Zhan, B. J. Geng, S. L. Wang, D. Y. Pan and M. H. Wu, J. Mater. Chem. B, 2017, 5, 5355–5361 RSC.
- D. Y. Pan, J. K. Jiao, Z. Li, Y. T. Guo, C. Q. Feng, Y. Liu, L. Wang and M. H. Wu, ACS Sustainable Chem. Eng., 2015, 3, 2405–2413 CrossRef.
- L. Wang, W. T. Li, B. Wu, Z. Li, S. L. Wang, D. Y. Pan and M. H. Wu, Chem. Eng. J., 2016, 300, 75–82 CrossRef.
- H. L. Jin, H. H. Huang, Y. H. He, X. Feng, S. Wang, L. M. Pai and J. C. Wang, J. Am. Chem. Soc., 2015, 137, 7588–7591 CrossRef PubMed.
- Z. Yang, Z. Yao, G. Y. Fang, G. F. Li, H. G. Nie, X. M. Zhou, X. A. Chen and S. M. Huang, ACS Nano, 2012, 6, 205–211 CrossRef PubMed.
- W. S. Hummer and R. E. Offeman, J. Am. Chem. Soc., 1958, 80, 1339 CrossRef.
- L. Wang, Y. L. Wang, T. Xu, H. Liao, C. Yao, Y. Liu, Z. Li, Z. Chen, Z. Chen, D. Pan, L. Sun and M. Wu, Nat. Commun., 2014, 5, 53–57 Search PubMed.
- L. Wang, W. T. Li, B. Wu, Z. Li, D. Y. Pan and M. H. Wu, Chem. Eng. J., 2017, 309, 374–380 CrossRef.
- Y. Xu, K. Sheng, C. Li and G. Shi, ACS Nano, 2010, 4, 4324–4330 CrossRef PubMed.
- B. X. Zhang, H. Gao and X. L. Li, New J. Chem., 2014, 38, 4615 RSC.
- M. Xue, L. Zhang, M. Zou, C. Lan, Z. Zhan and S. Zhao, Sens. Actuators, 2015, 219, 50–56 CrossRef.
- Y. Wang, L. Zhang, R. P. Liang, J. M. Bai and J. D. Qiu, Anal. Chem., 2013, 85, 9148–9155 CrossRef PubMed.
- Y. Q. Dong, H. C. Pang, H. B. Yang, C. X. Guo, J. W. Shao, Y. W. Chi, C. M. Li and T. Yu, Angew. Chem., Int. Ed., 2013, 52, 7800–7804 CrossRef PubMed.
- D. Sun, R. Ban, P. H. Zhang, G. H. Wu, J. R. Zhang and J. J. Zhu, Carbon, 2013, 64, 424–434 CrossRef.
- L. Ji, J. Yan, J. Mietek and Q. S. Zhang, Angew. Chem., Int. Ed., 2012, 51, 11640 CrossRef PubMed.
- Y. Su, Y. Zhang, X. Zhuang, S. Li, D. Wu, F. Zhang and X. Feng, Carbon, 2013, 62, 296–301 CrossRef.
- M. K. Debe, Nature, 2012, 486, 43–51 CrossRef PubMed.
- Y. Jiao, Y. Zheng, M. Jaroniec and S. Z. Qiao, J. Am. Chem. Soc., 2014, 136, 4394–4403 CrossRef PubMed.
- W. Chen and S. Chen, Angew. Chem., Int. Ed., 2009, 48, 4386–4389 CrossRef PubMed.
- L. Sun, Y. Luo, M. Li, G. H. Hu, Y. J. Xu, T. Tang, J. F. Wen, X. Y. Li and L. Wang, J. Colloid Interface Sci., 2017, 508, 154–158 CrossRef PubMed.
Footnotes |
| † Electronic supplementary information (ESI) available. See DOI: 10.1039/c8ra02040j |
| ‡ These authors contributed equally to this work. |
| This journal is © The Royal Society of Chemistry 2018 |


