 Open Access Article
Mg-promotion of Ni natural clay-supported catalysts for dry reforming of methane
H. Liua,
P. Da Costaa,
H. Bel Hadj Taiefb,
M. Benzinab and
M. E. Gálvez *a
*a
aSorbonne Université, CNRS, Institut Jean Le Rond d’Alembert, F-78210 St Cyr L'Ecole, France. E-mail: elena.galvez_parruca@sorbonne-universite.fr
bLaboratoire Eau, Energie et Environnement (LR3E), Code: AD-10-02, Ecole Nationale d'Ingénieurs de Sfax, Université de Sfax, B.P1173.W.3038 Sfax, Tunisia
First published on 29th May 2018
Abstract
Mg-promotion of natural clay based Ni-catalysts was considered, as a way of boosting the dry reforming of methane (DRM) activity of these materials. The results of the DRM experiments performed at temperatures from 600 °C to 850 °C evidenced much higher methane and CO2 conversions for the Mg-promoted catalysts. Mg-promotion led of course to a significant increase of CO2-adsorption ability (basicity). However, the increased catalytic activity of the Mg-promoted materials was rather linked to increased Ni-dispersion and Ni0 crystallite size. Indeed, independent of the physico-chemical properties of the support, the presence of Mg led to the formation of a MgNiO2 mixed phase that, upon reduction, resulted in the formation of metallic Ni clusters having sizes around 7–9 nm, considerably smaller than in any of the non-promoted catalysts. Carbon formation was found to take place to a greater extent in the presence of the Mg-promoted catalysts, due to C–H bond activation leading also to favored direct methane decomposition (DMD). In spite of this, the activity of the Mg-promoted catalysts was well maintained over 5 hour DRM experiments performed at 750 °C.
1. Introduction
As a consequence of the world's increasing energy demand and the sustained utilisation of fossil fuels, CO2 emissions to our atmosphere keep on increasing while the concentration of this greenhouse gas is quite far from being stabilized.1 The potential dramatic consequences of increasing atmospheric CO2 concentrations, i.e. overall temperature increase on the Earth's surface, have led to a general sense of awareness recently translated into different actions aiming for a more sustainable economic/industrial development. Though the use of renewable energy resources stands as the unique solution for the attainment of a future carbon-free energy-generation scenario, natural gas can play a key role allowing a soft transition into this 100% renewable scenario.Methane can be chemically processed together with CO2 through dry reforming (DRM), yielding syngas (H2/CO) at a theoretical ratio of 1, ideal for subsequent Fischer–Tropsch synthesis.2–4 The utilisation of CO2 in the production of synthetic fuels can be moreover integrated in overall zero-emission cycles, when combined with CO2 capture from either concentrated or diluted sources. Such technologies can play a definitive role in our transition to a C-free fully renewable future.
The DRM reaction becomes thermodynamically favourable at temperatures slightly higher than 640 °C, but it is strongly hindered by its reaction kinetics. This is due to the sluggish activation of methane, with its strong C–H bond (BE 439 kJ mol−1)5 and its symmetrical molecular structure leading to low chemical activity.6–9 Consequently, DRM needs to be run in the presence of a catalyst. Even though, the catalytic materials may suffer from severe sintering and deactivation, inherent to such stringent operation conditions. Moreover, DRM catalysts need to be not only active but also selective, since several concomitant reactions, i.e. direct methane decomposition (DMD) and water gas shift (WGS), may occur. Indeed, the design of an appropriate catalytic system is seen as one of the most important bottlenecks for the industrialization of the DRM process.10,11
Noble metals, such as Pt, Rh and Ru, generally show considerably higher DRM activity and selectivity than transition metals.5,6,12–14 Their high price and scarce availability has led however to a more widespread use of Ni-containing catalysts. In spite of their comparable activity, Ni-containing catalysts deactivate more quickly than noble metal-based ones, due to the simultaneous promotion of carbon-forming reactions such as DMD. They can be moreover notably affected by the sintering of the Ni-active sites taking place at moderate-high operation temperatures.15,16 Properly dispersing the Ni active phase on a suitable support can contribute to alleviating these main drawbacks for the utilisation of Ni-containing catalysts.17
Among the different supports considered, clay materials gather interesting textural and surface properties that can importantly contribute to adequate Ni-dispersion. Natural clays are moreover abundant, not expensive and their physicochemical properties can be relatively tailored in order to further improve their catalytic performance in DRM.18,19 Wang et al. reported important DRM activity for clay-supported Ni-catalysts, together with a relevant influence of the nature of the clay used, and, concretely, of its pore structure and surface properties.20 The presence of mesopores resulted in enhanced catalytic activity. Hao et al. employed zirconia-pillared LAPONITE® clays in the preparation of Ni-catalysts for DRM.21 Through pillaring, the modification of the pore structure and the surface properties resulted in enhanced Ni-dispersion and in minimized pore blockage, finally leading to improved activity and stability.
In addition to providing proper textural and surface properties, the use of promoters can highly contribute to boosting catalytic activity and/or avoiding catalyst deactivation. Li and co-workers recently showed that the use of magnesium enhanced the surface basicity of alumina-based catalysts and promoted the gasification of the carbon deposits formed through the undesired C-forming parallel reactions.22 Singha et al. reported improved catalytic activity and stability for MgO-promoted hydrothermally synthesized ZnO-supported Ni-nanoparticles.23 The authors related this enhanced catalytic performance to the better dispersion of the Ni-phase upon Mg-promotion. Dieuzeide et al. carefully described how the content of Mg affected the catalytic performance of Ni/Al2O3 catalysts.24 Both the improvement of Ni-dispersion and the increase of surface basicity were beneficial to catalytic activity and prevented carbon formation and deposition. In our previous works, the use of Ni-containing hydrotalcite-derived catalysts was assessed.25,26 The presence of Mg in the mixed oxide solution, obtained upon the calcination of the pristine hydrotalcite matrix, resulted in an accurate control of Ni crystallite size as well as in enhanced basic properties. The presence of low-strength and medium-strength basic sites led to favoured CO2 adsorption contributing to higher reaction rates. In two more recent papers, we showed that natural clays can be promising supports for the preparation of Ni-containing DRM catalysts.27,28 Still, the activity reported for these natural clay based catalysts was found to be relatively low in comparison to hydrotalcite-derived catalysts. Lower CO2 adsorption ability was measured for the natural clay based catalysts, i.e. 52.7 μmol CO2 per g for Ni–Zr/Cu-clay,28 vis-à-vis 104 μmol CO2 per g found for HT-25Ni.26
In the present work, Fe and Cu-pillared natural clays were promoted with Mg and further used in the preparation of Ni-containing catalysts for DRM. The influence of the presence of Mg and its content on different physicochemical properties such as porosity, basicity, Ni-reducibility and dispersion, as well as on the activity, selectivity and stability of the different natural clay based catalysts, has been carefully analysed. Mg-promotion of natural clays has not been considered to date. The use of Mg can provide additional basic sites for CO2 adsorption, resulting in an improved performance of natural clay based catalysts. Furthermore, the changes induced in Ni crystallite size can lead to important modifications in activity and selectivity due to promoted (or not) methane activation.
2. Experimental
2.1. Catalyst preparation
A raw natural clay from the deposit of Jebal Cherahil (Kairouan, Central-West of Tunisia) was purified and ion-exchanged as previously described elsewhere.29 The Fe-pillaring30 consisted basically in the preparation of a pillaring solution containing Na2CO3 (97%, MERCK) and Fe(NO3)3 (Fe(NO3)3·9H2O 97%, MERCK) that was aged for 4 days at 60 °C and subsequently stirred together with the purified, Na-exchanged clay (at 2 wt%) for 24 h. The suspension was finally filtered, carefully washed and dried at 300 °C for 24 h upon centrifugation. For the preparation of the Cu-modified clay, 1 g purified Na-exchanged clay was added to a 0.02 M solution of copper acetate (Cu(CH3COO)2 (98%) MERCK, 100 mL), at pH = 5.2. The suspension was stirred at 40 °C for 24 h, filtered, washed several times with deionized water, centrifuged and subsequently dried at 120 °C in an oven for 12 h. Both Fe and Cu-modified clays were calcined at 400 °C during 5 h.The Ni-catalysts were prepared using either the non-pillared, the Fe or the Cu-modified clays, at 15 wt% Ni nominal loading (Ni(NO3)2·6H2O). The different Mg-promoted catalysts were obtained through excess solution impregnation of each support, at 15 wt% Ni loading and at either 10, 20 or 30 wt% Mg loading (Mg(NO3)2·6H2O). All the suspensions were aged for 2 hours at room temperature, then dried at 40 °C in rotary evaporator. The resulting solid material was kept overnight at 110 °C, calcined in air at 550 °C for 5 h and finally grinded and sieved to a particle size of 100 μm. The main aim of the calcination treatment is the removal of remaining nitrate species upon clay impregnation with the Ni and Mg precursors. The calcination temperature was therefore chosen according to this fact.
2.2. Physicochemical characterization
Textural characterization was performed by means of N2 adsorption at −196 °C in a BelSorp-Mini II (BEL-Japan) device. The BET method was used for the calculation of the specific surface area, whereas the BJH method was chosen for the evaluation of mesopore volume. All the samples were submitted to previous degasification under He flow at 150 °C for 3 hours. The X-ray diffraction (XRD) patterns were acquired in a PANalytical-Empyrean diffractometer, equipped with CuKα (λ = 1.5406 Å) radiation source and 2θ range between 3 and 90°, with a step size of 0.02° s−1. The Ni crystallite sizes in the reduced catalysts were calculated using the Scherrer equation applied to the Ni0 51.6° diffraction peak. Raman spectroscopy was performed in a Horiba Jobin Yvon HR800 UV device using a green laser source (532 nm). The temperature-programmed reduction (H2-TPR) profiles were obtained using a BELCAT-M (BEL-Japan) apparatus, equipped with a thermal conductivity detector (TCD). The readily calcined materials, kept in sealed vessels in order to minimize their exposure to ambient air, were first outgassed and activated at 100 °C for 2 h, kept under inert Ar flow for 30 min and then reduced in 5 vol% H2/Ar heating up from 100 to 900 °C, at 7.5°C min−1 heating rate. Let us note here that TPR measurements were performed in the next 10–12 h following the calcination of the catalysts. The same apparatus (BELCAT-M) was also used for the acquisition of the temperature-programmed desorption (CO2-TPD) profiles. The reduced catalysts were degassed and activated from room temperature to 500 °C in pure He at a heating rate of 10 °C min−1, degased for 2 h and then cooled down to 80 °C. The materials were subsequently exposed to 10 vol% CO2/He for 1 h. The adsorbed CO2 was desorbed in pure He at temperatures from 80 °C to 900 °C and at a heating rate of 10 °C min−1.2.3. Dry reforming of methane (DRM) catalytic tests
The activity tests were performed at temperatures from 850 °C to 600 °C (at 50 °C intervals of 30 minutes), in a tubular quartz reactor (8 mm internal diameter) and at atmospheric pressure. The total reactant gas flow was 100 mL min−1, corresponding to a gas hourly space velocity (GHSV) of 20![[thin space (1/6-em)]](https://www.rsc.org/images/entities/char_2009.gif) 000 h−1. In order to guarantee the targeted GHSV, the mass of catalyst used in each experiment (around 150–250 mg) was adjusted taking into account the specific density of each material. The molar composition of the reactant gas was CH4/CO2/Ar = 1/1/8. The calcined catalysts were reduced in situ at 900 °C for 1 h in 5 vol% H2/Ar, prior to each DRM experiment. The composition of gas was continuously analysed with the help of a micro chromatograph (Varian GC4900), equipped with a thermal conductivity detector (TCD). The conversions of CO2 and CH4, as well as the molar ratio of H2 to CO, were calculated using the following equations, where nini and nouti represent the number of moles at, respectively, the inlet and outlet of the reactor for each of the species:
000 h−1. In order to guarantee the targeted GHSV, the mass of catalyst used in each experiment (around 150–250 mg) was adjusted taking into account the specific density of each material. The molar composition of the reactant gas was CH4/CO2/Ar = 1/1/8. The calcined catalysts were reduced in situ at 900 °C for 1 h in 5 vol% H2/Ar, prior to each DRM experiment. The composition of gas was continuously analysed with the help of a micro chromatograph (Varian GC4900), equipped with a thermal conductivity detector (TCD). The conversions of CO2 and CH4, as well as the molar ratio of H2 to CO, were calculated using the following equations, where nini and nouti represent the number of moles at, respectively, the inlet and outlet of the reactor for each of the species:
 | (1) |
 | (2) |
 | (3) |
3. Results and discussion
3.1. Physicochemical features of the Mg-promoted natural clay based catalysts
Table 1 contains the results of the textural characterization performed on the raw, Fe and Cu-modified clays, as well as on the different Ni and Ni–Mg catalysts. Ni and Ni–Mg loading result all the time in a certain extent of pore blockage, which depends on the clay used as support, as well as on the amount of Mg deposited. Since the introduction of Cu-pillars in the natural clay leads to a considerable increase in surface area and pore volume, upon Ni and Ni–Mg loading con the Cu-clay the surface area of the Cu-clay based catalysts decreases, but to a lower extent than for the catalysts prepared using either the raw clay or the Fe-modified clay as support. In all cases, pore blockage seems to affect mainly the micropore and narrow mesopore fraction of the porosity of the clays. Medium-size mesopores and wide mesopores are still present in the Mg-promoted catalysts.| Catalyst | SBET [m2 g−1] | Vpa [cm3 g−1] | dpb [nm] | VBJHc [cm3 g−1] | Ni0 crystal size [nm] |
|---|---|---|---|---|---|
| a Total pore volume.b Average pore size.c BJH desorption cumulative pore volume. | |||||
| Raw-clay | 73.6 | 0.148 | 8.1 | 0.146 | — |
| Ni/raw-clay | 55.4 | 0.112 | 8.9 | 0.111 | 14.7 |
| Ni–10Mg/raw-clay | 16.9 | 0.139 | 32.9 | 0.136 | 8.1 |
| Fe-clay | 60.9 | 0.111 | 6.6 | 0.112 | — |
| Ni/Fe-clay | 44.2 | 0.109 | 8.6 | 0.108 | 15.1 |
| Ni–10Mg/Fe-clay | 16.7 | 0.073 | 17.3 | 0.068 | 8.4 |
| Ni–20Mg/Fe-clay | 12.0 | 0.059 | 19.6 | 0.057 | 8.3 |
| Ni–30Mg/Fe-clay | 12.2 | 0.111 | 36.4 | 0.110 | 7.5 |
| Cu-clay | 102.8 | 0.195 | 7.7 | 0.108 | — |
| Ni/Cu-clay | 84.3 | 0.159 | 8.2 | 0.156 | 14.1 |
| Ni–10Mg/Cu-clay | 31.8 | 0.107 | 13.5 | 0.100 | 8.1 |
H2-TPR profiles are shown in Fig. 1. Fig. 1a and b respectively compare the H2-TPR profiles obtained for the different Ni–Mg catalysts prepared using 10 wt% Mg and as a function of Mg content. For the sake of comparison, the H2-TPR profiles corresponding to the non-promoted Ni-containing clay are also plotted (Fig. 1a, dotted lines).
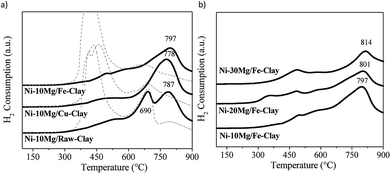 | ||
| Fig. 1 H2-TPR profiles for (a) the Ni–Mg (10 wt%) catalysts (dotted lines correspond to the TPR profiles of the non-promoted clay-based catalysts27), (b) the Ni–Mg catalysts prepared at 10, 20 and 30 wt% Mg-loading. | ||
All of them present two main areas of interest in which several H2-consumption peaks can be observed: a first series of peaks appearing at temperatures between 350 and 530 °C, followed by marked H2-consumption occurring at higher temperatures from 680 to 820 °C. In this sense, the three H2-TPR profiles acquired for the non-promoted Ni-catalysts substantially differ to that obtained for the Mg-promoted catalysts. In the later, H2-consumption takes place during a wider temperature window, and peaks up a relatively high temperatures, i.e. around 600–700 °C (Fig. 1a and b), whereas the non-promoted catalysts (Fig. 1a, dotted lines) present a main and almost single peak of H2-consumption appearing within the low temperature window (420–450 °C), followed by a softer and wider peak at higher reduction temperatures.
Essentially, the H2-TPR profiles typical of Ni-containing catalysts generally show two main H2-consumption peaks. The first one, occurring at lower-intermediate temperatures, is associated to bulk NiOx species. The second one, appearing at higher temperatures, is linked to the reduction of finely dispersed NiOx and/or Ni-species in tight interaction with the support.26 The H2-TPR profiles for natural clay-based catalyst can be quite complex, moreover after Fe and Cu pillaring. The reduction of Fe3O4 to Fe2O3 occurs at about 450–600 °C and may overlap with the H2-consumption peaks resulting from the reduction of bulk NiOx species. Similarly, Cu oxides will be reduced within the same temperature window.31–34
Nevertheless, the high-temperature H2-consumption peak can be clearly distinguished in all the TPR profiles acquired for the Mg-promoted catalysts. This peak can be most probably related the reduction of Ni-species in tight interaction with Mg oxides, as has been previously observed in Ni-containing hydrotalcite-derived catalysts.25,26 In fact, for the non-promoted Ni-catalysts, the intensity of the high temperature peak increases with the Mg-content in the clay used as support, i.e. it is more intense in the case of the catalyst prepared using the raw-clay (containing 5.5 wt% Mg) than for the ones supported on the Fe and Cu-clays (containing 1.1 and 1.3 wt% Mg, respectively).27 For the Mg-promoted catalysts this high temperature H2-consumption peak is further shifted to higher reduction temperatures as Mg-loading increases from 10 to 20 and to 30% (Fig. 1b). The profile acquired for the Ni–10Mg/raw-clay catalyst presents indeed two clearly separated peaks appearing in the high temperature window: the first one centred at 690 °C, probably related to Ni in tight interaction with the Mg-species in the pristine structure of the raw clay, and the second one, centred at 787 °C, corresponding to the reduction of Ni species forming a mixed oxide structure with the Mg-species that was added as promoter. The presence and/or addition of Mg therefore result in the formation of mixed Ni–Mg oxide species, clearly affecting their reducibility. The presence of Fe and Cu can further modify the interaction of Ni-species with the different oxide species, both promoters and clay matrix. It has been previously reported that the presence of Fe and Cu species (pillars) considerably affected the reducibility of the Ni-species.27 Indeed, upon calcination, Ni and Fe can form mixed NiFe2O4 spinel phases that are however not clearly evidenced in the H2-TPR profiles for this series of catalysts. Additionally, the H2-TPR profiles point that the catalysts must be pre-treated in H2 at temperatures higher than 850 °C, since the Ni-species contain are only reduced at high temperature. A reduction temperature of 900 °C was therefore chosen.
The XRD patterns obtained for the reduced Mg-promoted catalysts are shown in Fig. 2. Very similar reflections are observed in all catalysts, including metallic nickel (at 44.5°, 51.6°, 76.3°), MgNiO2 and quartz. The presence of MgNiO2 confirms the strong interaction between Mg and Ni species, resulting in a mixed oxide phase, as pointed out during the discussion on the H2-TPR profiles obtained. Note here that a pure MgO periclase phase yields normally diffraction peaks appearing always at lower diffraction angles than MgNiO2, i.e. the (200) diffraction peak should appear at 42.97° for MgO whereas for MgNiO2 it appears at 43.1°. However, it is always difficult to distinguish between MgO and MgNiO2 in XRD patterns. In the case of the Ni–10Mg/Fe-clay catalyst, this (200) pseudo-periclase peak appears centred at even higher diffraction angles, i.e. 43.2°.
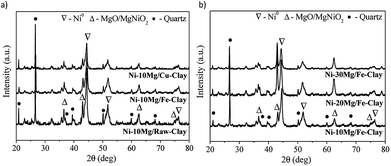 | ||
| Fig. 2 XRD patterns for (a) the Ni–Mg (10 wt%) catalysts, and (b) the Ni–Mg catalysts prepared at 10, 20 and 30 wt% Mg-loading, upon reduction at 900 °C. | ||
The crystallite sizes of metallic nickel, calculated using the Scherrer equation (51.6°), are listed in Table 1. Ni0 crystallite sizes are always smaller for the Mg promoted catalysts. Similar results have been previously reported by Dieuzeide et al.,24 who observed better dispersion of Ni at lower Mg content due to inhibited diffusion during reduction, as a consequence of the formation of a mixed Ni–Mg oxide phase. The formation of a mixed Ni–Fe phase, such as NiFe2O4, is not evident from the diffraction patterns, but has been previously described in the literature.35 Similarly, there are no evidences of the formation of Ni–Cu mixed phases.33 Note here that Ni cluster sizes estimated using the Scherrer equation might yield quite inaccurate results when trying to evaluate the crystalline state and size of an active phase. As it will be discussed later, and at the sight of the TEM images acquired for this series of catalysts upon DRM reaction, the size of the Ni clusters appears quite inhomogeneous. Indeed, Ni crystallites of few nanometers size co-exist together with much bigger clusters that are formed upon the reduction of bulk NiOx in weak interaction with either the promoter or the clay's matrix.
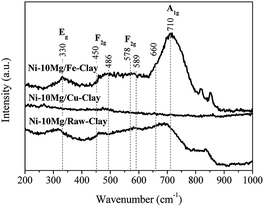
The Raman spectra acquired for reduced Ni–Mg catalysts are shown in Fig. 3. The Raman modes typical of an inverse spinel structure, at ca. 710 (s), 660 (sh, m), 589–578 (large, m), 486 (m), 450 (sh, w) and 330 (w) cm−1, are clearly visible in the spectrum registered for the catalyst Ni–10Mg/Fe-clay, and point to the presence of NiFe2O4 in this material.35–37 They can be barely distinguished in the Raman spectrum of Ni–10Mg/raw-clay and they are not visible at all for the Ni–10Mg/Cu-clay. A part of the iron introduced in the Fe-clay support is thus able to form this NiFe2O4 phase. The iron-species naturally present in the raw-clay may as well form this kind of spinel, but to a lower extent. However, the formation of NiFe2O4 does not seem to clearly affect the final Ni0 size. No remarkable peak shift was moreover observed in any of the Ni0 reflections present in the XRD patterns.
The CO2-TPD profiles for the Mg-promoted catalysts upon their reduction at 900 °C are shown in Fig. 4. These profiles are generally composed by wide CO2-desorption peaks that can be deconvoluted into three main types of contributions: low temperature CO2-desorption (100–250 °C), associated to weak Brønsted basic sites such as surface –OH groups, intermediate temperature CO2-desorption (250–400 °C), corresponding to medium-strength Lewis base sites, and high temperature CO2-desorption (400–600 °C), linked to adsorption on low-coordination oxygen anions acting as strong basic sites.23,25
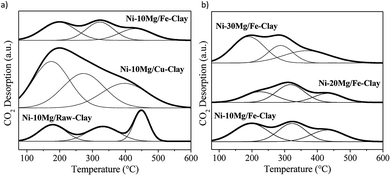 | ||
| Fig. 4 CO2-TPD profiles for (a) the Ni–Mg (10 wt%) catalysts, and (b) the Ni–Mg catalysts prepared at 10, 20 and 30 wt% Mg-loading, upon reduction at 900 °C. | ||
The results of the deconvolution of the CO2-TPD profiles, as well as the total basicity, can be found in Table 2. Mg-promotion results in increased total basicity, i.e. higher amounts of CO2 were adsorbed and desorbed during CO2-TPD vis-à-vis the non-promoted catalysts.
| Catalyst | Deconvolution [μmol CO2 per g] | Total basicity [μmol CO2 per g] | ||
|---|---|---|---|---|
| Weak | Medium | Strong | ||
| Ni/raw-clay | 9.9 | 7.7 | 6.0 | 23.6 |
| Ni–10Mg/raw-clay | 10.2 | 10.4 | 11.4 | 32.0 |
| Ni/Fe-clay | 4.8 | 19.6 | 6.0 | 30.4 |
| Ni–10Mg/Fe-clay | 15.5 | 11.1 | 10.4 | 37.0 |
| Ni–20Mg/Fe-clay | 9.7 | 13.9 | 8.6 | 32.2 |
| Ni–30Mg/Fe-clay | 22.9 | 11.5 | 14.9 | 49.3 |
| Ni/Cu-clay | 0.5 | 2.2 | 1.4 | 4.1 |
| Ni–10Mg/Cu-clay | 35.7 | 25.7 | 37.7 | 99.1 |
The increase in CO2-adsorption ability becomes particularly evident in the case of the Ni–10Mg/Cu-clay catalyst, i.e. 99.1 μmol CO2 per g upon Mg-loading vis-à-vis 4.1 μmol CO2 per g measured for the non-promoted catalyst. This Cu-clay supported Mg-promoted catalyst, which shows the highest participation of strong basic sites, i.e. almost 40% of the total basicity, whereas strong basic sites represent only 28% of the total basic sites in Ni–10Mg/Fe-clay. Such a favoured presence of such strong basic sites may result in far too tight adsorption of CO2 and thus to its limited reaction with CH4.25
The amount of CO2 adsorbed increases with increasing Mg-loading, and especially for the Ni–30Mg/Fe-clay catalyst. However, in the Fe-clay supported catalysts, the relative amount of strong basic sites remains relatively moderate, while the concentration of low (Brønsted) and medium-strength basic sites increases. Nevertheless, Ni-cluster size also plays an important role in the final catalytic activity of these materials,38,39 as will be discussed in the following section.
3.2. Catalytic activity and selectivity in DRM
The results of the DRM catalytic tests performed in the presence of the different materials are shown in Fig. 5 and 6. Let us note here that the conversion values plotted in these figures correspond to the steady-state values measured after 30 minutes time-on-stream. Fig. 5a–c shows the results obtained in the presence of the Ni–Mg (10 wt%) catalysts in terms of both methane and CO2 conversions, and H2/CO ratio (syngas quality). Both methane and CO2 conversions increase with increasing temperature, following the trend forecasted by the equilibrium thermodynamics of the CH4/CO2/Ar system at 1 bar. The measured H2/CO ratios also increase with increasing temperature, opposite to the thermodynamically predicted trend. However, both the experimentally determined and the theoretical H2/CO ratios converge to values close to 1 at the highest reaction temperatures, i.e. 750–850 °C.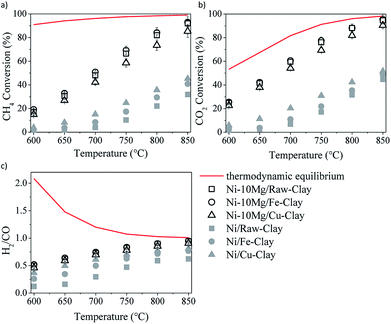 | ||
| Fig. 5 DRM activity tests in the presence of the Ni–Mg (10 wt%) catalysts: methane (a) and CO2 (b) conversions, and H2/CO ratio (c). | ||
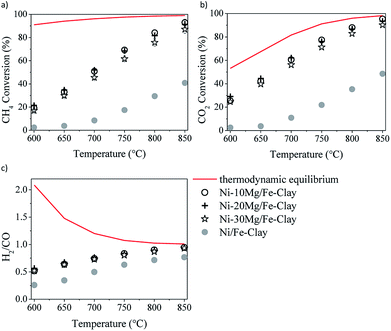 | ||
| Fig. 6 DRM activity tests in the presence of the Fe-clay supported catalysts, containing 10, 20 and 30 wt%: methane (a) and CO2 (b) conversions, and H2/CO ratio (c). | ||
The low H2/CO ratios measured within the low temperature window are indeed a consequence of CO2 conversions being all the time higher than those of methane. In the low-mild temperature window, methane can be as well consumed through its direct decomposition, resulting in H2 and C(s). The solid carbon product, C(s), remains on the catalytic surface, covering its active sites, sometimes leading to an important loss of catalytic activity. The resulting H2 can further react with the CO2 in the feed gas through the reverse water gas shift (RWGS) reaction, yielding CO and H2O. If the RWGS reaction occurs to an important extent, both enhanced consumption of H2 and CO formation result in lower H2/CO ratios than the ones predicted by the equilibrium thermodynamics. The DRM reaction is indeed just one of the multiple reactions taking place, being thermodynamically feasible at temperatures higher than 700 °C. At mild temperatures, carbon-forming reactions, such as direct methane decomposition (DMD) and Boudouard reaction (2CO = CO2 + C) are favored, together with methanation and CO2 reduction reactions leading to alcohol and hydrocarbon formation.
Though thermodynamically favored, these reactions are as well kinetically hindered. In the presence of a Ni-containing catalyst, DMD may be preferentially catalyzed, among the other carbon forming or hydrogenation reactions. At moderate temperatures RWGS starts taking the lead, until it simultaneously coexist with DRM, which ends up being dominant at temperatures higher than 750–800 °C.
Fig. 6 shows the results of the DRM experiments performed in the presence of the catalysts prepared using 10, 20 and 30 wt% Mg. The three catalysts show very similar activity, with similar methane and CO2 conversions, as well as H2/CO ratios.
In any case, and in spite of the lower surface areas reported for the Mg-promoted catalysts (Table 1), a considerable increase in methane and CO2 conversions can be observed upon Mg-loading, this being quite independent of the clay used as support (Fig. 5a and b). Comparing the results obtained with these Mg-promoted clay-supported catalysts with other catalysts tested under the same reaction conditions, i.e. hydrotalcite-derived catalysts,25,26 we must remark here that the CO2 and methane conversions, as well as the H2/CO ratios, obtained in the presence of the natural clay-based materials are similar, sometimes even higher, than those obtained using the synthetic clays (layered double hydroxydes).
It is clear from the results of the physico-chemical characterization that, in general, Mg-promotion results in highest surface basicity (see Table 2). The presence of basic sites may enhance CO2 adsorption, which can result, in turn, in improved DRM activity. As commented before, the favoured presence of strong basic sites may result in far too tight adsorption of CO2, disabling it for further reaction with CO2, CH4, H2 and/or other species.33 Indeed, Ni–10Mg/Cu-clay exhibits the lowest activity of this series while presenting the highest population of strong basic groups.
These differences in basicity do not explain themselves the important increase of the catalytic activity observed upon Mg-promotion. Ligthart et al.38 proved that, in steam methane reforming, the dispersion of the active metal can be directly related to the type of support used, and further stated that increased metallic dispersion results in increased density of low-coordinated edge and corner metal atoms that favoured methane dissociative adsorption (rate-determining step). Though in DRM CO2 adsorption plays a very important role, methane activation on the catalytically active sites remains crucial for further reaction leading to H2 and/or CO formation. Wei and Iglesia39 performed isotopic experiments in order to elucidate the mechanism of methane reforming both with steam and CO2. They found that reforming reactions and direct methane decomposition (DMD) follow a common path that is limited by the activation of the C–H bond in CH4. They showed moreover that the CH4 turnover rates increase with metal dispersion, for Ni-catalysts but also for noble metal containing catalysts. These turnover rates were apparently independent of the type of support used; i.e. only depended on the metallic dispersion. The authors concluded that coreactant activation, such as favoured CO2 adsorption, may be kinetically irrelevant in reforming reactions and cannot influence the overall reaction rate.
These observations seem to be in agreement with the results obtained in these study. Much higher methane and CO2 conversions were measured in the presence of the Mg-promoted catalysts. The presence of Mg results in increased basicity. However, only Ni0 crystallite size explains enhanced methane activation. Mg-loading leads to the formation of a mixed phase NiMgO2 that, upon reduction, results in considerably lower Ni0 crystallite sizes than in the case of the non-promoted catalysts. Methane activation on such smaller metal clusters leads to its effective participation in all the reactions involved, thus leading to higher methane and CO2 conversions.
Fig. 7 contains the TEM micrographs obtained for the Ni–Mg (10% wt%) catalysts upon the DRM experiments, together with their corresponding histograms. Bulk graphitic carbon formations are observed together with carbon filaments (nanofibres) of very different sizes. Very frequently, these carbon structures appear close to big Ni-agglomerates, pointing to a certain sintering of the metallic phase. However, an important amount of well-dispersed Ni0 particles is evidenced in any of the TEM images acquired for the Mg-promoted catalysts. The histograms point indeed to mean particle sizes around 7 nm for the Fe and Cu pillared clays supported catalysts, and around 9 nm for the catalyst prepared using the raw clay. They point also to the presence of Ni0 particles of bigger size, between 10 and 17 nm that may be generated upon the reduction of bulk NiOx, as well as big Ni agglomerates (appearing close to C(s) formation) due to the sintering of the metallic phase, as already commented. Let us not here as that no clear evidences of a different behaviour in terms of sintering or Ni cluster size have been observed through the TEM analysis of the Fe-clay based catalysts, although Raman studies pointed to the presence of an spinel NiFe2O4 phase in this catalyst.
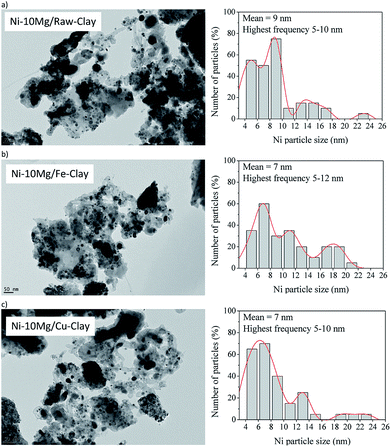 | ||
| Fig. 7 TEM micrographs (×25,000) and particle histograms for the spent catalysts (upon DRM experiment): (a) Ni–10Mg/raw-clay, (b) Ni–10Mg/Fe-clay and (c) Ni–10Mg/Cu-clay. | ||
Table 3 contains the amount of carbon deposited, calculated from the carbon balance C(s) = C in reactants – C in products, for this series of catalysts. Mg-promotion results higher extent of carbon formation and deposition, vis-à-vis the non-promoted catalysts. This can be directly linked to their higher activity, especially in terms of methane activation and conversion, pointing to direct methane decomposition (DMD) occurring to a certain extent. Among the Mg-promoted catalysts, the ones prepared using the Fe-clay seem to lead to increased carbon formation, in agreement with their enhanced activity. Similarly, the catalyst prepared using 30 wt% Mg yields relatively lower amounts of solid carbon, corresponding also to its lower activity vis-à-vis the rest of the catalysts in the series. Once again, activity seems to be directly linked to the activation of the C–H bond in methane, which leads also to its direct decomposition, resulting in solid carbon formation. Nevertheless, isothermal runs performed at 700 °C evidenced no sign of activity loss over 20 hours of time-on-stream, for any of the Mg-promoted clay-based catalysts. Indeed, both CO2 and methane conversion slightly increased after the first hours of reaction to then stabilize, reaching values slightly higher than the conversions showed in Fig. 5 and 6.
| Catalyst | Deposited carbon [mg C] |
|---|---|
| Ni/raw-clay | 82 |
| Ni–10Mg/raw-clay | 327 |
| Ni/Fe-clay | 109 |
| Ni–10Mg/Fe-clay | 396 |
| Ni–20Mg/Fe-clay | 409 |
| Ni–30Mg/Fe-clay | 346 |
| Ni/Cu-clay | 120 |
| Ni–10Mg/Cu-clay | 329 |
4. Conclusions
Mg-promoted, Ni-containing catalysts were prepared using a Tunisian natural clay as support, modified through the introduction of either Fe or Cu pillars. Mg-promotion resulted in the formation of a MgNiO2 mixed oxide phase that, upon reduction, led to the formation of Ni metallic clusters around 7–9 nm, considerably smaller than in the non-promoted catalysts. Though Raman observation pointed to the possible formation of an spinel NiFe2O4, particularly in the case of the Fe-clay supported catalysts, the presence of this mixed Ni–Fe phase did not seem to influence the final Ni0 crystallite size in the reduced materials. Total basicity, i.e. amount of basic sites able to adsorb CO2, substantially increased upon Mg-loading.The catalytic activity in DRM was considerably boosted when using Mg as promoter. Methane and CO2 conversions increased by a factor of two, when DRM was performed in the presence of the Mg-loaded catalysts. H2/CO ratios also increased with respect to the non-promoted catalysts, approaching values close to 1 at almost any reaction temperature. The overall activity seemed to be governed by the Ni0 crystallite size. The enhanced dispersion gained through Mg-promotion lead to a faster activation of the C–H bond resulting in increased activity. TEM observation of the catalysts upon the DRM experiments evidenced a relatively wide particle size distribution, but confirmed the mean metallic cluster sizes determined from the XRD patterns. Bulk graphitic carbon structures covering sintered Ni-clusters, as well as carbon nanofibres of different sizes were observed. The extent of carbon formation was found to be higher for the Mg-promoted catalysts, corresponding to the improved C–H bond activation. However, the catalytic stability was verified over 20 h duration isothermal DRM experiments performed at 700 °C.
Conflicts of interest
There are no conflicts to declare.Acknowledgements
H. Liu thanks China Scholarship Council for his PhD fellowship at Sorbonne Université.Notes and references
- F. D. Meylan, V. Moreau and S. Erkman, J. CO2 Util., 2015, 12, 101–108 CrossRef.
- R. Benrabaa, A. Löfberg, J. Guerrero Caballero, E. Bordes-Richard, A. Rubbens, R.-N. Vannier, H. Boukhlouf and A. Barama, Catal. Commun., 2015, 58, 127–131 CrossRef.
- S. A. Theofanidis, R. Batchu, V. V. Galvita, H. Poelman and G. B. Marin, Appl. Catal., B, 2016, 185, 42–55 CrossRef.
- B. A. Rosen, E. Gileadi and N. Eliaz, Catal. Commun., 2016, 76, 23–28 CrossRef.
- A. Yamaguchi and E. Iglesia, J. Catal., 2010, 274, 52–63 CrossRef.
- J. Wei and E. Iglesia, J. Catal., 2004, 225, 116–127 CrossRef.
- P. Tang, Q. Zhu, Z. Wu and D. Ma, Methane activation: the past and future, Energy Environ. Sci., 2014, 7, 2580 Search PubMed.
- F. J. Keil, Nat. Chem., 2013, 5, 91–92 CrossRef PubMed.
- R. A. Periana, O. Mironov, D. Taube, G. Bhalla and C. J. Jones, Science, 2003, 301, 814–818 CrossRef PubMed.
- D. Pakhare and J. Spivey, Chem. Soc. Rev., 2014, 43, 7813–7837 RSC.
- A. A. Olajire, J. CO2 Util., 2013, 3–4, 74–92 CrossRef.
- Y. Khani, Z. Shariatinia and F. Bahadoran, Chem. Eng. J., 2016, 299, 353–366 CrossRef.
- C. Carrara, J. Munera, E. A. Lombardo and L. M. Cornaglia, Top. Catal., 2008, 51, 98–106 CrossRef.
- F. Polo-Garzon, J. K. Scott and D. A. Bruce, J. Catal., 2016, 340, 196–204 CrossRef.
- L. Foppa, M.-C. Silaghi, K. Larmier and A. Comas-Vives, J. Catal., 2016, 343, 196–207 CrossRef.
- J. Niu, X. Du, J. Ran and R. Wang, Appl. Surf. Sci., 2016, 376, 79–90 CrossRef.
- M. E. Gálvez, A. Albarazi and P. Da Costa, Appl. Catal., A, 2014, 504, 143–150 CrossRef.
- A. Vaccari, Appl. Clay Sci., 1999, 14, 161–198 CrossRef.
- O. Gamba, S. Moreno and R. Molina, Int. J. Hydrogen Energy, 2011, 36, 1540–1550 CrossRef.
- S. B. Wang, H. Y. Zhu and G. Q. Lu, J. Colloid Interface Sci., 1998, 204, 128–134 CrossRef PubMed.
- Z. Hao, H. Y. Zhu and G. Q. Lu, Appl. Catal., A, 2003, 242, 275–286 CrossRef.
- D. Li, R. Li, M. Lu, X. Lin, Y. Zhan and L. Jiang, Appl. Catal., B, 2017, 200, 566–577 CrossRef.
- R. K. Singha, A. Yadav, A. Agrawal, A. Shukla, S. Adak, T. Sasaki and R. Bal, Appl. Catal., B, 2016, 191, 165–178 CrossRef.
- M. L. Dieuzeide, M. Laborde, N. Amadeo, C. Cannilla, G. Bonura and F. Frusteri, Int. J. Hydrogen Energy, 2016, 41, 157–166 CrossRef.
- R. Dębek, M. E. Gálvez, F. Launay, M. Motak, T. Grzybek and P. Da Costa, Int. J. Hydrogen Energy, 2016, 41, 11616–11623 CrossRef.
- R. Dębek, M. Motak, D. Duraczyska, F. Launay, M. E. Gálvez, T. Grzybek and P. Da Costa, Catal. Sci. Technol., 2016, 6, 6705–6715 Search PubMed.
- H. Liu, L. Yao, H. Bel Hadj Taief, M. Benzina, P. Da Costa and M. E. Gálvez, Catal. Today, 2018, 306, 51–57 CrossRef.
- H. Liu, P. Da Costa, H. Bel Hadj Taief, M. Benzina and M. E. Gálvez, Int. J. Hydrogen Energy, 2017, 42, 23508–23516 CrossRef.
- H. Bel Hadjltaief, P. Da Costa, P. Beaunier, M. E. Gálvez and M. Ben Zina, Appl. Clay Sci., 2014, 91–92, 46–54 CrossRef.
- H. B. Hadjltaief, M. B. Zina, M. E. Gálvez and P. Da Costa, C. R. Chim., 2015, 18, 1161–1169 CrossRef.
- A. Djaidja, H. Messaoudi, D. Kaddeche and A. Barama, Int. J. Hydrogen Energy, 2015, 40, 4989–4995 CrossRef.
- J. Ashok and S. Kawi, ACS Catal., 2014, 4, 289–301 CrossRef.
- K. Sutthiumporn, T. Maneerung, Y. Kathiraser and S. Kawi, Int. J. Hydrogen Energy, 2012, 37, 11195–11207 CrossRef.
- L. Djeffal, S. Abderrahmane, M. Benzina, M. Fourmentin, S. Siffert and S. Fourmentin, Environ. Sci. Pollut. Res., 2014, 21, 3331–3338 CrossRef PubMed.
- S. Abelló, E. Bolshak and D. Montané, Appl. Catal., A, 2013, 450, 261–274 CrossRef.
- E. Bolshak, S. Abelló and D. Montané, Int. J. Hydrogen Energy, 2013, 38, 5594–5604 CrossRef.
- B. Benrabaa, A. Löfberg, A. Rubbens, E. Bordes-Richard, R. N. Vannier and A. Barama, Catal. Today, 2013, 203, 188–195 CrossRef.
- D. A. J. M. Ligthart, R. A. van Santen and E. J. M. Hensen, J. Catal., 2011, 280, 206–220 CrossRef.
- J. Wei and E. Iglesia, J. Catal., 2004, 224, 370–383 CrossRef.
| This journal is © The Royal Society of Chemistry 2018 |

