 Open Access Article
Investigation of the size effect of graphene nano-platelets (GnPs) on the anti-corrosion performance of polyurethane/GnP composites
Jun Geun Um,
Yun-Seok Jun,
Hesham Alhumade,
Hariharan Krithivasan,
Gregory Lui and
Aiping Yu *
*
Department of Chemical Engineering, University of Waterloo, 200 University Avenue West, Waterloo, Ontario, Canada N2L 3G1. E-mail: aipingyu@uwaterloo.ca
First published on 9th May 2018
Abstract
In this article, polyurethane/graphene nano-platelet (PU/GnP) composites were fabricated via planetary centrifugal mixer (PCM) and cast on polyethylene terephthalate (PET) and copper substrates. Four different grades of GnP are used to investigate the effect of GnP size on the anti-corrosion performance of the composites. Tafel, Nyquist, and Bode plots are used to quantify and compare the anti-corrosion performance of the composites, and these plots are obtained by electrochemical analysis. In addition to the anti-corrosion performance, mechanical properties and morphologies of the composites are analyzed. Various parameters indicating the anti-corrosion performance illustrate that smaller size of GnP in the composites shows higher anti-corrosion performance on copper substrate. The results show that the smaller size of GnP is not only uniformly dispersed within PU, but also offers a high surface area which helps construct an efficient filler pathway that suppresses the diffusion of a corrosive agent into the polymer matrix. Nevertheless, mechanical properties of the composites are partially improved. Essentially, this study demonstrates that the size of GnP plays a central role in determining the anti-corrosion performance of PU/GnP composites.
1. Introduction
Corrosion, commonly known as rusting, is defined as a chemical or electrochemical reaction between a metal substrate and a corrosive agent such as oxygen or moisture.1–6 Corrosion mitigation is critical in modern industry owing to the high cost of maintenance and replacement of parts.7–10 Organic coatings are the most common method for protecting metal surfaces from a corrosive environment.11–13 Among diverse organic materials, polymer coatings are widely used as a protective layer to prevent corrosion because they provide not only high anti-corrosion performance but also excellent adhesion to metal substrates.14–17 For instance, polyurethane (PU) and epoxy are commonly used coating materials as the protective layer on metal substrates.16–22 PU has especially attracted many researchers because of its exceptional mechanical property as well as an excellent adhesion to the metal.23–25 PU is based on the reaction between the isocyanate (–NCO) group and a polyol including hydroxyl groups (–OH), where the isocyanate group and polyol comprise a hard segment and soft segment respectively.26 Due to the segmented structure, PU has high strength and elongation. For this reason, PU has been applied to various fields and industries such as construction, oil and gas industry, automotive, and health care owing to its broad versatility. However, PU has inferior abrasion resistance and gas permeability relative to metal, both of which are necessary for use in harsh conditions such as the transportation of oil sands.23,24,26,27 To overcome this problem, numerous researchers have studied a polymer composite incorporating various nano-fillers, such as a layered silicate, carbon nanotubes (CNT), graphene, and graphene nano-platelets (GnP) to improve such properties.28–30 Among them, nanocomposites integrated with graphene and GnP are recently emerging as a new breakthrough.30–32Graphene is a two-dimensional one atomic layer platelet structure that consists of sp2-bonded carbon atoms.33 Many researchers have focused on nano-carbon materials since the advent of graphene due to its outstanding mechanical (elastic modulus: 1 TPa),34 thermal (thermal conductivity: 5000 W (m K)−1) and electrical (electrical conductivity: 6000 S cm−1) properties.35,36 Specifically, a number of researchers have incorporated graphene into polymer composites for improved barrier properties due to its excellent impermeability.32,37 However, several challenges such as the uniformity of graphene dispersion and its high manufacturing cost, prevent the widespread use of graphene for the polymer composite.38 For this reason, graphene nano-platelet (GnP) have gained great interest as the next ideal filler for the polymer composite.38–42
GnP consists of 10 to 60 graphene layers and can be produced in a relatively easier and more economical way than single layer graphene.38,39 Furthermore, a higher degree of dispersion of GnP within the composite can be achieved in comparison to graphene.43 This advantage of GnP holds promise to minimize gas permeability which is directly related to the improvement of anti-corrosion performance.44,45 and the tensile modulus of the composites. For instance, Pinto et al.46 reported that poly(lactic acid) (PLA) composites incorporated with GnP and graphene oxide (GO) reduced gas permeability by 65% and 60%, respectively, with a loading of 0.6 wt%. King et al.41 This revealed that the tensile modulus of epoxy/GnP composites gradually increased with GnP contents up to 6 wt%. Although GnP has a large attraction as previously mentioned, it has not been studied sufficiently in the research field of a polymer/GnP composite at this point in time. Therefore, further study of GnP is needed to improve an inherent, inferior polymer property such as gas permeability and this study is expected to contribute more practical polymer composite including GnP based on relatively easier commercialization of GnP than the single graphene.42
In this study, commercialized PU and GnP were used to fabricate PU/GnP composites. The prepared composites were coated on a copper (Cu) substrate as a protective layer against a corrosive media. In addition, four grades of GnP with different sizes were compounded with PU via the planetary centrifugal mixer (PCM). The composites were analyzed regarding various properties including mechanical and electrochemical properties. Herein, this study specifically focused on the corrosion behavior of the PU/GnP composites on the Cu substrate in a fixed content of GnP (1 wt%) and investigated the size effect of GnP on the corrosion resistance in a corrosive media. The existence of GnP improved the anti-corrosion performance of the PU/GnP composites and the smaller size of GnP led to the improvement of the performance of the composites. However, mechanical properties of the composites were partially improved, and this result was related to the interfacial property between GnP and polymer matrix. Furthermore, an appropriate model to correspond with the results of this study was proposed.
2. Experimental
2.1 Materials
RenCast 6401, commercialized highly flexible and abrasion resistant PU purchased from Huntsman (US), was used as a matrix material for the PU/GnP composites. RenCast 6401 is composed of the resin (6401-1, viscosity: 50 cP) including 4,4′-methylene diphenyl diisocyanate (MDI) with triethyl phosphate and the hardener (6401-2, viscosity: 1300 cP) including oxyalkylene polymer with 1,4 butanediol as a chain extender. The mixing ratio of resin and hardener was 25![[thin space (1/6-em)]](https://www.rsc.org/images/entities/char_2009.gif) :
:![[thin space (1/6-em)]](https://www.rsc.org/images/entities/char_2009.gif) 100 by mass. The four grades of GnP from XG science (US), which are also commercialized, were used as the filler for this study. The grades of GnP used were xGnP H100, M25, M5, and C750, and were distinguished by the average diameter corresponding with a size and surface area of GnP. According to the technical report from XG science, H100 grade has an approximate diameter of 150 μm and a typical surface area of 50 to 80 m2 g−1. The average diameters of M25 and M5 are 25 and 5 μm, respectively, with typical surface areas of approximately 120 m2 g−1 and 150 m2 g−1, respectively. C750 has the smallest diameter under 2 μm with the average surface area of approximately 750 m2 g−1. The density of all grades is 2.2 g cm−3. The basic physical properties of the commercialized GnP are summarized in Table 1.
100 by mass. The four grades of GnP from XG science (US), which are also commercialized, were used as the filler for this study. The grades of GnP used were xGnP H100, M25, M5, and C750, and were distinguished by the average diameter corresponding with a size and surface area of GnP. According to the technical report from XG science, H100 grade has an approximate diameter of 150 μm and a typical surface area of 50 to 80 m2 g−1. The average diameters of M25 and M5 are 25 and 5 μm, respectively, with typical surface areas of approximately 120 m2 g−1 and 150 m2 g−1, respectively. C750 has the smallest diameter under 2 μm with the average surface area of approximately 750 m2 g−1. The density of all grades is 2.2 g cm−3. The basic physical properties of the commercialized GnP are summarized in Table 1.
| Grade | Diameter (μm) | Surface area (m2 g−1) | Density (g cm−3) |
|---|---|---|---|
| xGNP H100 | 150 | 50–80 | 2.2 |
| xGNP M25 | 25 | ∼120 | 2.2 |
| xGNP M5 | 5 | ∼150 | 2.2 |
| xGNP C750 | <2 | ∼750 | 2.2 |
2.2 Preparation of the samples
The four different grades of GnP (Grade H100, M25, M5, and C750) were dried in a vacuum oven at 80 °C for 16 hours to remove moisture and then were dispersed in the hardener at 1 wt% mass loading [50 mg] using PCM (YS-2E, China) for 40 minutes. The resin was added to the mixture of the hardener and GnP with a resin![[thin space (1/6-em)]](https://www.rsc.org/images/entities/char_2009.gif) :
:![[thin space (1/6-em)]](https://www.rsc.org/images/entities/char_2009.gif) hardener ratio of 25
hardener ratio of 25![[thin space (1/6-em)]](https://www.rsc.org/images/entities/char_2009.gif) :
:![[thin space (1/6-em)]](https://www.rsc.org/images/entities/char_2009.gif) 100 by mass, with the mixture being mixed for 10 minutes. The final mixtures were cast on clean polyethylene terephthalate (PET) substrates (thickness: 100 μm) and polished Cu substrate (thickness: 30 μm). A 300 μm film was cast using an adjustable film applicator (GARDCO, width: 76 mm). The film was then procured at room temperature for 2 hours to form a skin layer and cured completely in a vacuum oven at 40 °C for 16 hours. The cured film on the PET substrate was peeled off for mechanical testing whereas the film on the Cu substrate remained intact and was used directly for electrochemical measurements. The process of the sample preparation is schematically illustrated in Fig. 1.
100 by mass, with the mixture being mixed for 10 minutes. The final mixtures were cast on clean polyethylene terephthalate (PET) substrates (thickness: 100 μm) and polished Cu substrate (thickness: 30 μm). A 300 μm film was cast using an adjustable film applicator (GARDCO, width: 76 mm). The film was then procured at room temperature for 2 hours to form a skin layer and cured completely in a vacuum oven at 40 °C for 16 hours. The cured film on the PET substrate was peeled off for mechanical testing whereas the film on the Cu substrate remained intact and was used directly for electrochemical measurements. The process of the sample preparation is schematically illustrated in Fig. 1.
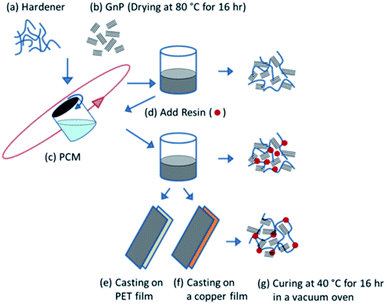 | ||
| Fig. 1 A schematic illustration for the fabrication of PU/GnP composites and casting on PET and Cu substrates. | ||
2.3 Characterizations
 | (1) |
The morphology of GnP and PU/GnP composites was characterized by the SEM (Zeiss Leo 1550). A cross-sectional sample of the PU/GnP composites for SEM was prepared by cryogenic rupture using liquid nitrogen, with samples being gold-sputtered prior to imaging.
Deionized water cleaned the corrosion sample and dried before mounting the sample holder. The double-jacketed glass cell was filled with 3.5 wt% NaCl electrolyte solution at room temperature. The electrochemical analysis was conducted using the VSP-300 workstation (Uniscan instrument Ltd., Claix, France), where each measurement was repeated five times for a reproducibility. Measurement data was analyzed using EC-Lab software (Bio-Logic).
The WE was stabilized for 3–4 hours to minimize the fluctuation of the potential before performing the measurement, followed by electrochemical impedance spectroscopy (EIS) or cyclic voltammetry (CV). EIS was conducted in a frequency range from 100 kHz to 200 Hz to obtain Nyquist and Bode plots. CV was conducted to obtain Tafel polarization curves by scanning at a rate of 20 mV min−1 in the potential range from −500 mV to 500 mV. The Tafel plot was used to determine the corrosion current (Icorr) by extrapolating the linear portion of the anodic and cathodic curves using the EC-Lab software.
The corrosion rate (Rcorr), in units of mils per year (MPY) was determined by the following equation (eqn (2))48 as described in the ASTM standard G102:
 | (2) |
3. Results and discussion
3.1 Morphology and structure of GnP
SEM images of the four different grades of pristine GnP are illustrated in Fig. 3 under the identical magnification for the exact comparison of GnP size. The images reveal that the diameter of each GnP matches the reported average diameter from the manufacturer, while the actual size distribution of the samples is broad in appearance. Nevertheless, the SEM images show the distinct differences in size between the four grades of GnP.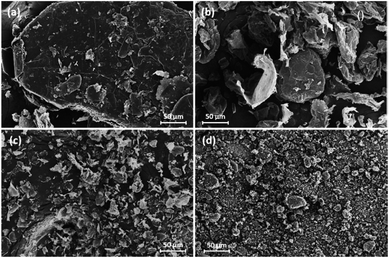 | ||
| Fig. 3 SEM images for different grades of GnP: (a) xGnP H100, (b) xGnP M25, (c) xGnP M5, and (d) xGnP C750. | ||
An XRD spectrum of each GnP is presented in Fig. 4, and the calculated parameters of the GnP from the XRD spectra are summarized in Table 2. The three grades of GnP (excluding C750) show a comparable XRD spectrum in terms of the position and breadth of the peak (2θ = 26°). The d-spacing, or interlayer distance between graphene sheets, was calculated to be 3.35–3.38 Å for the three grades using Bragg's equation. The number of graphene layers, indicative of the crystallite size of the GnP, was calculated as 62 (H100), 56 (M25), and 58 (M5), respectively. On the other hand, C750 shows a relatively broad spectrum and low intensity when compared to the other three grades of GnP, and the number of layers calculated to be 13. For this reason, the aspect ratio, defined as the ratio of the average diameter (D) and the thickness of GnP (L), is not proportional to the diameter of GnP, especially for C750 and M5. The reason being that the number of layers for C750 is considerably lower than M5 but the difference of diameter between C750 and M5 is not relatively significant. Additionally, the bulk density of C750 was considerably larger than the other grades of GnP. Due to the higher bulk density and less number of layers of C750, a greater number of particles can be dispersed in a unit volume at the same sample weight of GnP. Therefore, it can be assumed that a higher degree of dispersion is relatively achievable with C750 compared with other grades of GnP.
 | ||
| Fig. 4 XRD spectrum for the four commercial grades of GnP: (a) xGnP H100, (b) xGnP M25, (c) xGnP M5, and (d) xGnP C750. | ||
| Grade | FWHM (rad, ×10−3) | d-spacing (Å) | Number of graphene layers | Bulk density (g cm−3) | Aspect ratio (D/L) |
|---|---|---|---|---|---|
| H-100 | 6.76 | 3.38 | 62 | 0.03–0.1 | 4032.3 |
| M-25 | 7.54 | 3.36 | 56 | 0.03–0.1 | 1116.1 |
| M-5 | 7.31 | 3.35 | 58 | 0.03–0.1 | 215.5 |
| C-750 | 33.12 | 3.37 | 13 | 0.2–0.4 | 384.6 |
3.2 Electrochemical properties
Cyclic Voltammetry (CV) is widely used to quantify the anti-corrosion performance of a coated or uncoated metal substrate. In general, a Tafel polarization curve can be obtained by CV measurement, with the curve providing a value to quantify the anti-corrosion performance of a material. The Tafel polarization curve is described by the relationship between a potential and current, allowing the anti-corrosion performance of the material to be evaluated by the values. For instance, higher potential and lower current value correspond with high anti-corrosion performance. Fig. 5 illustrates Tafel plots for bare Cu and the Cu coated with PU and the PU/GnP composites.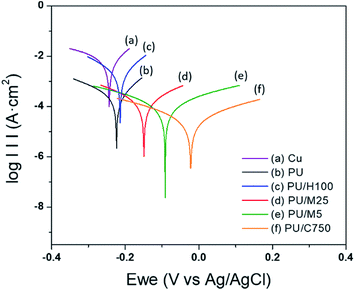 | ||
| Fig. 5 Tafel plots for (a) Cu (bare), (b) PU (pristine) on Cu, (c) PU/H100 on Cu, (d) PU/M25 on Cu, (e) PU/M5 on Cu, and (f) PU/C750 on Cu (GnP loading for all samples: 1 wt%). | ||
The plots reveal that PU/GnP including the smaller diameter of GnP shifts the polarization curve to the direction of a larger potential and a smaller current. This means that the smaller size of GnP in the composites improves the anti-corrosion performance of PU/GnP. In addition, the Tafel plot provides significant parameters such as corrosion potential (Ecorr) and corrosion current (Icorr) to quantify the anti-corrosion performance of the composites. The parameters are determined by the point of intersection between extrapolated cathodic and anodic curves. Furthermore, Rp, polarization resistance is calculated by using the Stern–Geary equation (eqn (3));31
 | (3) |
| Samples | Ecorr (mV vs. Ag/AgCl) | Icorr (μA cm−2) | ba (mV dec−1) | bc (mV dec−1) | Rp (Ω cm2) | Rcorr (MPY) | PEF (%) |
|---|---|---|---|---|---|---|---|
| Cu | −243.5 | 6.37 | 113.1 | 99.9 | 3.6 | 5.71 | — |
| PU | −223.6 | 0.31 | 99.5 | 132.8 | 79.2 | 0.14 | 97.5 |
| PU/H100 | −213.8 | 2.47 | 103.7 | 146.3 | 10.7 | 1.13 | 80.3 |
| PU/M25 | −149.0 | 0.24 | 214.3 | 235.4 | 199.6 | 0.11 | 98.1 |
| PU/M5 | −91.6 | 0.12 | 354.7 | 356.2 | 389.8 | 0.09 | 98.4 |
| PU/C750 | −22.0 | 0.05 | 388.3 | 384.4 | 1747.5 | 0.02 | 99.6 |
The results show that as the size of GnP decreases, Ecorr increases while Icorr decreases. This means that the smaller size of GnP requires a higher corrosion potential to corrode the Cu substrate, but a lower current is detected in the potentiodynamic electrochemical system. However, it should be noted that the Icorr value of PU/H100 (2.47 μA cm−2) is higher than the pristine PU (0.31 μA cm−2), resulting in a lower Rp value (10.7 Ω cm2) and a higher Rcorr (1.13 MPY). This unexpected variation is likely due to the thickness of the PU/H100 layer on the Cu substrate. For instance, Qi et al. reported that the lower thickness of the film led to a higher corrosion current with an unchanged corrosion potential.49 However, PU/H100 was cast on the Cu substrate with the same thickness as the pristine PU (300 μm). For this reason, it can be assumed that there is another reason behind the cause of the reduction of the thickness of the cast film such as a crevice on the film surface.
One description for the reason is that large agglomerates of H100 on the surface of the cast film, which had the appearance of the black dot, are able to be considered. The average diameter of H100 was revealed to be 150 μm by SEM observation, thus, the entire size of the agglomerate is larger than at least 150 μm. On the other hand, the cast film has a thickness of around 300 μm, and, as a result, it can be assumed that some agglomerates can build a crack or crevice on the cast film and the defects on the film are able to have an effect by decreasing Icorr. This is because the black dots can provide a pathway at which a corrosive agent is easy to permeate into the film inside. Essentially, this phenomenon can result in decreasing the permeation rate of the agent same as reducing the thickness of the cast film. This issue will be discussed in further detail in the section of SEM.
The protection efficiency (PEF)31 obtained from the Tafel plot is also widely used as a metric to evaluate the anti-corrosion performance of a protective layer on a metal substrate and is given by eqn (4):
 | (4) |
 represents the corrosion current of the pristine PU. Table 3 also illustrates that PEF increases by incorporating smaller sizes of GnP in the PU/GnP layer, indicating that the anti-corrosion performance of PU/GnP is enhanced with smaller sizes of GnP. However, the PEF value of the PU/H100 composite is lower than that of the pristine PU due to its relatively higher Icorr value.
Further, EIS was also used to quantify the anti-corrosive performance. Firstly, EIS measurement requires an appropriate equivalent circuit model to be built up in order to match an acquired impedance data. Equivalent circuit models for bare Cu and film-coated Cu substrate are suggested in Fig. 6,48 where Rs is the solution resistance, Rp is the polarization resistance of a coating layer associated with the charge-transfer resistance, CPE1 and CPE2 are the constant phase elements,  is another polarization resistance, and W is the Warburg impedance. Fig. 7 illustrates the Nyquist plots for bare Cu substrate and PU/GnP on Cu.
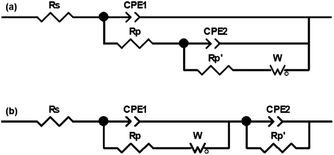 | ||
| Fig. 6 Equivalent circuit model for matching with the electrochemical impedance data: (a) bare Cu and (b) film coated Cu substrate in NaCl solution (3.5 wt%). | ||
In this figure, the dotted line represents the measured EIS data and the solid line represents fitting results with the equivalent circuit model, with the two lines being well fitted with each other.48 The point of interest in these Nyquist plots is the diameter of the semicircle. In general, a larger semicircle diameter corresponds with a higher resistance, which is inversely proportional to Icorr, indicating high anti-corrosion performance.26 In Fig. 7, the EIS spectrum of the bare Cu substrate shows the typical curve,48,50 with the semicircle size at the low-frequency end being 10.2 kΩ cm2. The pristine PU on Cu shows a larger semicircle as the value of 77.8 kΩ cm2 than the bare Cu, meaning that the anti-corrosion performance of the Cu substrate is improved by the PU layer alone. However, the PU/GnP composites show much larger semicircles than the pristine PU and, thus GnP highly contributes to the improvement of the anti-corrosion performance of the composites. Furthermore, PU/GnP with the smaller size of GnP shows the larger diameter of the semicircle in the Nyquist plot, causing the semicircle diameter of the PU/GnP composites to increase from 104.8 kΩ cm2 to 616.6 kΩ cm2 by a decrease of GnP size. However, the semicircle diameter of PU/H100 is almost similar to that of the pristine PU, which is in line with the CV measurement.
Specific values consisting of the equivalent circuit in Fig. 6 are shown in Table 4 based on fitting the equivalent circuit model with the acquired EIS data. Among the specific values, protection efficiency  50 can be also calculated from Rp, which represents the polarization resistance of the coating layer as follows in eqn (5):
 | (5) |
 is the polarization resistance of the Cu substrate. The
  value of the pristine PU is 88.1%, and the value increases under the existence of GnP, with an even smaller size of GnP in the composites showing a higher
  of up to 98.7%. These results are in accordance with the results from potentiodynamic measurement (cyclic voltammetry) in Table 3. As a result, the two tendencies from EIS and CV show that GnP plays a significant role in reducing a corrosion of the composites and that a smaller size of GnP can be more effective to prevent the corrosion.
| Samples | Rs (Ω cm2) | Rp (Ω cm2) | CPE1 (Ω−1 Sn1 cm−2) | n1 | (Ω cm2) | CPE2 (Ω−1 Sn2 cm2) | n2 | W (Ω−1 Sn1 cm−2) | (%) |
|---|---|---|---|---|---|---|---|---|---|
| Cu | 7.3 × 101 | 8.5 × 10³ | 9.55 × 10⁻⁶ | 0.97 | 2.6 × 10² | 3.9 × 10⁻³ | 0.50 | 8.5 × 100 | — |
| PU | 6.6 × 101 | 7.2 × 10⁴ | 1.01 × 10⁻¹⁰ | 1.00 | 1.0 × 10³ | 1.0 × 10⁻⁹ | 0.94 | 3.1 × 101 | 88.1 |
| PU/H100 | 8.3 × 101 | 9.3 × 10⁴ | 1.30 × 10⁻¹⁰ | 0.96 | 1.9 × 10² | 2.1 × 10⁻¹⁰ | 0.91 | 4.1 × 100 | 90.8 |
| PU/M25 | 8.7 × 101 | 3.2 × 10⁵ | 2.92 × 10⁻¹⁰ | 0.90 | 5.6 × 10² | 8.5 × 10⁻⁹ | 0.37 | 1.3 × 10² | 97.3 |
| PU/M5 | 8.3 × 101 | 4.1 × 10⁵ | 2.02 × 10⁻¹⁰ | 0.91 | 8.6 × 10³ | 2.3 × 10⁻¹⁰ | 0.52 | 2.4 × 10² | 97.9 |
| PU/C750 | 1.5 × 10² | 6.5 × 10⁵ | 1.88 × 10⁻¹⁰ | 0.92 | 1.7 × 10⁴ | 2.6 × 10⁻¹⁰ | 0.20 | 1.0 × 10³ | 98.7 |
To supplement the Nyquist plot, Bode plots were also used to compare the anti-corrosion performance of the PU/GnP composites. Fig. 8 illustrates the Bode plot (a) and phase plot (b) for the bare Cu and PU/GnP on Cu. In Fig. 8(a), the Zreal value (real part of impedance) at the lowest frequency represents the anti-corrosion performance. Thus, the larger value of Zreal leads to a smaller Icorr and a higher performance. The Bode plot shows the distinct tendency for smaller sizes of GnP in the composite to produce higher Zreal values at the lowest frequency.26,48 PU/H100 shows a slightly lower Zreal value (5.09 Ω cm2) than the pristine PU (5.14 Ω cm2), however, the Zreal value difference between PU/H100 and the pristine PU is not large enough to discuss as the difference of the anti-corrosion performance of them. As a result, the Bode plot also confirms that the addition of H100 does not contribute significantly to improving the anti-corrosion performance of the composite rather than the pristine PU. As a result, the anti-corrosion performance of the composites is definitely improved by decreasing GnP size, whereas H100, the largest size of GnP, does not follow this trend. It is assumed that these results are related to the phenomenon due to a large particle which is coagulated by H100 as mentioned above.
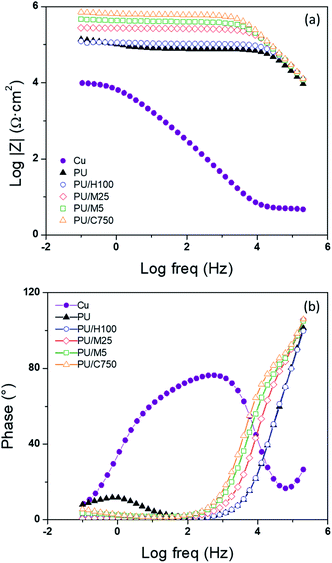 | ||
| Fig. 8 Bode (a) and phase (b) plots for pristine Cu, pristine PU, PU/H100, PU/M25, PU/M5, and PU/C750 on Cu (GnP loading for all samples: 1 wt%). | ||
3.3 Mechanical properties of PU/GnP composites
Fig. 9(a) presents the stress–strain curves of the pristine PU and the PU/GnP composites with a GnP loading of 1 wt%. The tensile modulus of the pristine PU corresponds with 0.85 MPa from the initial linear slope of the curve. On the other hand, the PU composites with 1 wt% of GnP show a slightly steeper initial slope than the slope of the pristine PU which means that a stiffness of PU/GnP composites is higher than the neat PU. However, tensile strength and elongation at the break decrease for all composites including GnP in this figure. Tensile modulus comparison of the PU/GnP composites in 1 wt% is shown in Fig. 9(b). In this figure, PU/H100 has the highest tensile modulus, but PU/C750 has the lowest value. This means that tensile modulus of PU/GnP is likely to be proportional to the diameter of GnP. In addition to the comparison, specific values of mechanical properties for the 1 wt% composites are shown in Table 5, respectively. As briefly mentioned above, tensile strength and elongation at break of the PU/GnP composites show relatively lower values than the pristine PU which means that the existence of GnP causes reduction of the elongation of the composites and the elongation associates with the tensile strength. This is a general tendency in terms of a polymer composite including an inorganic filler and it can be explained by an interfacial adhesion theory and the dispersion or an agglomerate of GnP as other studies.39–42 It is assumed that, if the interfacial adhesion between the PU matrix and the surface of GnP is insufficient, external stress will not uniformly transfer throughout the whole composite. Herein, van der Waals force between the GnP layers can suppress the stress transfer in the composite as well.51,52 In addition, inferior dispersion on the agglomerate of GnP can cause a defect in the composite. For this reason, a lack of strong interfacial adhesion and dispersion or aggregates of GnP often result in early rupture of the tensile specimen during the extension process. To improve the interfacial interaction between PU and GnP, numerous researchers have suggested a chemical treatment of the surface of GnP.53,54 However, this study primarily focuses on the effect of GnP size in the PU/GnP composites. Thus, functionalization of GnP will be studied in the future for improvement of mechanical properties of PU/GnP. | ||
| Fig. 9 Strain–Stress (SS) curves of the PU/GnP composites at (a) 1 wt% GnP loading and (b) comparison of tensile modulus for the 1 wt% composites of PU/GnP. | ||
| Samples | Contents of GnP (wt%) | Tensile modulus (MPa) | Tensile strength (MPa) | Elongation at break (%) |
|---|---|---|---|---|
| Neat PU | — | 0.85 ± 0.08 | 4.3 ± 0.3 | 926 |
| PU/H100 | 1 | 1.09 ± 0.04 | 3.1 ± 0.3 | 494 |
| PU/M25 | 1 | 1.07 ± 0.01 | 3.6 ± 0.2 | 530 |
| PU/M5 | 1 | 0.88 ± 0.04 | 3.2 ± 0.2 | 624 |
| PU/C750 | 1 | 0.79 ± 0.03 | 4.1 ± 0.1 | 782 |
Therefore, in this study, it can be summarized that tensile strength and elongation at the break of PU/GnP are not improved by adding GnP due to the deficient interfacial adhesion between PU and GnP. However, tensile modulus which occurs in the small range of extension is partially improved by the addition of GnP.
3.4 Morphology of PU/GnP composites
Fig. 10 shows the cross-sectional morphology of PU/GnP composites with a loading of 1 wt% using SEM. Each type of GnP is readily dispersed in PU and shows their intrinsic size. In Fig. 10a, the thickness of H100 seems to be particularly thicker than other GnPs. This phenomenon seems to be due to the inferior dispersion and aggregation of H100 compared to other composites. For instance, PU/M25 composite in Fig. 10b seems to show relatively better dispersion and less agglomeration of GnP than PU/H100 though M25 is the second largest GnP. On the other hand, the small GnPs, such as M5 and C750, are not only well dispersed within the polymer matrix but also the detached layers within GnP are not observed. Based on this observation, it can be assumed that the larger size of GnP is difficult to be well dispersed into the polymer matrix and is easy to be aggregated each other. Thus, the large greater GnP such as H100 occupies a larger domain in the polymer matrix. Therefore, a smaller number of GnP particles are better distributed in the composites under the same loading of GnP. This dispersion property regarding the large sized GnP with a greater number of layers such as H100 and M25 can influence to reduce mechanical properties and anti-corrosion performance of the composite. Furthermore, Fig. 11 reveals that PU/H100 shows a void between the PU matrix and GnP near the surface of the film. This void should be caused by the inferior dispersion and aggregation of H100. The void can allow a corrosive agent to diffuse into PU/H100 composite from the surface easily. For this reason, large H100 particles or agglomerates are likely to reduce the anti-corrosion performance of the PU/GnP layer because as the corrosive agents pass through the voids, the path length for the corrosive agent is reduced. However, PU/M5 and PU/C750 show a uniform dispersion of GnP in the PU matrix without voids. Therefore, small GnPs are likely to provide a relatively more efficient pathway which can suppress the penetration of corrosive agents than large GnPs. Furthermore, the voids generated due to large GnPs can also reduce the mechanical properties of PU/GnP since the strength of interfacial adhesion is proportional to the contact area among PU and GnP. As a result, the PU/H100 composite shows the lowest value of elongation at the break among the composites. Fig. 12 depicts a schematic mechanism for the size effect of GnP with regards to the anti-corrosion performance of PU/GnP. This figure suggests that the smaller GnPs are well-dispersed within the composites and provide more effective pathway to prevent diffusion of the corrosive agent. Thus, the time taken for the corrosive agent to reach the Cu substrate is extended.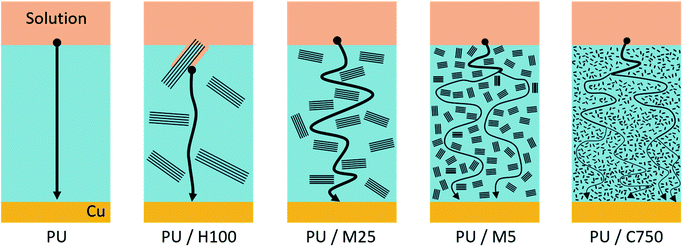 | ||
| Fig. 12 Schematic model for the permeation of the corrosive agent (•) passing through the coating layer of the PU composite containing 1 wt% GnP. | ||
4. Conclusions
Four different grades of GnP (H100, M25, M5, and C750) were prepared to fabricate PU/GnP composites. Electrochemical, mechanical, and morphological properties of the composites were studied, and the size effect of GnPs on the anti-corrosion performance was specifically investigated. The size difference among the four grades of GnP was distinctly enough to compare the size effect of GnP and this was confirmed by SEM and XRD. The enhanced anti-corrosion performance against the corrosive media was achieved by the PU/GnP composites, and the performance was improved by decreasing the size of GnP. The highest anti-corrosion performance was achieved by PU composite incorporated with C750, the smallest GnP, and the performance was indicated by various parameters such as Ecorr, Icorr, and PEF. This was because the smaller size of GnP was not only uniformly dispersed within the polymer matrix but also provided convoluted pathways that suppress corrosive agents to diffuse through the polymer matrix. However, the mechanical properties of the composites were partially improved. GnP contributed to improving the tensile modulus of the composites in the initial linear range, but the elongation at break and tensile strength eventually decreased by the existence of GnP. This result could be explained by that external stresses applied to the composite cannot be uniformly dispersed to the composite inside owing to insufficient interfacial adhesion, whereby it could lead an early rupture of the composite during the extension process. Morphological properties of the composites supported the results, whereas voids between PU and GnP were found in PU composites incorporated with large GnP (H100, M25). The voids consequently reduced the anti-corrosion performance of the composites, and this was illustrated in the schematic model.Conflicts of interest
There are no conflicts to declare.Acknowledgements
This research was financially supported by the Natural Sciences and Engineering Research Council of Canada (NSERC).References
- G. Christopher, M. Anbu Kulandainathan and G. Harichandran, Prog. Org. Coat., 2015, 89, 199–211 CrossRef CAS.
- M. F. Montemor, Surf. Coat. Technol., 2014, 258, 17–37 CrossRef CAS.
- H. Wei, D. Ding, S. Wei and Z. Guo, J. Mater. Chem. A, 2013, 1, 10805 CAS.
- J. R. Davis, Corrosion: Understanding the basics, ASM International, 2000 Search PubMed.
- M. Stratmann, R. Feser and A. Leng, Electrochim. Acta, 1994, 39, 1207–1214 CrossRef CAS.
- E. Ghiamati Yazdi, Z. S. Ghahfarokhi and M. Bagherzadeh, New J. Chem., 2017, 41, 12470–12480 RSC.
- B. P. Singh, B. K. Jena, S. Bhattacharjee and L. Besra, Surf. Coat. Technol., 2013, 232, 475–481 CrossRef CAS.
- P. A. Sørensen, S. Kiil, K. Dam-Johansen and C. E. Weinell, J. Coat. Technol. Res., 2009, 6, 135–176 CrossRef.
- C.-H. Chang, T.-C. Huang, C.-W. Peng, T.-C. Yeh, H.-I. Lu, W.-I. Hung, C.-J. Weng, T.-I. Yang and J.-M. Yeh, Carbon, 2012, 50, 5044–5051 CrossRef CAS.
- K. Cai, S. Zuo, S. Luo, C. Yao, W. Liu, J. Ma, H. Mao and Z. Li, RSC Adv., 2016, 6, 95965–95972 RSC.
- S. B. Lyon, R. Bingham and D. J. Mills, Prog. Org. Coat., 2017, 102, 2–7 CrossRef CAS.
- J.-M. Yeh, S.-J. Liou, C.-Y. Lin, C.-Y. Cheng, Y.-W. Chang and K.-R. Lee, Chem. Mater., 2002, 14, 154–161 CrossRef CAS.
- G. Grundmeier, W. Schmidt and M. Stratmann, Electrochim. Acta, 2000, 45, 2515–2533 CrossRef CAS.
- S. Ahmad, S. M. Ashraf, E. Sharmin, A. Mohomad and M. Alam, J. Appl. Polym. Sci., 2006, 100, 4981–4991 CrossRef CAS.
- W.-K. Lu, R. L. Elsenbaumer and B. Wessling, Synth. Met., 1995, 71, 2163–2166 CrossRef CAS.
- E. Armelin, C. Alemán and J. I. Iribarren, Prog. Org. Coat., 2009, 65, 88–93 CrossRef CAS.
- A. Talo, O. Forsen and S. Yläsaari, Synth. Met., 1999, 102, 1394–1395 CrossRef CAS.
- M. Rostami, S. Rasouli, B. Ramezanzadeh and A. Askari, Corros. Sci., 2014, 88, 387–399 CrossRef CAS.
- X. Shi, T. A. Nguyen, Z. Suo, Y. Liu and R. Avci, Surf. Coat. Technol., 2009, 204, 237–245 CrossRef CAS.
- O. u. Rahman, M. Kashif and S. Ahmad, Prog. Org. Coat., 2015, 80, 77–86 CrossRef CAS.
- M. Heidarian, M. R. Shishesaz, S. M. Kassiriha and M. Nematollahi, Prog. Org. Coat., 2010, 68, 180–188 CrossRef CAS.
- G. Verma, A. Kaushik and A. K. Ghosh, Prog. Org. Coat., 2013, 76, 1046–1056 CrossRef CAS.
- V. Vajihinejad and J. B. P. Soares, Macromol. Mater. Eng., 2016, 301, 383–389 CrossRef CAS.
- H. Ashrafizadeh, P. Mertiny and A. McDonald, Wear, 2016, 368–369, 26–38 CrossRef CAS.
- J. O. Akindoyo, M. D. H. Beg, S. Ghazali, M. R. Islam, N. Jeyaratnam and A. R. Yuvaraj, RSC Adv., 2016, 6, 114453–114482 RSC.
- M. Mo, W. Zhao, Z. Chen, Q. Yu, Z. Zeng, X. Wu and Q. Xue, RSC Adv., 2015, 5, 56486–56497 RSC.
- B. R. Tian and Y. F. Cheng, Electrochim. Acta, 2007, 53, 511–517 CrossRef CAS.
- S. Sinha Ray and M. Okamoto, Prog. Polym. Sci., 2003, 28, 1539–1641 CrossRef.
- M. Moniruzzaman and K. I. Winey, Macromolecules, 2006, 39, 5194–5205 CrossRef CAS.
- H. Kim, A. A. Abdala and C. W. Macosko, Macromolecules, 2010, 43, 6515–6530 CrossRef CAS.
- Y.-H. Yu, Y.-Y. Lin, C.-H. Lin, C.-C. Chan and Y.-C. Huang, Polym. Chem., 2014, 5, 535–550 RSC.
- Y.-S. Jun, S. Sy, W. Ahn, H. Zarrin, L. Rasen, R. Tjandra, B. M. Amoli, B. Zhao, G. Chiu and A. Yu, Carbon, 2015, 95, 653–658 CrossRef CAS.
- A. K. Geim and K. S. Novoselov, Nat. Mater., 2007, 6, 183–191 CrossRef CAS PubMed.
- C. Lee, X. Wei, J. W. Kysar and J. Hone, science, 2008, 321, 385–388 CrossRef CAS PubMed.
- X. Du, I. Skachko, A. Barker and E. Y. Andrei, Nat. Nanotechnol., 2008, 3, 491–495 CrossRef CAS PubMed.
- A. A. Balandin, S. Ghosh, W. Bao, I. Calizo, D. Teweldebrhan, F. Miao and C. N. Lau, Nano Lett., 2008, 8, 902–907 CrossRef CAS PubMed.
- M. Schriver, W. Regan, W. J. Gannett, A. M. Zaniewski, M. F. Crommie and A. Zettl, ACS Nano, 2013, 7, 5763–5768 CrossRef CAS PubMed.
- M. A. Raza, A. V. K. Westwood, A. P. Brown and C. Stirling, Compos. Sci. Technol., 2012, 72, 467–475 CrossRef CAS.
- S. K. Yadav and J. W. Cho, Appl. Surf. Sci., 2013, 266, 360–367 CrossRef CAS.
- C. F. Glover, C. Richards, J. Baker, G. Williams and H. N. McMurray, Corros. Sci., 2017, 114, 169–172 CrossRef CAS.
- J. A. King, D. R. Klimek, I. Miskioglu and G. M. Odegard, J. Compos. Mater., 2015, 49, 659–668 CrossRef CAS.
- B. Z. Jang and A. Zhamu, J. Mater. Sci., 2008, 43, 5092–5101 CrossRef CAS.
- A. Nieto, D. Lahiri and A. Agarwal, Carbon, 2012, 50, 4068–4077 CrossRef CAS.
- H. Kim, Y. Miura and C. W. Macosko, Chem. Mater., 2010, 22, 3441–3450 CrossRef CAS.
- N. S. Sangaj and V. C. Malshe, Prog. Org. Coat., 2004, 50, 28–39 CrossRef CAS.
- A. M. Pinto, J. Cabral, D. A. P. Tanaka, A. M. Mendes and F. D. Magalhães, Polym. Int., 2013, 62, 33–40 CrossRef CAS.
- Y. Li, J. Zhu, S. Wei, J. Ryu, Q. Wang, L. Sun and Z. Guo, Macromol. Chem. Phys., 2011, 212, 2429–2438 CrossRef CAS.
- H. Alhumade, A. Abdala, A. Yu, A. Elkamel and L. Simon, Can. J. Chem. Eng., 2016, 94, 896–904 CrossRef CAS.
- K. Qi, Y. Sun, H. Duan and X. Guo, Corros. Sci., 2015, 98, 500–506 CrossRef CAS.
- K. F. Khaled, Mater. Chem. Phys., 2011, 125, 427–433 CrossRef CAS.
- S. Chatterjee, F. Nafezarefi, N. H. Tai, L. Schlagenhauf, F. A. Nüesch and B. T. T. Chu, Carbon, 2012, 50, 5380–5386 CrossRef CAS.
- L. Yue, G. Pircheraghi, S. A. Monemian and I. Manas-Zloczower, Carbon, 2014, 78, 268–278 CrossRef CAS.
- J. S. Jeong, J. S. Moon, S. Y. Jeon, J. H. Park, P. S. Alegaonkar and J. B. Yoo, Thin Solid Films, 2007, 515, 5136–5141 CrossRef CAS.
- G. Gonçalves, P. A. A. P. Marques, A. Barros-Timmons, I. Bdkin, M. K. Singh, N. Emami and J. Grácio, J. Mater. Chem., 2010, 20, 9927 RSC.
| This journal is © The Royal Society of Chemistry 2018 |


