 Open Access Article
High n-type and p-type thermoelectric performance of two-dimensional SiTe at high temperature
Qian Wanga,
Ruge Quhe *ab,
Zixuan Guanc,
Liyuan Wua,
Jingyun Bia,
Pengfei Guand,
Ming Lei*ab and
Pengfei Lu
 *a
*a
aState Key Laboratory of Information Photonics and Optical Communications, Beijing University of Posts and Telecommunications, Beijing 100876, China. E-mail: quheruge@bupt.edu.cn; mlei@bupt.edu.cn; photon.bupt@gmail.com
bCollege of Science, Beijing University of Posts and Telecommunications, Beijing 100876, China
cSchool of Information and Communication Engineering, Faculty of Engineering, Beijing University of Posts and Telecommunications, Beijing 100876, China
dBeijing Computational Science Research Center, Beijing 100193, China
First published on 11th June 2018
Abstract
From a device perspective, achieving great merits for both n- and p-type thermoelectric systems is particularly desirable. By first-principles calculations, electronic, phonon, and thermoelectric transport properties of 2D SiTe with three different structural phases are investigated, which are quadruple layer (QL), black-phosphorene-like (α-SiTe) and blue-phosphorene-like (β-SiTe), respectively. Of these three structure phases, β-SiTe possesses the best thermoelectric properties. This is because the DOS peak near the valence band results in a high Seebeck coefficient, further leading to a high power factor. We also demonstrate that strong phonon scattering heavily influences the lattice thermal conductivity Kl of β-SiTe. With the combination of high power factor and low Kl, the ZTmax value of β-SiTe reaches 0.95 at T = 1300 K for both n- and p-type doped systems. Therefore, 2D β-SiTe is a promising candidate for future high-temperature solid-state thermoelectric generators with a balanced performance of the n- and p-legs.
1. Introduction
Thermoelectric materials, as an important carrier for energy conversion between heat and electricity, have been widely studied and considerable progress has been made in the past several decades. In general, thermoelectric efficiency is determined by the dimensionless figure of merit, ZT, defined as ZT = S2Tσ/K, where S, T, σ and K are Seebeck efficient, absolute temperature, electrical conductivity and thermal conductivity, respectively. The thermal conductivity is given by the sum of contributions from lattice (Kl) and electronic (Ke) carriers. A good performance will rely on a high power factor (S2σ) and a low thermal conductivity, and these transport parameters are closely interrelated and related to the complex electronic and crystal structure. What's more, a thermoelectric device made up of n- and p-type legs is connected electrically in series but thermally in parallel, and an ideal case is to prepare two n- and p-type materials with closely matched properties and compositions. Hence, providing balanced n- and p- type performance and great thermoelectric properties is similarly important.Great figure of merits have been achieved in both n- and p-type thermoelectric systems performed at the low- and mid-temperature (<900 K). We noticed that group-IV tellurides compounds are typically used for mid-temperature thermoelectric application, such as PbTe, GeTe and SnTe.1–4 However, in the high temperature regime, the state of the art thermoelectric materials p-type silicon-germanium alloys show relatively low level of ZT value, because of the relatively high lattice thermal conductivity of the diamond structure.1,5–7 In the field of thermoelectricity, IV–VI compounds with their low lattice thermal conductivities, have been extensively studied theoretically and experimentally.8–10 Especially, silicon and silicon-based tellurides attracts intensive attentions due to the nontoxic and earth-abundant features, and possibility to integrate with the modern semiconductor industry. Single-crystal two-dimensional, layered nanostructures of silicon telluride, Si2Te3, has been successfully synthesized by Keuleyan et al. in 2015.11 Thereafter, the theoretical study of Si2Te3 in both bulk and monolayer form has been reported in 2016.12 And Juneja et al. found n-type Si2Te3 possess highly efficient thermoelectric properties in 2017, indicating the potential of silicon-based tellurides as thermoelectric material.13 2D SiTe with a quadruple layer structure has been synthesized successfully as part of a three-dimensional phase-change superlattice.14 Ma et al. reported the thermally and dynamically stability of 2D SiTe, and considered it to be a topological material.15 Besides, two other stable forms of 2D SiTe monolayer, α-SiTe and β-SiTe, have been proposed by Chen et al., which are black-phosphorene-like and blue-phosphorene-like, respectively.16 They predicted the stability of α-SiTe and β-SiTe monolayer, and investigated the mechanical and electronic properties using first-principles theory.
In this paper, we systematically study and compare the electronic, thermoelectric and phonon transport properties of 2D SiTe with three different structures by combining the first-principles calculations and semi-classical Boltzmann theory. Our calculation shows that QL-SiTe and α-SiTe reach the highest ZT values of 0.58, and 0.82 near the temperature of 600 K, respectively. Remarkably, β-SiTe possesses high thermoelectric performance for both n- and p-type doped with predicted ZT value of 0.92 (n-type) and 0.95 (p-type) at high temperature (>1000 K). Considering the need of similar mechanical and thermoelectric properties for n-type and p-type legs of thermoelectric generator, β-SiTe can be deemed an environmental-friendly alternative for high-temperature thermoelectric material.
2. Method
Electronic properties of 2D SiTe crystal are calculated by using density functional theory (DFT)17 as implemented in the Vienna Ab initio Simulation Package (VASP).18 Exchange-correlation potential calculation is based on Perdew–Burke–Ernzerhof generalized gradient approximation (GGA-PBE).17 For QL-SiTe, the energy cutoff is set to 400 eV and Brillouin zone (BZ) integration is performed with the k-points meshes of 20 × 20 × 1. For α-SiTe and β-SiTe, the calculation is performed with the energy cutoff of 400 eV and the k-points meshes of 19 × 19 × 1. The total energy and force are converged to 1 × 10⁻⁴ eV and 1 × 10⁻³ eV Å−1, respectively.Electronic transport coefficients are calculated through solving semi-classical Boltzmann transport equation within the constant relaxation time approximation as implemented in BoltzTraP program.19 The thermal lattice conductivity is evaluated from self-consistently calculated phonon lifetimes as implemented in ShengBTE code.20
The phonon dispersions are calculated by PHONOPY package.21 To obtain the phonon spectra, we calculated the second-order harmonic interatomic force constants (IFCs)22 by using density-functional perturbation theory (DFPT).23 And the third-order anharmonic IFCs can be used to calculate lattice thermal conductivity and the three-phonon scattering rate, and are obtained using the 2 × 2 × 1 supercell for QL-SiTe and 4 × 4 × 1 supercell for α-SiTe (or β-SiTe) with finite-difference method.19
3. Result and discussion
3.1 Structure and stability
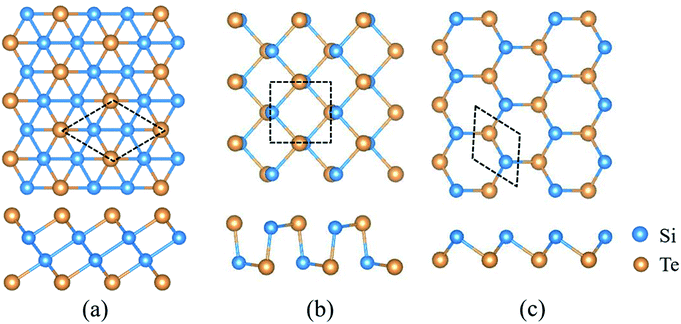
2D SiTe possesses three different structural phases, including QL-SiTe, α-SiTe and β-SiTe. Fig. 1 shows the optimized structure of QL-SiTe, α-SiTe and β-SiTe. QL-SiTe 2D crystal is represented by hexagonal primitive unit cell with a P![[3 with combining macron]](https://www.rsc.org/images/entities/char_0033_0304.gif) m1 symmetry. It forms stacks of four atomic layers along the c-axis with two Te atoms on the surface of the crystal and two nonequivalent Si atoms at the center.15 α-SiTe 2D crystal has a space group of Pmn21 and a puckered honeycomb structure with each Si atom covalently bonded with three Te atoms, and the same is true for Te atom. In fact, the geometry structure of black-phosphorene can be realized by replacing Si and Te atoms with P atoms in the α-SiTe 2D crystal. Hence α-SiTe 2D crystal is called black-phosphorene-like. Similarly, β-SiTe 2D crystal is blue-phosphorene-like with a space group of P3m1. After fully relaxing the atom structure, the optimized first-principles lattice parameters are in good agreement with the previously reported values.15,16
m1 symmetry. It forms stacks of four atomic layers along the c-axis with two Te atoms on the surface of the crystal and two nonequivalent Si atoms at the center.15 α-SiTe 2D crystal has a space group of Pmn21 and a puckered honeycomb structure with each Si atom covalently bonded with three Te atoms, and the same is true for Te atom. In fact, the geometry structure of black-phosphorene can be realized by replacing Si and Te atoms with P atoms in the α-SiTe 2D crystal. Hence α-SiTe 2D crystal is called black-phosphorene-like. Similarly, β-SiTe 2D crystal is blue-phosphorene-like with a space group of P3m1. After fully relaxing the atom structure, the optimized first-principles lattice parameters are in good agreement with the previously reported values.15,16
The structural stability of three SiTe forms with different structures is confirmed by calculating phonon dispersion in the method of DFPT. The results in the high-symmetry directions of the first Brillion zone are plotted in Fig. 2. It can be seen that the calculated phonon dispersions are free from imaginary frequencies in the first Brillouin zone, which ensures the kinetic stability of three SiTe forms with different structures.
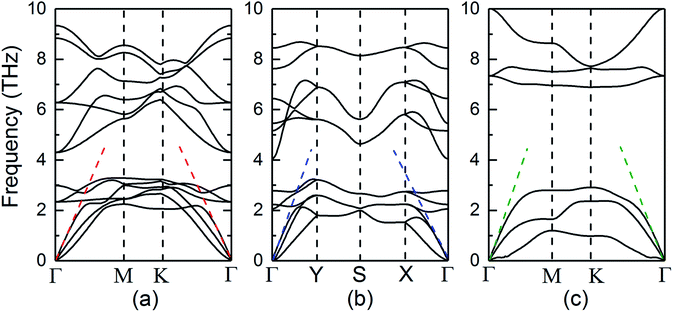 | ||
| Fig. 2 Phonon dispersions along the high symmetry k-points for (a) QL-SiTe, (b) α-SiTe, (c) β-SiTe 2D crystal, respectively. | ||
3.2 Energy-band structure
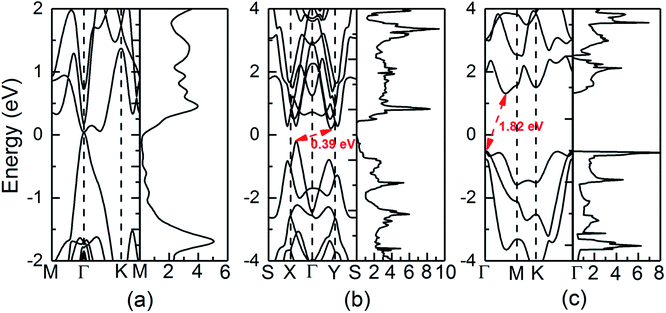
The calculated electronic structures and total density of states (DOS) of QL-SiTe, α-SiTe and β-SiTe are shown in Fig. 3. QL-SiTe is a gapless semiconductor, as the valence band maximum (VBM) and conduction band minimum (CBM) degenerate at Γ point with Fermi level locating exactly at the degenerate point. Previous study has shown QL-SiTe undergoes a transition from a gapless semiconductor to an insulator under spin orbit coupling (SOC), which suggests that it is 2D topological insulator.15 Theoretical investigations show that thermoelectric performance is closely connected to topological insulator behavior.24,25 α-SiTe is an indirect semiconductor with a band gap of 0.39 eV, as the VBM occurs along the Γ–X line. Fig. 3(b) shows that α-SiTe band structure is very similar to that of the single layer SnSe, whose band structure is considered to be “pudding mold”.26,27 The “pudding mold” proposed by Kuroki and Arita has a typical characteristic that a peculiar shape of the band contains a dispersive portion and a somewhat flat portion, which is favorable for high thermoelectric performance. The band structure of β-SiTe is plotted in Fig. 3(c). The VBM is located at the Γ point and the CBM is located on the Γ–M path. β-SiTe shows a larger band gap of 1.82 eV, close to the value of blue-phosphorene of 1.98 eV. Our calculated results for SiTe are comparable with previous works (the band gap of 0.40 eV for α-SiTe and 1.83 eV for β-SiTe).163.3 Electronic transport properties
The electronic transport properties are calculated by solving the Boltzmann Transport Equation (BTE) using the BoltzTraP code, as shown in Fig. 4. The difference of Seebeck coefficient between three SiTe forms is evident: the peak values of n-type (p-type) QL-SiTe, α-SiTe and β-SiTe are 220 μV K−1 (82 μV K−1), 775 μV K−1 (642 μV K−1), 2608 μV K−1 (2470 μV K−1) at 300 K, respectively. Clearly the difference on Seebeck coefficients stems from the electronic structure. For the “pudding model” band structure of α-SiTe, a flat upper portion provides large density-of-states for a high Seebeck coefficient, while a dispersive portion connecting to this provides a light band which favors high electronic conductivity. However, β-SiTe with the structure of blue-phosphorene-like deserves the largest Seebeck coefficient, which is about ten times larger than that of n-type QL-SiTe. The improvement in Seebeck coefficient of β-SiTe results from a sharp singularity in the density of states near to the valence band edge, and it has been demonstrated to improve thermoelectric efficiency by Mahan and Sofo.28 Furthermore, the trend of Seebeck coefficients keeps with that of band gaps. As a gapless topological insulator, QL-SiTe has the smallest Seebeck coefficient.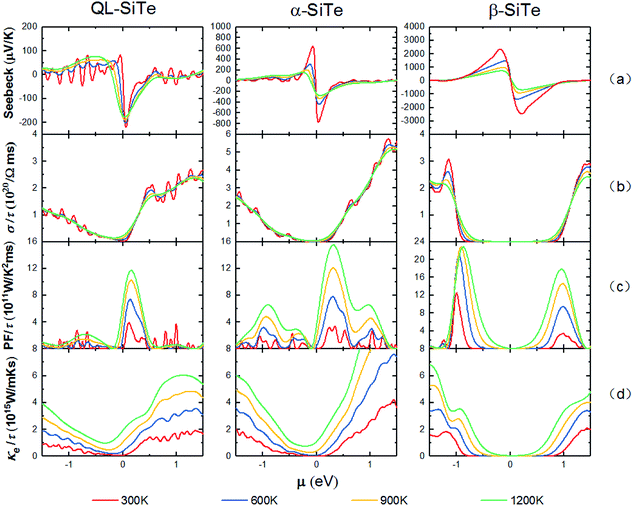 | ||
| Fig. 4 Calculated electronic transport parameters of QL-SiTe, α-SiTe, and β-SiTe as a function of chemical potential at T = 300 K, 600 K, 900 K and 1200 K, respectively. | ||
In Fig. 4(b), the electrical conductivity of QL-SiTe is relatively high at low chemical potential in comparison to α-SiTe and β-SiTe, implying a high electrical thermal conductivity. However, the Seebeck coefficient and electrical conductivity are inversely connected: as the doping concentration increases, the electrical conductivity increases and the Seebeck coefficient decreases. Therefore there exists the trade-off between electrical conductivity and Seebeck coefficient in order to achieve high power factor.
Fig. 4(c) shows the power factor with constant relaxation time τ as a function of chemical potential μ at the temperature of 300 K, 600 K, 900 K and 1200 K. Due to the trade-off between electrical conductivity and Seebeck coefficient, power factor always reaches a peak value at low chemical potential. The power factor of β-SiTe is twice as much as that of QL-SiTe, due to high Seebeck coefficient. Calculated results of power factor indicate that β-SiTe with the structure of blue-phosphorene-like may have better thermoelectric performance.
The total thermal conductivity K consists of electronic and lattice contributions. Fig. 4(d) depicts the electrical thermal conductivity as a function of chemical potential at different temperatures. Electrical thermal conductivity Ke is tied to electrical conductivity σ through an important relationship known as Wiedemann–Franz law, Ke = LσT. Thus, it is reasonable that Ke would show similar behavior as electrical conductivity σ. There is an indication of high thermoelectric efficiency that K is dominated by electrons unless μ is inside a band gap. For α-SiTe and β-SiTe, there is a substantial range of low chemical potential where electrical thermal conductivity maintains a low value (close to 0), while QL-SiTe has not similar performance. With the combination of prominent performance on Seebeck coefficient and power factor, we can predict that α-SiTe and β-SiTe maybe show better thermoelectric efficiency than QL-SiTe.
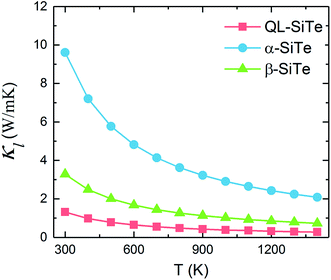
3.4 Phonon transport properties
Our calculation for lattice thermal conductivity Kl of three SiTe forms with different structures is presented in Fig. 5 as a function of temperature. It is found that the lattice thermal conductivity decrease as the increasing temperature, as expected for a phonon-dominated crystalline material, and typically goes as 1/T, which can be seen in some thermoelectric materials. All three SiTe materials have very low thermal conductivity similar to other 2D IV–VI compounds such as SnS (Kl = 4.7 W m−1 K−1), GeSe (Kl = 6.7 W m−1 K−1),8 which are lower than other 2D materials. The lattice thermal conductivity of QL-SiTe is 1.315 W m−1 K−1 at room temperature, lower than that of topological insulator Bi2Te3 (1.5 W m−1 K−1),29 which has been known as a high performance thermoelectric material for several decades. The lattice thermal conductivity of β-SiTe is a little higher than that of QL-SiTe, and α-SiTe has the highest lattice thermal conductivity.Next, we tried to reveal why there is a difference of lattice thermal conductivity of three SiTe phases. As the phonon dispersion shows in Fig. 2, QL-SiTe and α-SiTe have four-atom unit cell, resulting in twelve dispersion branches, while the phonon dispersion of β-SiTe has six branches, corresponding to the two atoms per unit cell. Three lower branches starting from 0 THz are acoustic modes, and the others are optical modes. The lowest acoustic mode (out-of-plane transversal vibration) displays a q2 relation due to the bending of the monolayer, however, the in-of-plane transversal and longitudinal acoustic branches are linear near the Γ point. Furthermore, there is an acoustic-optical gap for the phonon dispersion of β-SiTe and all optical branches in β-SiTe have frequencies at least twice the highest acoustic branch frequency, which can weaken a + a ↔ o scattering channels, and further lead to higher lattice thermal conductivity.30 However, the lattice thermal conductivity of β-SiTe is not as high as expected, and that means other more important factors can affect the lattice thermal conductivity.
The acoustic phonon branches play a more important role than optical phonon branches on lattice thermal conductivity, and lower sound velocity can lead to lower lattice thermal conductivity. The slope of the longitudinal acoustic phonon branches at the Γ point (shown as dashed straight lines) can represent the sound velocity to some degree,31 as shown in Fig. 2. In Fig. 6, group velocity and phonon scattering process are further calculated. The phonon group velocities of three SiTe forms are similar. As for the three-phonon scattering rate, α-SiTe has the lowest scattering rate than other SiTe forms, indicating a much weaker anharmonic scattering process, and this is why α-SiTe has the highest lattice thermal conductivity among three SiTe forms. Based on the analysis and results above, it can be concluded that anharmonic scattering process is the main cause of the difference of the lattice thermal conductivity of three SiTe phases.
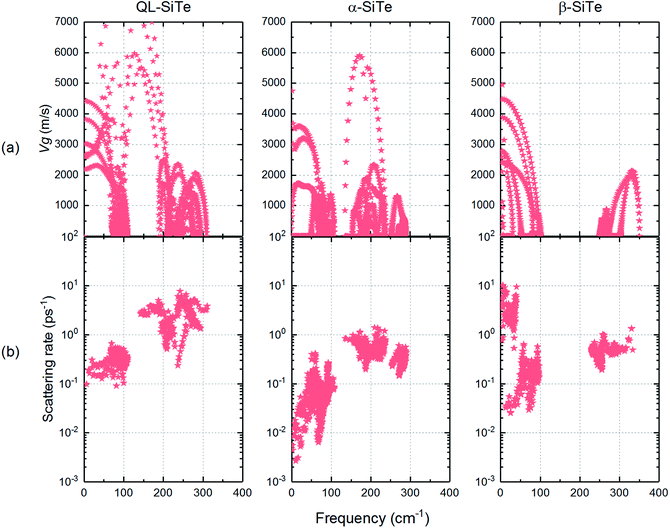 | ||
| Fig. 6 (a) Calculated phonon group velocities and (b) three-phonon scattering rate for QL-SiTe, α-SiTe and β-SiTe. | ||
3.5 Figure of merit
In order to obtain ZT value, an unknown parameter is the relaxation time τ. In real systems, the relaxation time varies with temperature and carrier concentration, and it is very difficult to precisely calculate the relaxation time τ on account of complex carrier scattering mechanisms. Herein, the relaxation time τ is predicted by the formula μ = eτ/m*, where μ is carrier mobility and m* is band effective mass. The carrier mobility is predicted by using the deformation potential theory:32
 | (1) |
| m* (me) | E1 (eV) | C (N m−1) | μ (cm2 V−1 S−1) | τ (fs) | ||
|---|---|---|---|---|---|---|
| QL-SiTe | Electron | — | 2.41 | 189.31 | — | — |
| Hole | — | −3.58 | — | — | ||
| α-SiTe | Electron | 0.52 | 2.73 | 145.20 | 1037 | 305 |
| Hole | 0.27 | −4.22 | 1536 | 240 | ||
| β-SiTe | Electron | 1.80 | 11.49 | 78.64 | 30 | 31 |
| Hole | 1.51 | −2.30 | 94 | 80 |
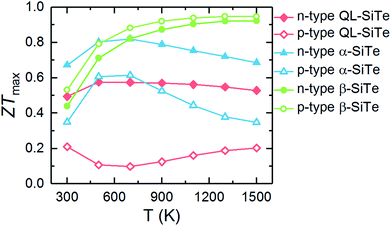
The calculated ZTmax values of three SiTe phases as a function of temperature are plotted in Fig. 7. Among of three SiTe forms, QL-SiTe has the lowest ZT value (0.58 for n-type and 0.21 for p-type). It is because the Seebeck coefficient of QL-SiTe is not as high as other SiTe forms. In addition, the large electrical conductivity of QL-SiTe can lead to a large electronic contribution to the thermal conductivity, which enhances the total thermal conductivity and suppresses the value ZT largely. QL-SiTe and α-SiTe reach the highest ZT value at the temperature of around 600 K, and the ZTmax of β-SiTe reaches near 1 at a higher temperature (above 1000 K). Furthermore, β-SiTe shows high thermoelectric performance for both n-type and p-type doped at the high temperature. This is a favorable characteristic for an ideal thermoelectric device, because both n-type and p-type materials are needed in a thermoelectric device, and it is important to prepare two thermoelements with closely similar performance, properties and compositions. And there are some theory and experiment studies demonstrating that the same material can be utilized for n-type and p-type of thermoelectric leg.5,36,37 The performance of most high-temperature thermoelectric materials is not as good as mid-temperature thermoelectric materials, such as half Heulster material Hf0.8Ti0.2CoSb0.8Sn0.2 (ZT ∼ 1 at 1000 K),38 zintl phase Eu0.2Yb0.2Ca0.6Mg2Bi2 (ZT ∼ 1.3 near 850 K),39 skutterudites (ZT ∼ 1.7 at 850 K).40 β-SiTe without complex structure and heavy doping shows relatively high performance among high-temperature thermoelectric materials as shown in Fig. 8. With the characteristic of showing high ZT value for both n-type and p-type doped at high temperature simultaneously, β-SiTe is considered a promising material for high-temperature thermoelectric generator.
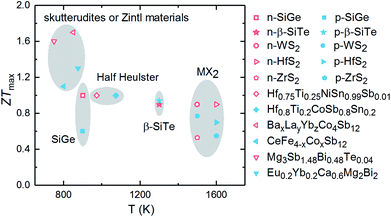 | ||
| Fig. 8 ZT values of some representative n-type (hollow) and p-type (solid) high-temperature thermoelectric materials, including SiGe alloys,1 transition metal dichalcogenides (WS2,41 ZrS2, HfS2 (ref. 42)), half heuslter (Hf0.75Ti0.25NiSn0.99Sb0.01,43 Hf0.8Ti0.2CoSb0.8Sn0.2 (ref. 44)), skutterudites (BaxLayYbzCo4Sb12,40 CeFe4−xCoxSb12 (ref. 45)), zintl materials46 (Mg3Sb1.48Bi0.48Te0.04,47 Eu0.2Yb0.2Ca0.6Mg2Bi2 (ref. 48)). | ||
4. Conclusion
In summary, we systematically analyzed the electronic, thermoelectric and phonon transport properties of three 2D SiTe forms using DFT theory combined with Boltzmann transport theory. These three SiTe phases are energetically and vibrationally stable, and QL-SiTe is a gapless topological insulator, while α-SiTe and β-SiTe are indirect semiconductors with band gaps of 0.39 eV and 1.82 eV, respectively. The difference of Seebeck coefficient is related to the electronic structure, and β-SiTe has the largest Seebeck coefficient of 2060 μV K−1 due to the sharp DOS peak near the valence band edge. These three SiTe forms have low lattice thermal conductivities in comparison to other thermoelectric materials, and α-SiTe has the largest lattice thermal conductivity, which may be due to the relatively low three-phonon scattering rate. When the system is n-type (p-type) doped with an appropriate concentration, QL-SiTe and α-SiTe have their highest ZT values of 0.58 (0.21), 0.82 (0.61) in the mid-temperature, respectively. Most interestingly, β-SiTe performs very promising thermoelectric properties for both n- and p-type doped, with the figure of value of 0.92 (n-type) and 0.95 (p-type) above 1000 K. With the balanced n- and p-type thermoelectric properties, β-SiTe shows its potential as high-temperature thermoelectric material.Conflicts of interest
There are no conflicts of interest to declare.Acknowledgements
This work was supported by the National Natural Science Foundation (No. 61675032, 61671085, and 11604019), the National Basic Research Program of China (973 Program) under Grant No. 2014CB643900, and the Open Program of State Key Laboratory of Functional Materials for Informatics. We thank for the helpful discussion with Prof.Pengfei Guan and acknowledge the computational support from the Beijing Computational Science Research Center (CSRC). We also thank Dr Fancy Qian Wang for her fruitful discussion.References
- G. J. Snyder and E. S. Toberer, in Materials For Sustainable Energy: A Collection of Peer-Reviewed Research and Review Articles from Nature Publishing Group, World Scientific, 2011, pp. 101–110 Search PubMed.
- W. Li, Y. Wu, S. Lin, Z. Chen, J. Li, X. Zhang, L. Zheng and Y. Pei, ACS Energy Lett., 2017, 2, 2349–2355 CrossRef.
- Q. Zhang, B. Liao, Y. Lan, K. Lukas, W. Liu, K. Esfarjani, C. Opeil, D. Broido, G. Chen and Z. Ren, Proc. Natl. Acad. Sci., 2013, 110, 13261–13266 CrossRef PubMed.
- J. Li, X. Zhang, S. Lin, Z. Chen and Y. Pei, Chem. Mater., 2016, 29, 605–611 CrossRef.
- G. Schierning, R. Chavez, R. Schmechel, B. Balke, G. Rogl and P. Rogl, Transl. Mater. Res., 2015, 2, 025001 CrossRef.
- J. Dismukes, L. Ekstrom, E. Steigmeier, I. Kudman and D. Beers, J. Appl. Phys., 1964, 35, 2899–2907 CrossRef.
- C. Fu, S. Bai, Y. Liu, Y. Tang, L. Chen, X. Zhao and T. Zhu, Nat. Commun., 2015, 6, 8144 CrossRef PubMed.
- A. Shafique and Y.-H. Shin, Sci. Rep., 2017, 7, 506 CrossRef PubMed.
- G. Ding, G. Gao and K. Yao, Sci. Rep., 2015, 5, 9567 CrossRef PubMed.
- X. Guan, P. Lu, L. Wu, L. Han, G. Liu, Y. Song and S. Wang, J. Alloys Compd., 2015, 643, 116–120 CrossRef.
- S. Keuleyan, M. Wang, F. R. Chung, J. Commons and K. J. Koski, Nano Lett., 2015, 15, 2285–2290 CrossRef PubMed.
- X. Shen, Y. Puzyrev, C. Combs and S. Pantelides, Appl. Phys. Lett., 2016, 109, 113104 CrossRef.
- R. Juneja, T. Pandey and A. K. Singh, Chem. Mater., 2017, 29, 3723–3730 CrossRef.
- Y. Saito, J. Tominaga, P. Fons, A. Kolobov and T. Nakano, Phys. Status Solidi Rapid Res. Lett., 2014, 8, 302–306 CrossRef.
- Y. Ma, L. Kou, Y. Dai and T. Heine, Phys. Rev. B, 2016, 94, 201104 CrossRef.
- Y. Chen, Q. Sun and P. Jena, J. Mater. Chem. C, 2016, 4, 6353–6361 RSC.
- J. P. Perdew, K. Burke and M. Ernzerhof, Phys. Rev. Lett., 1996, 77, 3865 CrossRef PubMed.
- G. Kresse and J. Furthmüller, Phys. Rev. B: Condens. Matter Mater. Phys., 1996, 54, 11169 CrossRef.
- W. Li, L. Lindsay, D. Broido, D. A. Stewart and N. Mingo, Phys. Rev. B, 2012, 86, 174307 CrossRef.
- W. Li, J. Carrete, N. A. Katcho and N. Mingo, Comput. Phys. Commun., 2014, 185, 1747–1758 CrossRef.
- A. Togo, F. Oba and I. Tanaka, Phys. Rev. B, 2008, 78, 134106 CrossRef.
- G. K. Madsen and D. J. Singh, Comput. Phys. Commun., 2006, 175, 67–71 CrossRef.
- S. Baroni, S. De Gironcoli, A. Dal Corso and P. Giannozzi, Rev. Mod. Phys., 2001, 73, 515 CrossRef.
- H. Shi, D. Parker, M.-H. Du and D. J. Singh, Phys. Rev. Appl., 2015, 3, 014004 CrossRef.
- Y. Xu, Z. Gan and S.-C. Zhang, Phys. Rev. Lett., 2014, 112, 226801 CrossRef PubMed.
- F. Q. Wang, S. Zhang, J. Yu and Q. Wang, Nanoscale, 2015, 7, 15962–15970 RSC.
- K. Kuroki and R. Arita, J. Phys. Soc. Jpn., 2007, 76, 083707 CrossRef.
- G. Mahan and J. Sofo, Proc. Natl. Acad. Sci., 1996, 93, 7436–7439 CrossRef.
- J. Zhang, H. Liu, L. Cheng, J. Wei, J. Shi, X. Tang and C. Uher, J. Appl. Phys., 2014, 116, 023706 CrossRef.
- B. Peng, D. Zhang, H. Zhang, H. Shao, G. Ni, Y. Zhu and H. Zhu, Nanoscale, 2017, 9(22), 7397–7407 RSC.
- A. Jain and A. J. McGaughey, Sci. Rep., 2015, 5, 8501 CrossRef PubMed.
- J. Xi, M. Long, L. Tang, D. Wang and Z. Shuai, Nanoscale, 2012, 4, 4348–4369 RSC.
- H. Lv, W. Lu, D. Shao and Y. Sun, Phys. Rev. B, 2014, 90, 085433 CrossRef.
- R. C. Cooper, C. Lee, C. A. Marianetti, X. Wei, J. Hone and J. W. Kysar, Phys. Rev. B, 2013, 87, 035423 CrossRef.
- C. Lee, X. Wei, J. W. Kysar and J. Hone, science, 2008, 321, 385–388 CrossRef PubMed.
- S. Ouardi, G. H. Fecher, B. Balke, X. Kozina, G. Stryganyuk, C. Felser, S. Lowitzer, D. Ködderitzsch, H. Ebert and E. Ikenaga, Phys. Rev. B, 2010, 82, 085108 CrossRef.
- B. A. MacLeod, N. J. Stanton, I. E. Gould, D. Wesenberg, R. Ihly, Z. R. Owczarczyk, K. E. Hurst, C. S. Fewox, C. N. Folmar and K. H. Hughes, Energy Environ. Sci., 2017, 10, 2168–2179 Search PubMed.
- A. D. LaLonde, Y. Pei and G. J. Snyder, Energy Environ. Sci., 2011, 4, 2090–2096 Search PubMed.
- Q. Zhang, F. Cao, W. Liu, K. Lukas, B. Yu, S. Chen, C. Opeil, D. Broido, G. Chen and Z. Ren, J. Am. Chem. Soc., 2012, 134, 10031–10038 CrossRef PubMed.
- X. Shi, J. Yang, J. R. Salvador, M. Chi, J. Y. Cho, H. Wang, S. Bai, J. Yang, W. Zhang and L. Chen, J. Am. Chem. Soc., 2011, 133, 7837–7846 CrossRef PubMed.
- A. N. Gandi and U. Schwingenschlögl, Chem. Mater., 2014, 26, 6628–6637 CrossRef.
- G. Yumnam, T. Pandey and A. K. Singh, J. Chem. Phys., 2015, 143, 234704 CrossRef PubMed.
- G. Joshi, X. Yan, H. Wang, W. Liu, G. Chen and Z. Ren, Adv. Energy Mater., 2011, 1, 643–647 CrossRef.
- X. Yan, W. Liu, H. Wang, S. Chen, J. Shiomi, K. Esfarjani, H. Wang, D. Wang, G. Chen and Z. Ren, Energy Environ. Sci., 2012, 5, 7543–7548 Search PubMed.
- J. T. Jarman, E. E. Khalil and E. Khalaf, Open Journal of Energy Efficiency, 2013, 2, 143 CrossRef.
- J. Shuai, J. Mao, S. Song, Q. Zhang, G. Chen and Z. Ren, Mater. Today Phys., 2017, 1, 74–95 CrossRef.
- J. Zhang, L. Song, S. H. Pedersen, H. Yin, L. T. Hung and B. B. Iversen, Nat. Commun., 2017, 8, 13901 CrossRef PubMed.
- J. Shuai, H. Geng, Y. Lan, Z. Zhu, C. Wang, Z. Liu, J. Bao, C.-W. Chu, J. Sui and Z. Ren, Proc. Natl. Acad. Sci., 2016, 201608794 Search PubMed.
| This journal is © The Royal Society of Chemistry 2018 |

