 Open Access Article
First-principles study of thermoelectric properties of Mg2Si–Mg2Pb semiconductor materials†
Tao Fan *ab,
Congwei Xieac,
Shiyao Wanga,
Artem R. Oganov*acd and
Laifei Chengb
aInternational Center for Materials Discovery, School of Materials Science and Engineering, Northwestern Polytechnical University, Xi'an, Shaanxi 710072, P. R. China. E-mail: nwpufant@mail.nwpu.edu.cn
bScience and Technology on Thermostructural Composite Materials Laboratory, School of Materials Science and Engineering, Northwestern Polytechnical University, Xi'an, Shaanxi 710072, P. R. China
cSkolkovo Innovation Center, Skolkovo Institute of Science and Technology, Moscow 143026, Russia. E-mail: A.Oganov@skoltech.ru
dMoscow Institute of Physics and Technology, 9 Institutskiy Lane, Dolgoprudny City, Moscow Region 141700, Russia
First published on 9th May 2018
Abstract
Mg2XIV (XIV = Si, Ge, Sn) compounds are semiconductors and their solid solutions are believed to be promising mid-temperature thermoelectric materials. By contrast, Mg2Pb is a metal and few studies have been conducted to investigate the thermoelectric properties of Mg2Si–Mg2Pb solid solutions. Here, we present a theoretical study exploring whether Mg2Pb–Mg2Si solid solutions can be used as thermoelectric materials or not. We firstly constructed several Mg2Si1−xPbx (0 ≤ x ≤ 1) structures and calculated their electronic structures. It is suggested that Mg2Si1−xPbx are potential thermoelectric semiconductors in the range of 0 ≤ x ≤ 0.25. We then explicitly computed the electron relaxation time and both the electronic and lattice thermal conductivities of Mg2Si1−xPbx (0 ≤ x ≤ 0.25) and studied the effect of Pb concentration on the Seebeck coefficient, electrical conductivity, thermal conductivity, and thermoelectric figure of merit (ZT). At low Pb concentration (x = 1/16), the ZT of the Mg2Si1−xPbx solid solutions (up to 0.67 at 900 K) reaches a maximum and is much higher than that of Mg2Si.
1 Introduction
Mg2XIV (XIV = Si, Ge, Sn) compounds and their solid solutions are promising candidates as mid-temperature thermoelectric materials because of their relatively high figure of merit ZT, good mechanical strength and chemical stability, low cost, low density, and environmental friendliness.1–6,53 A good thermoelectric material has a high figure of merit ZT, defined as, ZT = α2σT/κ, where α is the Seebeck coefficient, σ is the electrical conductivity, κ is the thermal conductivity, and T is the absolute temperature. To increase the ZT of Mg2XIV compounds and their solid solutions, many methods have been proposed over the last few decades, such as carrier doping,7–12 nanostructuring,13,14 electron-energy filtering,15,16 band-structuring engineering,17–19 and band convergence.20–22With those great efforts, the ZT among Mg2XIV compounds and their solid solutions has been greatly improved.21–27 Liu et al.21 synthesized a series of Mg2Si1−xSnx solid solutions (0.2 ≤ x ≤ 0.8) and measured their transport properties. Their first-principles calculation confirmed that two low-lying conduction bands of Mg2Si1−xSnx coincide in energy at x ≈ 0.7. At this concentration, the Seebeck coefficient α of Mg2Si1−xSnx is maximized and yields the highest ZT (1.3 around 700 K). Furthermore, they reported that the thermoelectric performance of Mg2Sn0.75Ge0.25 can be better than that of Mg2Si0.3Sn0.7. They found a similar band convergence in Mg2Sn–Mg2Ge solid solutions near the composition Mg2Sn0.75Ge0.25 and the highest ZT for Mg2Sn0.75Ge0.25 is 1.4 at 723 K.24 Mao et al.27 investigated the thermoelectric properties of Mg2Sn–Mg2Ge–Mg2Si solid solutions. The maximum ZT among these solid solutions is about 1.3 at 723 K.
Recently, Muthiah et al.28 experimentally investigated thermoelectric properties of Mg2Si doped with 2 at% of Pb. They found that, by Pb doping, thermoelectric performance of Mg2Si can be greatly enhanced. The main reason is that the electrical conductivity σ increases enormously, leading to an increase of ZT, although the huge increase of σ in Pb-doped Mg2Si is due to the formation of metallic Pb/Mg2Pb phase at the grain boundaries. Note that Mg2Si and Mg2Pb have the same crystal structure type, but their electronic properties are quite different – the former is a semiconductor, while the latter is a metal. We here note that Mg2Si and Mg2Pb may form limited solid solutions (Mg2Si1−xPbx, 0 ≤ x ≤ 1), that means electronic structures of Mg2Si1−xPbx solid solutions will vary with Pb/Si ratio, which is convenient for tuning their properties. To the best of our knowledge, there are few works related to thermoelectric properties of Mg2Si1−xPbx solid solutions.
In the present work, we investigate structures and electronic properties of various Mg2Si1−xPbx solid solutions using first-principles calculations. Firstly, we find that Mg2Si1−xPbx would become potential thermoelectric semiconductors in the range of 0 ≤ x ≤ 0.25. We then investigate thermoelectric properties of Mg2Si1−xPbx (0 ≤ x ≤ 0.25) solid solutions, including Seebeck coefficient (α), electrical conductivity (σ), thermal conductivity (κ), and figure of merit (ZT). Compared with Mg2Si, ZT of Mg2Si1−xPbx solid solutions is improved. The highest ZT we found is 0.67 at 900 K of the composition Mg64Si30Pb2.
2 Methods
Structure relaxations and total energy calculations were performed within density functional theory (DFT) using the projected augmented wave (PAW) method29 as implemented in the VASP code.30,31 We used the Perdew–Burke–Ernzerhof functional corresponding to the generalized gradient approximation (GGA-PBE).32 The cutoff for the plane-wave basis was set to 600 eV and the Brillouin zone was sampled using Γ-centered uniform Monkhorst–Pack (MP) meshes33 with the resolution of 2π × 0.02 A−1 in all calculations. All geometries were fully optimized until the total energy difference between consecutive cycles was less than 10−8 eV and the maximum Hellmann–Feynman force was less than 10−3 eV Å−1. To get more accurate band structures, hybrid functional (HSE06)34,48 was used and spin–orbit coupling was neglected in our calculation.For calculation of the interatomic force constants (IFCs) for each structure, a 2 × 2 × 2 supercell was built and the real-space finite displacement method35 was applied. The dynamical matrix was constructed based on the harmonic IFCs and phonon frequencies were obtained by diagonalizing the dynamical matrix using the PHONOPY package.36
Transport properties (Seebeck coefficient, electrical conductivity, and the electronic contribution to the thermal conductivity) were calculated in the framework of Boltzmann transport theory as implemented in the BoltzTrap code.37 GGA-PBE was applied and the Brillouin zone was firstly sampled by a 6 × 6 × 6 Monkhorst–Pack k-point mesh (20 points in the irreducible part of the Brillouin zone). Then a 41 × 41 × 41 Monkhorst–Park k-point mesh (1771 in the IBZ) was used for the calculation of transport properties. After that, necessary derivatives were calculated on a FFT grid five times as dense. Moreover, for all structures, band gaps were set equal to the results of hybrid functional calculation in order to correct the well-known problem of GGA-PBE, which underestimate the band gap.
Lattice thermal conductivity of each structure was calculated based on a full iterative solution to the Boltzmann transport equation, as implemented in ShengBTE code.38,39 Its main inputs are sets of second- and third-order interatomic force constants. For second-order IFCs, the results of PHONOPY calculation were directly used, while for third-order IFCs, a 2 × 2 × 2 supercell was built and a finite-difference approach were employed. All interactions up to third-nearest neighbors were considered, noting that it is enough to get satisfactorily converged values. After harmonic and anharmonic IFCs were obtained, a 13 × 13 × 13 q-point grid was used, meanwhile, both Born effective charges and dielectric tensors, which are required to determine the non-analytical part of the dynamical matrix, were involved in order to get the final thermal conductivity. At the same time, total Grüneisen parameter can be obtained as a weighted sum of the mode contributions.
To obtain absolute ZT values, electron relaxation time has to be calculated. Electron self-energy was calculated by combining QUANTUM ESPRESSO code40 with EPW code.41 Mg2Si and Mg2Pb primitive cell were used and the ground-state structures were computed within the local density approximation (LDA) of DFT as implemented in QUANTUM ESPRESSO code. Norm-conserving pseudopotentials were used to describe the core-valence interaction, and plane-wave kinetic energy cutoffs of 55 Ry and 70 Ry were used for the plane-wave basis set of Mg2Si and Mg2Pb, respectively. For both structures, the electronic states on 7 × 7 × 7 k-point grid using DFT and the vibrational states on 7 × 7 × 7 q-point grid using DFPT42 were calculated. Then, the electron–phonon (e–ph) matrix elements were computed using these coarse grids. Later, in order to get the electron self-energy ∑e–phn,k associated with the electron–phonon interaction, where n is band number and k is k point in the Brillouin zone, these quantities are needed to be interpolated on significantly finer grids up to 50 × 50 × 50 using an interpolation procedure based on Wannier functions implemented in the EPW code. After electron-phonon self-energy ∑e–phn,k was obtained, the e–ph scattering rate Γe–phn,k was computed from the imaginary part of the self-energy as Γe–phn,k = (2/ħ)Im(∑e–phn,k), and then the relaxation time defined as τn,k = (Γe–phn,k)−1 was obtained by inverting the scattering rate. Such electron relaxation time calculation method proved to be effective in ref. 49, detailed calculation procedures can be found in ref. 50.
3 Results and discussion
3.1 Structures and electronic properties of Mg2Si1−xPbx (0 ≤ x ≤ 1)
Previous study has shown that for good performance of a thermoelectric material, its bandgap should be in the range from 0.1 eV to 1 eV. Therefore, we need to investigate the composition range in which the bandgap can fulfil that condition.Three Mg2Si1−xPbx structures (x = 0.25, 0.5, 0.75) were built based on Mg2Si conventional unit cell. In order to keep the ratio between Mg and Si/Pb constant, assuming that Pb can only substitute the site of Si and no interstitial. Since the symmetry of Mg2Si is very high (Fm![[3 with combining macron]](https://www.rsc.org/images/entities/char_0033_0304.gif) m) and all the Si atoms are symmetrically equivalent (with the same Wyckoff position 4a), we randomly chose the substitution sites at each specific composition. Some composition may have two or more different structures, such as Mg2Si0.5Pb0.5, in this case, we selected the structure with the highest symmetry. We have optimized Mg2Si, Mg2Pb, and three constructed Mg2Si1−xPbx structures very carefully at 0 K. Lattice parameters agree well with those reported before.43,44 Mg2Si and these three constructed Mg2Si1−xPbx structures are shown in Fig. 1.
m) and all the Si atoms are symmetrically equivalent (with the same Wyckoff position 4a), we randomly chose the substitution sites at each specific composition. Some composition may have two or more different structures, such as Mg2Si0.5Pb0.5, in this case, we selected the structure with the highest symmetry. We have optimized Mg2Si, Mg2Pb, and three constructed Mg2Si1−xPbx structures very carefully at 0 K. Lattice parameters agree well with those reported before.43,44 Mg2Si and these three constructed Mg2Si1−xPbx structures are shown in Fig. 1.
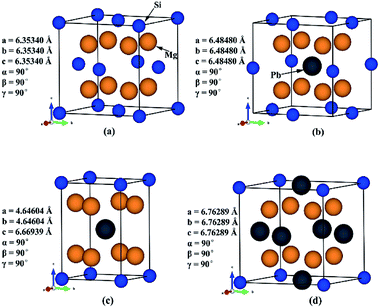 | ||
| Fig. 1 Crystal structures of (a) Mg2Si; (b) Mg2Si0.75Pb0.25; (c) Mg2Si0.5Pb0.5; (d) Mg2Si0.25Pb0.75. | ||
Band structures of these Mg2Si1−xPbx structures were calculated using the hybrid functional HSE06. It shows that Mg2Si has a bandgap of 0.66 eV, which is in good agreement with the experimental value 0.77 eV.7 Mg2Si0.75Pb0.25 is a semiconductor with a narrow band gap of 0.08 eV, while the other two structures Mg2Si0.5Pb0.5 and Mg2Si0.25Pb0.75 are metals. Based on present calculations, we suggest that good thermoelectric performance of Mg2Si1−xPbx compounds should be in the range of 0 ≤ x ≤ 0.25. In the following sections, we focus on the investigation of thermoelectric properties of Mg2Si1−xPbx solid solutions with 0 ≤ x ≤ 0.25.
3.2 Two more Mg2Si1−xPbx structures within 0 ≤ x ≤ 0.25
To explore thermoelectric properties of Mg2Si1−xPbx structures (0 ≤ x ≤ 0.25), we constructed two more Mg2Si1−xPbx compositions (Mg64Si31Pb and Mg64Si30Pb2). First we built a 2 × 2 × 2 supercell of Mg2Si with 64 Mg atoms and 32 Si atoms, and then replaced one or two Si atoms with Pb atoms. Note that, in the case of Mg64Si30Pb2, two Pb atoms placed at different distances have been carefully checked. We here use the method used by Bilc et al.45 and Hoang et al.,46 the two Pb atoms were arranged as the first, second, third, fourth and fifth nearest neighbors with Pb–Pb distances in , α,
, α,  ,
,  ,
,  , respectively (α = 6.35340 Å). We have optimized the constructed Mg64Si31Pb and the five different Mg64Si30Pb2 structures. These optimized structures are shown in Fig. 2.
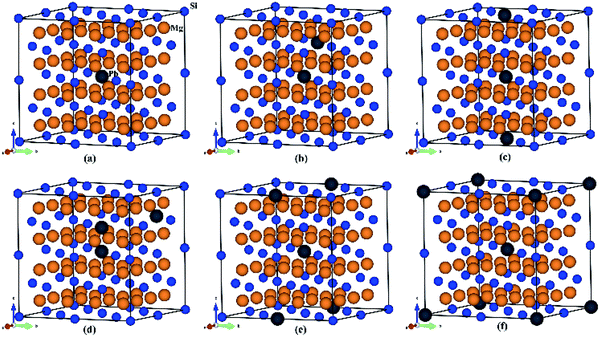 | ||
| Fig. 2 Crystal structures for (a) Mg64Si31Pb; (b)–(f) correspond to the 1st, 2nd, 3rd, 4th, 5th nearest distance impurity pair of Mg64Si30Pb2 structures respectively. | ||
We calculated formation energy Ef of a defect A in a bulk material defined as:47
 | (1) |
Where Etot(A) is the total energy of supercell containing defect A and Etot(bulk) is the total energy of perfect supercell; μi is the chemical potential of atom i (host atoms or impurity atoms) and ni represents the number of atoms of species i that have been added (ni > 0) or removed (ni ≤ 0) to create the defect. What is more, μi is simply fixed to the total energy (per atom) of their standard metallic bulk structures, since the accurate values of the chemical potential are not relevant.
Fig. 3 shows the formation energies of Pb impurity pairs in Mg2Si as a function of pair distance. The formation energy of the Pb pair at infinite distance is also given, which can be calculated by adding up the formation energy of an isolated Pb defect. It can be seen that the defect pair formation energies from 1st nearest distance to 5th nearest distance are very similar and the difference is within 0.01 eV, which suggests that all these states can coexist at high temperature, while they are all lower than that of Pb pair at infinite distance. Meanwhile, high positive values of the formation energy of Pb defect suggest that Pb does not tend to dissolve in Mg2Si, which may be beneficial for lowering the lattice thermal conductivity due to scattering by precipitates. Furthermore, we used the structure having 2rd nearest distance Pb pair as representative of Mg64Si30Pb2.
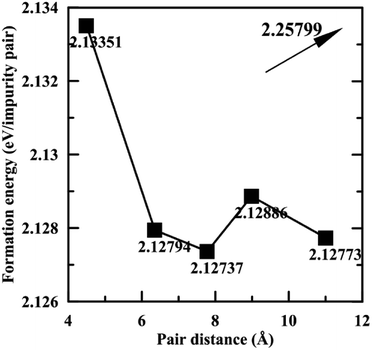 | ||
| Fig. 3 Formation energies of Pb pair in Mg2Si as a function of the pair distance. The value given with the arrow is the formation energy at infinite pair distance. | ||
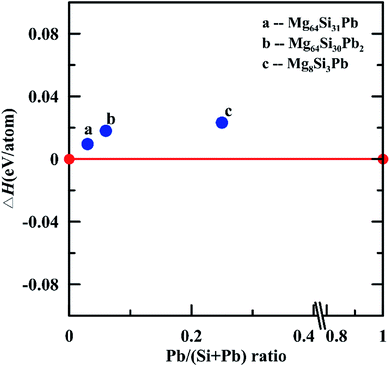
We further investigated thermodynamical stability of these three Mg2Si1−xPbx solid solutions: Mg64Si31Pb, Mg64Si30Pb2 and Mg8Si3Pb. Using Mg2Si and Mg2Pb as references, we calculated their formation enthalpies at 0 K and constructed the thermodynamic convex hull. As shown in Fig. 4, all these three structures possess positive formation enthalpies, indicating that they are metastable structures. However, all these three structures are within thermodynamically synthesize range because of their small positive formation enthalpies (less than 0.03 eV per atom).
3.3 Thermoelectric properties of Mg2Si1−xPbx for 0 ≤ x ≤ 0.25
Band structures are very important for understanding thermoelectric properties. We have calculated band structures of Mg2Si, Mg64Si31Pb, Mg64Si30Pb2 and Mg8Si3Pb using hybrid functional HSE06, as shown in Fig. 5 and S1 (ESI†). For all the four Mg2Si1−xPbx structures, edges of the conduction bands and valence bands are asymmetric, and the conduction band minimum (CBM) and valence band maximum (VBM) occur at the gamma point in the k space. With the increasing of Pb concentration, band gap of Mg2Si1−xPbx decreases.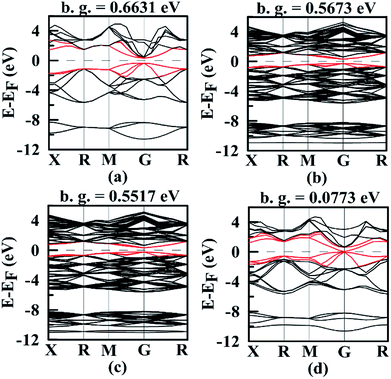 | ||
| Fig. 5 Band structures of (a) Mg2Si; (b) Mg64Si31Pb; (c) Mg64Si30Pb2; (d) Mg8Si3Pb. In each figure, the Fermi level EF was shifted to zero and band gap value is displayed. | ||
We focus on the bands closest to Fermi level because they are important to determine the transport properties. Clearly, the three valence bands' positions in each Mg2Si1−xPbx structures are lifted with the increasing of Pb concentration and their shapes and relative positions are almost unchanged. For the three conduction bands in each Mg2Si1−xPbx structures, their situations are totally different (see Fig. S1, ESI†). In Mg2Si, these three conduction bands separate at gamma point, and the second lowest band and the third lowest band lie above the CBM by ∼8 meV and ∼22 meV. As Pb concentration increases, the interaction between impurity states and host conduction-band states causes the above two bands to degenerate and the splitting between the CBM and those two bands is 5 meV, 10 meV and 576 meV, respectively, for Mg64Si31Pb, Mg64Si30Pb2 and Mg8Si3Pb. Thus, by changing Pb concentration, it will not only lower the band gap but also change the distribution of the energy bands near the band-gap region.
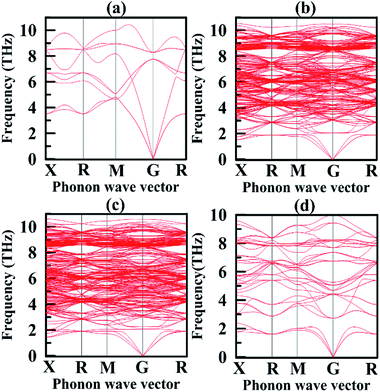
We also calculated phonon dispersion curves for Mg2Si, Mg64Si31Pb, Mg64Si30Pb2 and Mg8Si3Pb. In this way, we confirmed their dynamical stability. As shown in Fig. 6, phonon dispersion curves of Mg2Si, Mg64Si31Pb, Mg64Si30Pb2, and Mg8Si3Pb have no imaginary frequencies. Being different from the phonon dispersion curves of Mg2Si, the curves of Mg64Si31Pb, Mg64Si30Pb2 and Mg8Si3Pb exhibit gaps between the longitudinal acoustic (LA) and transverse optic (TO) phonon branches. Usually, the low-frequency region of phonon dispersion curves is dominated by heavy atoms. When Pb is introduced into Mg2Si structure, three acoustic branches are lowered relative to those of Mg2Si, which may suggest stronger anharmonicity.
We calculated thermoelectric properties for these four Mg2Si1−xPbx structures including electron relaxation time τ, Seebeck coefficient α, electrical conductivity σ, thermal conductivity κ and figure of merit ZT. One important thing to mention is that is for α, σ and κe, which were calculated by BoltzTrap, we selected the values with chemical potential near the conduction band minimum, since it is known that Mg2Si and its solid solutions usually are n-type thermoelectric materials.
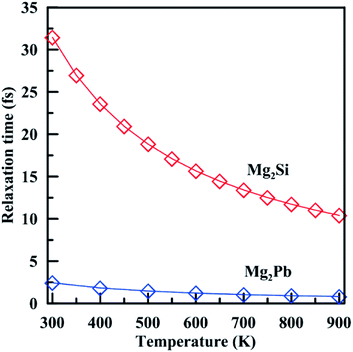
Note that in most works, in order to get the absolute electrical conductivity calculated by BoltzTrap, electron relaxation time is either assumed to be constant or calculated by an empirical formula deduced from experimental values.52 In this work, we find an effective non-empirical method49,50 to calculate the electron relaxation time at different temperatures. This method may tend to overestimate the relaxation time at high temperatures because it only considers harmonic effects. A quantitative method to account for anharmonicity is still lacking. Fig. 7 shows temperature-dependent relaxation time of Mg2Si and Mg2Pb. For both materials, relaxation time decreases with temperature, but Mg2Si shows stronger variation than Mg2Pb. The relaxation time of Mg2Si is an order of magnitude higher than that of Mg2Pb in the entire temperature range, suggesting that the electron–phonon interaction is much stronger in Mg2Pb than in Mg2Si.
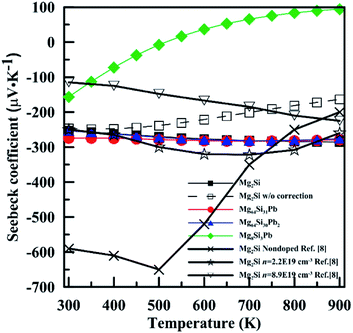
Fig. 8 shows temperature-dependent Seebeck coefficient (α) of these four Mg2Si1−xPbx structures. For Mg2Si, Mg64Si31Pb and Mg64Si30Pb2, Seebeck coefficients are all negative over the whole calculated temperature range and have similar values and tendency with temperature. In contrast, for Mg8Si3Pb, it shows a transition from n-type to p-type near 550 K. Our calculations are in fair agreement with the experimental results whose carrier concentrations range from 1 × 1019 cm−3 to 1 × 1020 cm−3, while have a discrepancy with nondoped Mg2Si. The main reason for such a result is that we chose the values with chemical potential near the conduction band minimum, and the electron concentration near conduction band minimum is 1 × 1019 cm−3 ∼ 1 × 1020 cm−3 (this information can be read from the results of BoltzTrap calculation). Besides, the band gap we used in order to correct the results of GGA-PBE also has an evident influence on the results of transport coefficients. As can be seen in Fig. 8, we also show the results of Mg2Si without band gap correction. There is clear difference induced by the correction, especially in the high temperature range.
Note that the electrical conductivity and electronic part of thermal conductivity calculated by BoltzTrap are in units of the electron relaxation time; they are defined as σ/τ and κe/τ. To get σ and κe for all these four structures, we need the relaxation time of each structure. Calculation of the relaxation time is quite burdensome and time-consuming, especially for a large cell. Since we have obtained τ of Mg2Si and Mg2Pb, We assume that τ has a linear dependence with composition x,
| τ(Mg2Si1−xPbx) = (1 − x)τ(Mg2Si) + xτ(Mg2Pb) | (2) |
In practice, τ decreases more than linearly with composition x, and the calculated σ and κe can be used as upper bounds.
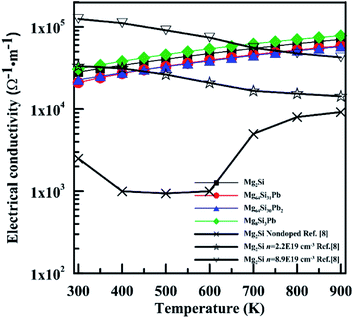
Fig. 9 shows the electrical conductivity (σ) of these four Mg2Si1−xPbx structures as a function of temperature. σ of Mg2Si matches well with those experimental results which have high electron concentration. Besides the reasons laid out in the discussion of the Seebeck coefficient, the relaxation time τ also has a great influence on the results of σ and κe. We can see these four structures have similar electrical conductivity, due to the similar carrier concentration near conduction band minimum.
Fig. 10 shows the temperature dependence of the total thermal conductivity (κ = κe + κL) and lattice thermal conductivity (κL) of these four Mg2Si1−xPbx structures. κL of Mg2Si obtained from our calculation matches well with the experiment value. For all four Mg2PbxSi1−x structures, κL is proportional to T−1, indicating phonon–phonon scattering as the key mechanism of thermal resistance. The introduction of Pb significantly lowers the lattice thermal conductivity of Mg2Si: κL of Mg2Si is 12.14 W m−1 K−1 at 300 K, while it is 4.18 W m−1 K−1, 2.41 W m−1 K−1, 3.76 W m−1 K−1 for Mg64Si31Pb, Mg64Si30Pb2 and Mg8Si3Pb, respectively. This can be understood from the following two aspects: (1) introduction of Pb creates a large mass contrast throughout the crystal lattice, which will enhance phonon scattering and lead to a significant decrease of thermal conductivity; (2) according to the formula51 used for evaluating κL:
 | (3) |
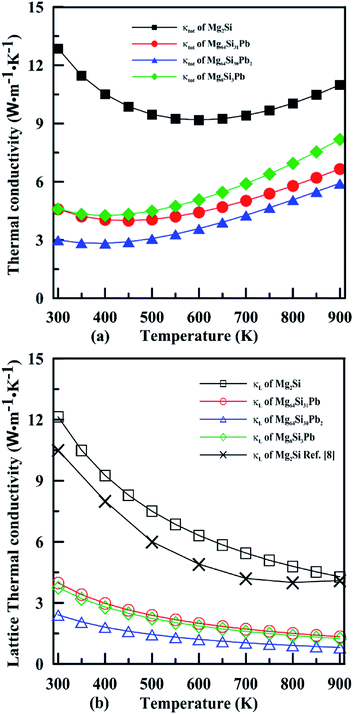 | ||
| Fig. 10 Temperature dependence of the total thermal conductivity (a) and lattice thermal conductivity (b) for n-type Mg2Si1−xPbx solid solutions. | ||
| Compound | 300 K | 350 K | 400 K | 450 K | 500 K | 550 K | 600K | 650 K | 700 K | 750 K | 800 K | 850 K |
|---|---|---|---|---|---|---|---|---|---|---|---|---|
| Mg2Si | 1.226 | 1.230 | 1.232 | 1.234 | 1.235 | 1.236 | 1.237 | 1.237 | 1.238 | 1.238 | 1.238 | 1.238 |
| Mg64Si31Pb | 1.255 | 1.259 | 1.261 | 1.263 | 1.264 | 1.265 | 1.266 | 1.267 | 1.267 | 1.267 | 1.268 | 1.268 |
| Mg64Si30Pb2 | 1.268 | 1.272 | 1.275 | 1.276 | 1.278 | 1.279 | 1.279 | 1.280 | 1.280 | 1.281 | 1.281 | 1.281 |
| Mg8Si3Pb | 1.365 | 1.368 | 1.370 | 1.371 | 1.372 | 1.372 | 1.373 | 1.373 | 1.374 | 1.374 | 1.374 | 1.374 |
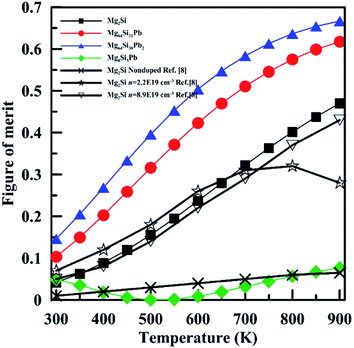
Fig. 11 shows the temperature dependence of the figure of merit (ZT) of Pb-doped Mg2Si compared with that of pristine Mg2Si. It is obvious that ZT of Mg64Si31Pb and Mg64Si30Pb2 are improved compared with that of Mg2Si, mainly due to the reduction of lattice thermal conductivity. The maximum ZT value of ∼0.67 is found at 900 K for Mg64Si30Pb2. In contrast, to Mg8Si3Pb, its ZT first decreases, then increases after 550 K, similar to what we saw for Seebeck coefficient.
4 Conclusions
First-principles calculations combined with Boltzmann transport equation were used to study Mg2Si1−xPbx solid solutions. The analysis of band structure features has shown that the composition x should be in the range of 0 ≤ x ≤ 0.25 in order to be potential thermoelectric materials. Furthermore, four structures including Mg2Si, Mg64Si31Pb, Mg64Si30Pb2 and Mg8Si3Pb were studied in detail. Their band structures show that Pb impurities mainly influence the conduction bands near the Fermi level. As the Pb concentration increases, low-lying conduction band splits and goes towards the Fermi level. Then transport properties including electron relaxation time τ, Seebeck coefficient α, electrical conductivity σ, lattice thermal conductivity κL and thermoelectric figure of merit ZT were calculated between 300 K and 900 K. The computed τ indicates that the electron-phonon interaction is much stronger in Mg2Pb than in Mg2Si. Computed α and σ are close to experimental values with proper electron concentration, and κL matches well with experimental values. As for ZT, it shows that doping Pb can improve the ZT compared with that of Mg2Si. Mg64Si30Pb2 shows a maximum value of ZT = 0.67 at 900 K. The ZT value itself is not impressive, but it opens a way to optimize the thermoelectric properties of Mg2Si. Our calculation shows that, it is the reduction of lattice thermal conductivity that mainly improves thermoelectric performance and it can still be improved by optimising the concentration of Pb. Most importantly, this work shows that fully ab initio calculations of thermoelectric properties are possible, and provide accurate results.Conflicts of interest
There are no conflicts of interest to declare.Acknowledgements
We thank the Natural Science Foundation of China (No. 51672218 and 51632007), the Foreign Talents Introduction and Academic Exchange Program of China (No. B08040), and Russian Science Federation (Grant No. 16-13-104S9). The authors also acknowledge the High Performance Computing Center of NWPU for allocation of computing time on their machines.Notes and references
- D. M. Rowe, Thermoelectrics handbook: macro to nano, CRC press, 2005 Search PubMed.
- H. J. Goldsmid, Introduction to thermoelectricity, Springer Science & Business Media, 2009 Search PubMed.
- M. Fedorov, J. Thermoelectr., 2009, 2, 51–60 Search PubMed.
- M. I. Fedorov and G. N. Isachenko, J. Appl. Phys., 2015, 54, 07JA05 CrossRef.
- A. Nozariasb, A. Agarwal, Z. A. Coutant, M. J. Hall, J. Liu, R. Liu, A. Malhotra, P. Norouzzadeh, M. C. Özturk, V. P. Ramesh, Y. Sargolzaeaval, F. Suarez and D. Vashaee, J. Appl. Phys., 2017, 56, 05DA04 CrossRef.
- M. B. A. Bashir, S. Mohd Said, M. F. M. Sabri, D. A. Shnawah and M. H. Elsheikh, Renewable Sustainable Energy Rev., 2014, 37, 569–584 CrossRef CAS.
- V. Zaitsev, M. Fedorov, E. Gurieva, I. Eremin, P. Konstantinov, A. Y. Samunin and M. Vedernikov, Proc. of 24th International Conference on Thermoelectrics (ICT 2005), Clemson, USA, 2005 Search PubMed.
- J.-i. Tani and H. Kido, Physica B, 2005, 364, 218–224 CrossRef CAS.
- J.-i. Tani and H. Kido, Intermetallics, 2007, 15, 1202–1207 CrossRef CAS.
- J.-i. Tani and H. Kido, J. Alloys Compd., 2008, 466, 335–340 CrossRef CAS.
- J.-Y. Jung and I.-H. Kim, J. Electron. Mater., 2011, 40, 1144–1149 CrossRef CAS.
- Q. S. Meng, W. H. Fan, R. X. Chen and Z. A. Munir, J. Alloys Compd., 2011, 509, 7922–7926 CrossRef CAS.
- D. Cederkrantz, N. Farahi, K. A. Borup, B. B. Iversen, M. Nygren and A. E. C. Palmqvist, J. Appl. Phys., 2012, 111, 023701 CrossRef.
- N. Satyala and D. Vashaee, Appl. Phys. Lett., 2012, 100, 073107 CrossRef.
- J.-H. Bahk, Z. Bian and A. Shakouri, Phys. Rev. B, 2014, 89, 075204 CrossRef.
- J.-H. Bahk, Z. Bian and A. Shakouri, Phys. Rev. B, 2013, 87, 075204 CrossRef.
- Y. Pei, H. Wang and G. Snyder, Adv. Mater., 2012, 24, 6125–6135 CrossRef CAS PubMed.
- H. Zhu, W. Sun, R. Armiento, P. Lazic and G. Ceder, Appl. Phys. Lett., 2014, 104, 082107 CrossRef.
- J. P. Heremans, B. Wiendlocha and A. M. Chamoire, Energy Environ. Sci., 2012, 5, 5510–5530 CAS.
- Y. Pei, X. Shi, A. LaLonde, H. Wang, L. Chen and G. J. Snyder, Nature, 2011, 473, 66–69 CrossRef CAS PubMed.
- W. Liu, X. Tan, K. Yin, H. Liu, X. Tang, J. Shi, Q. Zhang and C. Uher, Phys. Rev. Lett., 2012, 108, 166601 CrossRef PubMed.
- D. Pshenay-Severin and M. Fedorov, Proc. of 25th International Conference on Thermoelectrics (ICT 2006), Vienna, Austria, 6-10 Aug, 2006 Search PubMed.
- G. Jiang, L. Chen, J. He, H. Gao, Z. Du, X. Zhao, T. M. Tritt and T. Zhu, Intermetallics, 2013, 32, 312–317 CrossRef CAS.
- W. Liu, H. S. Kim, S. Chen, Q. Jie, B. Lv, M. Yao, Z. Ren, C. P. Opeil, S. Wilson, C.-W. Chu and Z. Ren, Proc. Natl. Acad. Sci., 2015, 112, 3269–3274 CrossRef CAS PubMed.
- Y. Noda, H. Kon, Y. Furukawa, N. Otsuka, I. A. Nishida and K. Masumoto, Mater. Trans., JIM, 1992, 33, 845–850 CrossRef CAS.
- H. Ihou-Mouko, C. Mercier, J. Tobola, G. Pont and H. Scherrer, J. Alloys Compd., 2011, 509, 6503–6508 CrossRef CAS.
- J. Mao, H. S. Kim, J. Shuai, Z. Liu, R. He, U. Saparamadu, F. Tian, W. Liu and Z. Ren, Acta Mater., 2016, 103, 633–642 CrossRef CAS.
- S. Muthiah, J. Pulikkotil, A. Srivastava, A. Kumar, B. Pathak, A. Dhar and R. Budhani, Appl. Phys. Lett., 2013, 103, 053901 CrossRef.
- G. Kresse and D. Joubert, Phys. Rev. B, 1999, 59, 1758–1775 CrossRef CAS.
- G. Kresse and J. Furthmüller, Phys. Rev. B, 1996, 54, 11169–11186 CrossRef CAS.
- G. Kresse and J. Furthmüller, Comput. Mater. Sci., 1996, 6, 15–50 CrossRef CAS.
- J. P. Perdew, K. Burke and M. Ernzerhof, Phys. Rev. Lett., 1996, 77, 3865–3868 CrossRef CAS PubMed.
- H. J. Monkhorst and J. D. Pack, Phys. Rev. B, 1976, 13, 5188–5192 CrossRef.
- J. Heyd and G. E. Scuseria, J. Chem. Phys., 2003, 118, 8207–8215 CrossRef CAS.
- K. Esfarjani and H. T. Stokes, Phys. Rev. B, 2008, 77, 144112 CrossRef.
- A. Togo, F. Oba and I. Tanaka, Phys. Rev. B, 2008, 78, 134106 CrossRef.
- G. K. Madsen and D. J. Singh, Comput. Phys. Commun., 2006, 175, 67–71 CrossRef CAS.
- W. Li, L. Lindsay, D. A. Broido, D. A. Stewart and N. Mingo, Phys. Rev. B, 2012, 86, 174307 CrossRef.
- W. Li, J. Carrete, N. A. Katcho and N. Mingo, Comput. Phys. Commun., 2014, 185, 1747–1758 CrossRef CAS.
- G. Paolo, B. Stefano, B. Nicola, C. Matteo, C. Roberto, C. Carlo, C. Davide, L. C. Guido, C. Matteo, D. Ismaila, C. Andrea Dal, G. Stefano de, F. Stefano, F. Guido, G. Ralph, G. Uwe, G. Christos, K. Anton, L. Michele, M.-S. Layla, M. Nicola, M. Francesco, M. Riccardo, P. Stefano, P. Alfredo, P. Lorenzo, S. Carlo, S. Sandro, S. Gabriele, P. S. Ari, S. Alexander, U. Paolo and M. W. Renata, J. Phys.: Condens. Matter, 2009, 21, 395502 CrossRef PubMed.
- J. Noffsinger, F. Giustino, B. D. Malone, C.-H. Park, S. G. Louie and M. L. Cohen, Comput. Phys. Commun., 2010, 181, 2140–2148 CrossRef CAS.
- S. Baroni, S. de Gironcoli, A. Dal Corso and P. Giannozzi, Rev. Mod. Phys., 2001, 73, 515–562 CrossRef CAS.
- J. Bourgeois, J. Tobola, B. Wiendlocha, L. Chaput, P. Zwolenski, D. Berthebaud, F. Gascoin, Q. Recour and H. Scherrer, Funct. Mater. Lett., 2013, 6, 1340005 CrossRef.
- K. Kutorasinski, B. Wiendlocha, J. Tobola and S. Kaprzyk, Phys. Rev. B, 2014, 89, 115205 CrossRef.
- D. Bilc, S. D. Mahanti, E. Quarez, K.-F. Hsu, R. Pcionek and M. G. Kanatzidis, Phys. Rev. Lett., 2004, 93, 146403 CrossRef PubMed.
- K. Hoang, S. D. Mahanti and M. G. Kanatzidis, Phys. Rev. B, 2010, 81, 115106 CrossRef.
- C. G. Van de Walle and J. Neugebauer, J. Appl. Phys., 2004, 95, 3851–3879 CrossRef CAS.
- G. Kresse, M. Marsman and J. Furthmüller, Si bandstructure, http://cms.mpi.univie.ac.at/wiki/index.php/Si_bandstructure, (accessed 7 Oct, 2017) Search PubMed.
- M. Bernardi, D. Vigil-Fowler, C. S. Ong, J. B. Neaton and S. G. Louie, Proc. Natl. Acad. Sci., 2015, 112, 5291–5296 CrossRef CAS PubMed.
- S. Poncé, R. Margine, C. Verdi and F. Giustino, B-doped diamond, http://epw.org.uk/Documentation/B-dopedDiamond, (accessed 7 Oct, 2017) Search PubMed.
- W. G. Zeier, A. Zevalkink, Z. M. Gibbs, G. Hautier, M. G. Kanatzidis and G. J. Snyder, Angew. Chem., Int. Ed., 2016, 55, 6826–6841 CrossRef CAS PubMed.
- J. Sun and D. J. Singh, Phys. Rev. Appl., 2016, 5, 024006 CrossRef.
- J.-J. Wang, A. Hermann, X.-Y. Kuang, Y.-Y. Jin, C. Lu, C.-Z. Zhang, M. Ju, M.-T. Si and T. Iitaka, RSC Adv., 2015, 5, 53497–53503 RSC.
Footnote |
| † Electronic supplementary information (ESI) available. See DOI: 10.1039/c8ra02436g |
| This journal is © The Royal Society of Chemistry 2018 |

