 Open Access Article
A novel microporous Tb-MOF fluorescent sensor for highly selective and sensitive detection of picric acid†
Ping Ju‡
 a,
Ensheng Zhang‡
 *a,
Long Jiangb,
Ze Zhanga,
Xiangyang Houa,
Yuqi Zhang
 a,
Hua Yanga and
Jijiang Wang
 *a
*a
aLaboratory of New Energy & New Function Materials, Shaanxi Key Laboratory of Chemical Reaction Engineering, College of Chemistry and Chemical Engineering, Yan'an University, Yan'an, Shaanxi 716000, P. R. China. E-mail: sdzes2006@163.com; yadxwjj@126.com
bMOE Key Laboratory of Bioinorganic and Synthetic Chemistry, School of Chemistry and Chemical Engineering, Sun Yat-Sen University, Guangzhou 510275, P. R. China
First published on 13th June 2018
Abstract
A new three-dimensional metal–organic framework (MOF) sensor with molecular formula (C2H6NH2)2[Tb2(ptptc)2(DMF)(H2O)]·DMF·6H2O (complex 1) has been constructed from terphenyl-3,3′,5,5′-tetracarboxylic acid (H4ptptc) and terbium nitrate under solvothermal conditions. The structure of complex 1 was characterized by single-crystal X-ray diffraction analysis (XRD), elemental analysis, IR spectroscopy and thermogravimetric (TG) analysis, and the purity was further confirmed by powder X-ray diffraction (PXRD) analysis. XRD analysis reveals that complex 1 crystallizes in a triclinic system P![[1 with combining macron]](https://www.rsc.org/images/entities/char_0031_0304.gif) space group and consists of a three-dimensional anionic network which has one-dimensional channels. Fluorescence titration experiments showed that complex 1 displayed real-time, highly selective and sensitive fluorescence quenching behavior towards picric acid with a nanomolar scale experimental detection limit (100 nM). Recycling titration experiments suggested that the as-synthesized probe has good reversibility and can be used for at least five cycles in fluorescence titration experiments without obvious fluorescence intensity reduction or framework structure destruction. Furthermore, the high selectivity and sensitivity as well as good recyclability of complex 1 make it a potential fluorescent sensor for picric acid.
space group and consists of a three-dimensional anionic network which has one-dimensional channels. Fluorescence titration experiments showed that complex 1 displayed real-time, highly selective and sensitive fluorescence quenching behavior towards picric acid with a nanomolar scale experimental detection limit (100 nM). Recycling titration experiments suggested that the as-synthesized probe has good reversibility and can be used for at least five cycles in fluorescence titration experiments without obvious fluorescence intensity reduction or framework structure destruction. Furthermore, the high selectivity and sensitivity as well as good recyclability of complex 1 make it a potential fluorescent sensor for picric acid.
1 Introduction
Picric acid (PA) is one of the most well-known explosives with high explosive detonation properties and a low safety coefficient. As an important crude substance, PA has been widely used in the manufacture of commodities such as rocket fuels,1 fireworks,2 matches,3 dyes,4 medicines and pesticides.5 However, due to its strong explosive capacity, PA could also be used for military applications and terrorist attacks. The heavy use of PA has caused severe problems such as catastrophic environmental pollution,6 public health issues7 and homeland security problems. Hence, rapid detection of PA is attracting increasing attention.8In the past few decades, various sophisticated methods such as high performance liquid chromatography (HPLC),9 Raman spectroscopy10 and ion-mobility spectroscopy (IMS),11 etc. have been established for the detection of nitrogen containing aromatic explosives including picric acid. Although significant progresses have been made for the above mentioned analytical techniques some drawbacks such as high cost, less selectivity and not real-time monitoring limit their practical applications. Luckily, fluorescence sensors have emerged as promising analytic tools for the detection of picric acid in the past few years, for example, various functional small organic molecules,12 metal or nonmetal nanoparticles,13 luminescent quantum dots14 were designed for PA detection. It is worth mention that luminescent metal–organic frameworks (MOFs) have emerged as promising chemosensors for PA detection in the past few years, and the design, synthesis and application study of luminescent MOFs sensors has drawn great attentions.15 Despite significant progresses have been made in the development of fluorescent luminescent MOFs sensor for picric acid there is still scope for improvement, especially, the recyclable real-time fluorescence sensors with high selectivity and sensitivity are still high desirable.
In this work, we report a new three-dimensional (3D) metal–organic framework sensor with the molecular formula (C2H6NH2)2[Tb2(ptptc)2(DMF)(H2O)]·DMF·6H2O (complex 1) for highly selective and sensitive detection of PA. Complex 1 was constructed with terphenyl-3,3′,5,5′-tetracarboxylic acid (H4ptptc) and terbium nitrate under solvothermal conditions and characterized by XRD, elemental analysis, IR spectra, TG analysis. This 3D framework containing one-dimensional (1D) channels along a and b axis, which are expected to facile the diffusion and concentration of analytes and the host–guest interactions. Instant fluorescent responds were detected when complex 1 was treated with PA and a nanomolar scale experimental detection limit (100 nM) was observed in the fluorescent titration experiments. According to the PXRD and fluorescent analysis for complex 1 after five cycles in fluorescence titration experiments, no obvious fluorescent intensity reducing or framework structure destruction was observed, which suggested the good recyclability of complex 1. Noticeable features of this probe include: (1) recyclable and real-time sensor for PA detection; (2) high sensitivity and selectivity for PA detection; (3) potential fluorescent sensor for detection PA in water or solid state.
2 Experimental
2.1 Reagents and instruments
The ligand (H4ptptc) and all the reagents were commercially available and used without further purification. Elemental analyses for C, H and N were carried out with a Vario EL elemental analyzer. The IR spectra were recorded on a Shimadzu IR Affinity-1S FTIR Spectrophotometer using the KBr pellet. The thermogravimetric analyses (TGA) were performed on a Netzsch TG-209 Thermogravimetry Analyzer in N2 atmosphere. The Powder X-ray diffraction (PXRD) patterns were measured with a Bruker D8 ADVANCE X-Ray Diffractometer. Photoluminescence spectra were performed on an Agilent Cary Eclipse fluorescence spectrophotometer at room temperature. The luminescent lifetime study of the compound was carried out on an Edinburgh fluorescence spectrophotometer (Edinburgh Instruments FLS920)2.2 Structure determination
The single-crystal data of 1 was collected on Bruker D8 Venture system, with Mo Kα radiation (λ = 0.71073 Å) at 150 K. All empirical absorption corrections were applied using the SCALE3 ABSPACK program.16 The structure was solved by direct methods and refined by full-matrix least-squares analysis on F2 using the SHELX97 program package. All non-hydrogen atoms were refined anisotropically. The electron density of Me2NH2+, DMF and H2O molecules in 1 were treated as a diffuse contribution using the program SQUEEZE.17 The hydrogen atoms were relocated in geometrically sensible positions after each refinement cycle and given thermal parameters defined by those applying to the atom to which they are attached. The C57 atom of lattice DMF molecule exhibits orientational disorder over two sets of positions (C57 and C57′) which lead to the low distance between H46A and H57A. All calculations were performed using the SHELXTL system of computer programs.18 Crystallographic data and structure refinements for complex 1 were displayed in Table 1. The selected bond lengths and bond angles were summarized in Table 1S.† CCDC reference number of crystal 1 is 1828358.| a R1 = Σ||Fo| − |Fc||/Σ|Fo|.b wR2 = [Σ[w(Fo2 − Fc2)2]/Σw(Fo2)2]1/2, where w = 1/[σ2(Fo)2 + (aP)2 + bP] and P = (Fo2 + 2Fc2)/3. | |
|---|---|
| Compound reference | 1 |
| Formula | C54H64N4O25Tb2 |
| Fw | 1486.93 |
| Crystal system | Triclinic |
| Space group | P![[1 with combining macron]](https://www.rsc.org/images/entities/char_0031_0304.gif) |
| a (Å) | 10.8814(6) |
| b (Å) | 16.0497(11) |
| c (Å) | 19.4459(13) |
| α (°) | 74.097(4) |
| β (°) | 74.566(3) |
| γ (°) | 72.105(3) |
| V (Å3) | 3046.1(3) |
| Z | 2 |
| Dc (g cm−3) | 1.621 |
| Reflections/Unique | 11![[thin space (1/6-em)]](https://www.rsc.org/images/entities/char_2009.gif) 171/7610 171/7610 |
| R(int) | 0.1151 |
| GOF on F2 | 1.046 |
| aR1[I ≥ 2σ(I)] | 0.0655 |
| bwR2[I ≥ 2σ(I)] | 0.1597 |
2.3 Synthesis of (C2H6NH2)2[Tb2(ptptc)2(DMF)(H2O)]·DMF·6H2O (1)
Tb(NO3)3·6H2O (8.7 mg, 0.02 mmol), H4ptptc (4 mg, 0.01 mmol) and HNO3 (6 M, 3 d) were added to a 25 mL Teflon-lined stainless steel vessel. A 1![[thin space (1/6-em)]](https://www.rsc.org/images/entities/char_2009.gif) :
:![[thin space (1/6-em)]](https://www.rsc.org/images/entities/char_2009.gif) 1 (v/v) mixture of DMF (4 mL) and H2O (4 mL) was added to the mixture. The content was heated at 160 °C for 72 h. The colorless block-like crystals were obtained and washed with DMF, then dried in air (63% yield based on Tb). Anal. calcd for C54H64N4O25Tb2 (%): C, 43.64; H, 4.31; N, 3.77. Found (%): C, 43.21; H, 4.02; N, 3.98.
1 (v/v) mixture of DMF (4 mL) and H2O (4 mL) was added to the mixture. The content was heated at 160 °C for 72 h. The colorless block-like crystals were obtained and washed with DMF, then dried in air (63% yield based on Tb). Anal. calcd for C54H64N4O25Tb2 (%): C, 43.64; H, 4.31; N, 3.77. Found (%): C, 43.21; H, 4.02; N, 3.98.
2.4 Luminescence sensing experiments
3 Results and discussion
3.1 Crystal structure description of complex 1
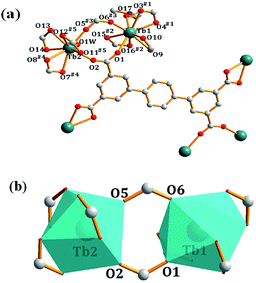
Single-crystal X-ray diffraction analysis reveals that complex 1 crystallizes in a triclinic system P![[1 with combining macron]](https://www.rsc.org/images/entities/char_0031_0304.gif) space group. As shown in Fig. 1a, each asymmetric unit of 1 contains two Tb3+ ions, two ptptc4− ligands, one coordinated DMF, one coordinated water molecule, two dimethylammonium ions, one lattice DMF molecule and six lattice water molecules. Tb1 is nine-coordinated by six chelating carboxylate oxygen atoms, two bridging carboxylate oxygen atoms and one DMF molecule forming a distorted triangular tetrakaidecahedron geometry, Tb2 presents similar coordination environment to Tb1, while the difference is that it is coordinated by one H2O molecule instead of DMF. The crystallographically independent nine-coordinated Tb1 and Tb2 are connected by a pair of carboxylate bridges to form [Tb2(μ2-COO)2(COO)6]2− dimetallic units, with Tb⋯Tb distance being 5.521 Å (Fig. 1b). The Tb–O bond length is range from 2.268(7) Å to 2.578(7) Å, which are consistent with the reported complexes.19 Individual dimetallic clusters are further connected by ptptc4− ligands to construct a three-dimensional (3D) anionic framework. The anionic framework is balanced by dimethylammonium counterions which were formed in situ in the reaction.20
space group. As shown in Fig. 1a, each asymmetric unit of 1 contains two Tb3+ ions, two ptptc4− ligands, one coordinated DMF, one coordinated water molecule, two dimethylammonium ions, one lattice DMF molecule and six lattice water molecules. Tb1 is nine-coordinated by six chelating carboxylate oxygen atoms, two bridging carboxylate oxygen atoms and one DMF molecule forming a distorted triangular tetrakaidecahedron geometry, Tb2 presents similar coordination environment to Tb1, while the difference is that it is coordinated by one H2O molecule instead of DMF. The crystallographically independent nine-coordinated Tb1 and Tb2 are connected by a pair of carboxylate bridges to form [Tb2(μ2-COO)2(COO)6]2− dimetallic units, with Tb⋯Tb distance being 5.521 Å (Fig. 1b). The Tb–O bond length is range from 2.268(7) Å to 2.578(7) Å, which are consistent with the reported complexes.19 Individual dimetallic clusters are further connected by ptptc4− ligands to construct a three-dimensional (3D) anionic framework. The anionic framework is balanced by dimethylammonium counterions which were formed in situ in the reaction.20
In the crystal structure, ptptc4− ligands have two different coordination modes: the μ6-coordination style which has two bridging bidentate and two chelating bidentate carboxylate groups and the μ4-coordination style which has four chelating bidentate carboxylate groups. As shown in Fig. 2a, each [Tb2(μ2-COO)2(COO)6]2− dimetallic unit connected with four μ6-coordination ptptc4− ligands forming a 2D layer structure on ab plane. The μ4-coordination ptptc4− ligands connect the parallel layers upward and downward to form a 3D porous structure with one-dimensional (1D) channels. This 3D framework contains 1D tetragonal channels along a axis with the sizes of 8.0 Å × 8.0 Å (Fig. 2b) and two kind of 1D channels in b axis with the sizes of 8.3 Å × 10.0 Å (rectangular channel) and 9.0 Å × 11.0 Å (rhomboid channel), respectively (Fig. 2c). Counterionic dimethylammonium, coordinated molecules and lattice solvent molecules are filled in these channels, and 35% solvent-accessible volume was estimated by using the PLATON program.21
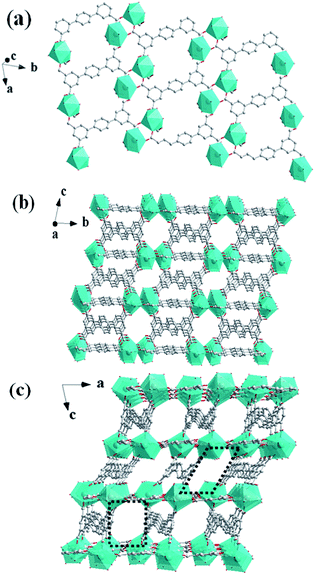 | ||
| Fig. 2 (a) The 2D layer structure of 1 along the ab plane. (b) The 3D framework of 1 along the bc plane. (c) The 3D framework of 1 with 1D channels along the ac plane. | ||
3.2 PXRD, IR and TG analyses
3.3 Solid-state photoluminescent spectra
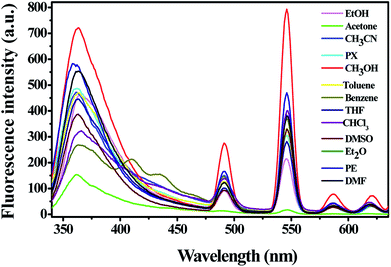
The solid-state fluorescence spectra of complex 1 and H4ptptc were recorded on an Agilent Cary Eclipse fluorescence spectrophotometer with excitation at 325 nm at room temperature (slits: 5 nm/10 nm). As depicted in Fig. 3, the ligand displays a broad band emission range from 350 nm to 500 nm, which centered at about 419 nm. This emission could be assigned to the intra-ligand π–π* transitions.22 Compound 1 exhibits a similar broad band emission with a lager blue-shift compared with H4ptptc and maximum at 363 nm (λex = 325 nm), which may be attributed to the complexation effect between H4ptptc and Tb3+. It is worth mentioning that the emission spectra of compound exhibits typical Tb red emissions and four well-resolved peaks were observed, which are centered at 491 nm, 546 nm, 586 nm and 621 nm, respectively. The characteristic emissions could be attributed to the corresponding transitions from 5D4 → 7F6, 5D4 → 7F5, 5D4 → 7F4 and 5D4 → 7F3 of Tb.23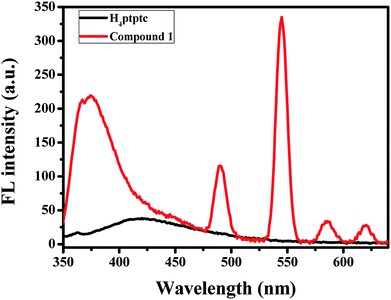 | ||
| Fig. 3 Solid-state photoluminescent spectra of compound 1 and H4ptptc at room temperature (λex = 325 nm). | ||
3.4 Fluorescence sensing properties of complex 1
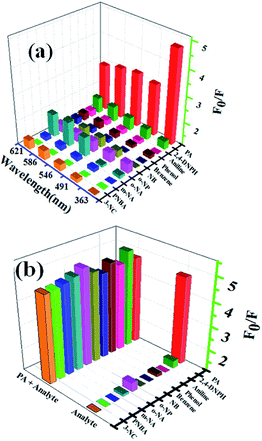
The fluorescent intensity of 1-methanol suspensions with 50 μM PA in the absence and presence of different aromatics (50 μM) were recorded and displayed in Fig. 5b (emission centered at 363 nm). It is obviously that no significant change of the fluorescence intensity for 1-methanol suspensions was observed in the presence of other analytes, which indicated that the selectivity of complex 1 toward PA over other competitive analytes is remarkably high.
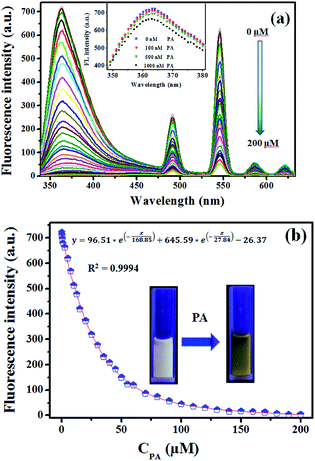
The titration measurements were performed by incremental addition of 1 mM or 10 mM PA stock solutions into the methanol suspension of complex 1. As shown in Fig. 6a, with increasing the concentration of PA (0.1–200 μM) the fluorescent intensity of 1-methanol suspensions steadily decreased (area enlarged view in Fig. 4S†). In order to further investigate the fluorescent titration effect of PA, the spectral intensity emitted by π–π* electron transition of ptptc4− located at 363 nm was monitored. It is delight to notice that remarkable quench effect was observed and the quenching efficiency is about 99.45% which was calculated by using the equation (1 − F/F0) × 100% (F0 is the initial fluorescence intensity of 1-methanol suspensions and F is the fluorescence intensity after addition of 200 μM PA).24 It is worth mentioning that noticeable fluorescence quenching was already observed when 1-methanol suspension was treated with 100 nM PA, which revealed that the high sensitivity of complex 1 for PA (Fig. 6a, inset). Nonlinear fitting analysis for the fluorescence intensity of 1-methanol suspensions versus the concentration of PA (λex = 325 nm, λem = 363 nm, slits: 5 nm/10 nm) was obtained and displayed in Fig. 6b. As depicted in Fig. 6b, the experimental data fitted well with the following non-linear equation:25
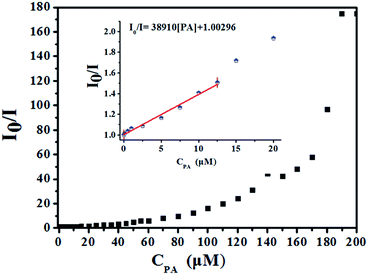
High fluorescence quenching efficiency was also proved by the high Stern–Volmer binding constant (Ksv = 38![[thin space (1/6-em)]](https://www.rsc.org/images/entities/char_2009.gif) 910), which was obtained by a steady-state fluorescence measurement.26 As shown in Fig. 7 inset, good linearity of the plot at low concentrations of PA was observed which was fitted well with the Stern–Volmer equation: I0/I = 1 + Ksv × [PA] (I0 and I are the fluorescent intensities of 1-methanol suspensions in the absence and presence of PA, respectively; Ksv is the Stern–Volmer binding constant; [PA] is the molar concentration of PA).27 The good linearity of Stern–Volmer plot for PA at low concentrations indicating that there is only one type quenching process either dynamic or static quenching. However, as depicted in Fig. 7, a nonlinear curvature at higher concentrations of PA was obtained, revealing both the dynamic and static quenching is taking place.28
910), which was obtained by a steady-state fluorescence measurement.26 As shown in Fig. 7 inset, good linearity of the plot at low concentrations of PA was observed which was fitted well with the Stern–Volmer equation: I0/I = 1 + Ksv × [PA] (I0 and I are the fluorescent intensities of 1-methanol suspensions in the absence and presence of PA, respectively; Ksv is the Stern–Volmer binding constant; [PA] is the molar concentration of PA).27 The good linearity of Stern–Volmer plot for PA at low concentrations indicating that there is only one type quenching process either dynamic or static quenching. However, as depicted in Fig. 7, a nonlinear curvature at higher concentrations of PA was obtained, revealing both the dynamic and static quenching is taking place.28
3.5 Recyclability study of complex 1
Recyclability is one of the most important parameter to assess the chemosensors practicability.29 In order to reveal the recyclability of the as-synthesis potential sensor (complex 1), the reproducibility study of the fluorescent detection activity was also carried out. Complex 1 was recovered by centrifugation followed by washing with methanol and used in the next cycle. It is shown in Fig. 8a, the fluorescence intensity of complex 1 does not decreased obviously after five cycles of continuously PA titration, which revealed that the as-synthesis MOF-sensor has good recyclability for PA detection. Furthermore, the purity of the recycled powder sample was determined by the powder X-ray diffraction and displayed in Fig. 8b. To our pleasant surprise, the PXRD test of complex 1 after five cycles (the top pattern in Fig. 8b) displayed a similar pattern as before and matched well with the simulated PXRD pattern which was obtained from the single-crystal X-ray diffraction data, but the intensity of peaks are decreased to some extent. All the above tests revealed that complex 1 has good potential for the practical use as a chemosensor for PA detection in terms of recyclability and stability.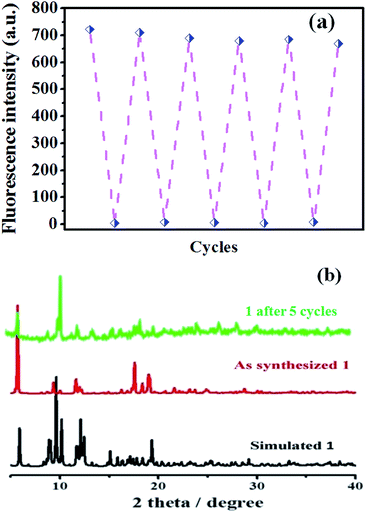 | ||
| Fig. 8 (a) Reusability study of compound 1 for the detection of PA; (b) PXRD patterns of compound 1 before and after PA detection for 5 cycles, compared with the simulated pattern. | ||
3.6 Practical applications
4 Conclusion
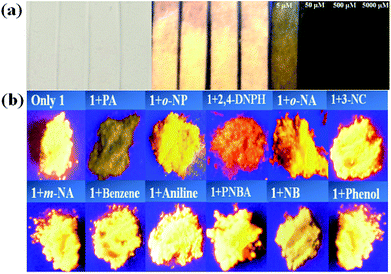
A new strong fluorescent 3D metal–organic framework sensor (complex 1) was successfully designed and synthesized using a highly π-conjugated organic ligand (H4ptptc) and terbium nitrate under solvothermal conditions. The high selectively of complex 1 for PA was proved by steady-state fluorescence titration experiments and the experimental detection limit was found to be 100 nM, which indicating high detection sensitivity. Moreover, high quenching constant (Ksv = 38![[thin space (1/6-em)]](https://www.rsc.org/images/entities/char_2009.gif) 910) and excellent fluorescence quenching efficiency (99.45%) for PA were also observed in the fluorescence titration experiments. The recyclability experiments combine with PXRD tests reveal the good reusability of complex 1 for infield and real-time detection of PA. In addition, practical applications of complex 1 were confirmed by test strips and solid state fluorescence quenching experiments which imply complex 1 was a promising sensor for the practical detection of PA.
910) and excellent fluorescence quenching efficiency (99.45%) for PA were also observed in the fluorescence titration experiments. The recyclability experiments combine with PXRD tests reveal the good reusability of complex 1 for infield and real-time detection of PA. In addition, practical applications of complex 1 were confirmed by test strips and solid state fluorescence quenching experiments which imply complex 1 was a promising sensor for the practical detection of PA.
Conflicts of interest
There are no conflicts to declare.Acknowledgements
This work was supported by Natural Science Foundation of China (21663032), Scientific Research Program Funded by Shaanxi Provincial Education Department (Program No. 17JK0869), Startup Foundation for Doctors and Youth Science Foundation of Yan'an University (YDBK2015-06, YDBY2016-001, YDQ2017-14).References
- J. Shen, J. Zhang, Y. Zuo, L. Wang, X. Sun, J. Li, W. Han and R. He, J. Hazard. Mater., 2009, 163, 1199–1206 CrossRef PubMed.
- V. Bhalla, A. Gupta, M. Kumar, D. S. Rao and S. K. Prasad, ACS Appl. Mater. Interfaces, 2013, 5(3), 672–679 Search PubMed.
- V. Bhalla, S. Kaur, V. Vij and M. Kumar, Inorg. Chem., 2013, 52(9), 4860–4865 CrossRef PubMed.
- E. H. Volwiler, Ind. Eng. Chem., 1926, 18(12), 1336–1337 CrossRef.
- P. G. Thorne and T. F. Jenkins, Field Anal. Chem. Technol., 1997, 1(3), 165–170 CrossRef.
- Y. J. Hu, S. Z. Tan, G. L. Shen and R. Q. Yu, Anal. Chim. Acta, 2006, 570(2), 170–175 CrossRef PubMed.
- B. Roy, A. K. Bar, B. Gole and P. S. Mukherjee, J. Org. Chem., 2013, 78(3), 1306–1310 CrossRef PubMed.
- (a) B. Joarder, A. V. Desai, P. Samanta, S. Mukherjee and S. K. Ghosh, Chem.–Eur. J., 2015, 21(3), 965–969 CrossRef PubMed; (b) K. M. Wang, L. Du, Y. L. Ma and Q. H. Zhao, Inorg. Chem. Commun., 2016, 68, 45–49 CrossRef; (c) Y. Deng, N. Chen, Q. Li, X. Wu, X. Huang, Z. Lin and Y. Zhao, Cryst. Growth Des., 2017, 17(6), 3170–3177 CrossRef; (d) W. Che, G. Li, X. Liu, K. Shao, D. Zhu, Z. Su and M. R. Bryce, Chem. Commun., 2018, 54, 1730–1733 RSC.
- C. Behrend and K. Heesche-Wagner, Appl. Environ. Microbiol., 1999, 65(4), 1372–1377 Search PubMed.
- J. M. Sylvia, J. A. Janni, J. D. Klein and K. M. Spencer, Anal. Chem., 2000, 72(23), 5834–5840 CrossRef PubMed.
- J. S. Caygill, F. Davis and S. P. Higson, Talanta, 2012, 88, 14–29 CrossRef PubMed.
- (a) S. Sandhu, R. Kumar, P. Singh, A. Mahajan, M. Kaur and S. Kumar, ACS Appl. Mater. Interfaces, 2015, 7(19), 10491–10500 CrossRef PubMed; (b) K. Maiti, A. K. Mahapatra, A. Gangopadhyay, R. Maji, S. Mondal, S. S. Ali and D. Mandal, ACS Omega, 2017, 2(4), 1583–1593 CrossRef; (c) B. Gogoi and N. Sen Sarma, ACS Appl. Mater. Interfaces, 2015, 7(21), 11195–11202 CrossRef PubMed; (d) C. Wu, J. L. Zhao, X. K. Jiang, X. L. Ni, X. Zeng, C. Redshaw and T. Yamato, Anal. Chim. Acta, 2016, 936, 216–221 CrossRef PubMed; (e) J. F. Xiong, J. X. Li, G. Z. Mo, J. P. Huo, J. Y. Liu, X. Y. Chen and Z. Y. Wang, J. Org. Chem., 2014, 79(23), 11619–11630 CrossRef PubMed.
- (a) J. R. Zhang, Y. Y. Yue, H. Q. Luo and N. B. Li, Analyst, 2016, 141(3), 1091–1097 RSC; (b) T. M. Geng, S. N. Ye, Y. Wang, H. Zhu, X. Wang and X. Liu, Talanta, 2017, 165, 282–288 CrossRef PubMed.
- (a) M. Kaur, S. K. Mehta and S. K. Kansal, Sens. Actuators, B, 2017, 245, 938–945 CrossRef; (b) A. Pal, M. P. Sk and A. Chattopadhyay, ACS Appl. Mater. Interfaces, 2016, 8(9), 5758–5762 CrossRef PubMed.
- (a) A. Buragohain, M. Yousufuddin, M. Sarma and S. Biswas, Cryst. Growth Des., 2016, 16(2), 842–851 CrossRef; (b) H. Guo, Y. Zhang, Z. Zheng, H. Lin and Y. Zhang, Talanta, 2017, 170, 146–151 CrossRef PubMed; (c) J. Ye, L. Zhao, R. F. Bogale, Y. Gao, X. Wang, X. Qian and G. Ning, Chem.–Eur. J., 2015, 21(5), 2029–2037 CrossRef PubMed; (d) S. Dang, J. H. Zhang and Z. M. Sun, J. Mater. Chem., 2012, 22(18), 8868–8873 RSC; (e) F. Y. Yi, J. P. Li, D. Wu and Z. M. Sun, Chem.–Eur. J., 2015, 21(32), 11475–11482 CrossRef PubMed; (f) W. T. Yang, H. R. Tian, J. P. Li, Y. F. Hui, X. He, J. Y. Li, S. Dong, Z. G. Xie and Z. M. Sun, Chem.–Eur. J., 2016, 22(43), 15451–15457 CrossRef PubMed.
- G. M. Sheldrick, SADABS, Program for Empirical Absorption Correction of Area Detector Data, University of Göttingen, Göttingen, 1996 Search PubMed.
- P. van der Sluis and A. L. Spek, Acta Crystallogr., Sect. A: Found. Crystallogr., 1990, A46, 194 CrossRef.
- G. M. Sheldrick, SHELXS 97, Program for Crystal Structure Refinement, University of Göttingen, Göttingen, 1997 Search PubMed.
- J. Zhao, Y. N. Wang, W. W. Dong, Y. P. Wu, D. S. Li and Q. C. Zhang, Inorg. Chem., 2016, 55, 3265–3271 CrossRef PubMed.
- (a) Y. L. Gai, F. L. Jiang, L. Chen, Y. Bu, K. Z. Su, S. A. Al-Thabaiti and M. C. Hong, Inorg. Chem., 2013, 52, 7658–7665 CrossRef PubMed; (b) A. D. Burrows, K. Cassar, T. Duren, R. M. W. Friend, M. F. Mahon, S. P. Rigby and T. L. Savarese, Dalton Trans., 2008, 18, 2465–2474 RSC; (c) K. C. Xiong, F. L. Jiang, Y. L. Gai, Y. F. Zhou, D. Q. Yuan, K. Z. Su, X. Y. Wang and M. C. Hong, Inorg. Chem., 2012, 51, 3283–3288 CrossRef PubMed.
- A. L. Spek, J. Appl. Crystallogr., 2003, 36, 7 CrossRef.
- (a) J. Cao, Y. Gao, Y. Wang, C. Du and Z. Liu, Chem. Commun., 2013, 49(61), 6897–6899 RSC; (b) Y. L. Gai, F. L. Jiang, L. Chen, Y. Bu, K. Z. Su, S. A. Al-Thabaiti and M. C. Hong, Inorg. Chem., 2013, 52(13), 7658–7665 CrossRef PubMed.
- (a) D. M. Chen, N. N. Zhang, C. S. Liu and M. Du, J. Mater. Chem. C, 2017, 5(9), 2311–2317 RSC; (b) Y. Wang, H. Yang, G. Cheng, Y. Wu and S. Lin, CrystEngComm, 2017, 19(48), 7270–7276 RSC; (c) X. Zheng, R. Fan, Y. Song, A. Wang, K. Xing, X. Du and Y. Yang, J. Mater. Chem. C, 2017, 5(38), 9943–9951 RSC.
- Y. Rachuri, B. Parmar, K. K. Bisht and E. Suresh, Cryst. Growth Des., 2017, 17(3), 1363–1372 Search PubMed.
- B. Chowdhury, S. Khatua, R. Dutta, S. Chakraborty and P. Ghosh, Inorg. Chem., 2014, 53(15), 8061–8070 CrossRef PubMed.
- S. S. Nagarkar, A. V. Desai and S. K. Ghosh, CrystEngComm, 2016, 18(17), 2994–3007 RSC.
- (a) B. Q. Song, C. Qin, Y. T. Zhang, X. S. Wu, L. Yang, K. Z. Shao and Z. M. Su, Dalton Trans., 2015, 44(42), 18386–18394 RSC; (b) C. Zhang, Y. Yan, Q. Pan, L. Sun, H. He, Y. Liu and J. Li, Dalton Trans., 2015, 44(29), 13340–13346 RSC.
- Y. Wang and Y. Ni, Anal. Chem., 2014, 86(15), 7463–7470 CrossRef PubMed.
- (a) C. Hou, Y. Wang, Q. Ding, L. Jiang, M. Li, W. Zhu and M. Liu, Nanoscale, 2015, 7(44), 18770–18779 RSC; (b) X. Lian and B. Yan, Inorg. Chem., 2016, 55(22), 11831–11838 CrossRef PubMed; (c) S. Wang, L. Shan, Y. Fan, J. Jia, J. Xu and L. Wang, J. Solid State Chem., 2017, 245, 132–137 CrossRef.
- S. Mukherjee, A. V. Desai, A. I. Inamdar, B. Manna and S. K. Ghosh, Cryst. Growth Des., 2015, 15(7), 3493–3497 Search PubMed.
Footnotes |
| † Electronic supplementary information (ESI) available. CCDC 1828358. For ESI and crystallographic data in CIF or other electronic format see DOI: 10.1039/c8ra02602e |
| ‡ Ping Ju and Ensheng Zhang equally contributed to this work. |
| This journal is © The Royal Society of Chemistry 2018 |

