 Open Access Article
Hierarchical nano zeolite-Y hydrocracking composite fibers with highly efficient hydrocracking capability†
Shaheen Fatima Anisa,
Gnanapragasam Singaravelb and
Raed Hashaikeh *a
*a
aDepartment of Chemical Engineering, Khalifa University of Science and Technology, Masdar Institute, P. O. Box 54224, Abu Dhabi, United Arab Emirates. E-mail: raed.hashaikeh@ku.ac.ae; Tel: +97128109152
bADNOC Refining Research Centre, ADNOC Refining, Abu Dhabi, United Arab Emirates
First published on 8th May 2018
Abstract
In this work, a hydrocracking catalyst, nano zeolite Y-NiO-WO3 is reshaped into nanofibrous form. This novel composite fiber show good mechanical strength together with a uniform elemental distribution for both the acidic and hydrogenation components as confirmed through scanning transmission electron microscopy. The catalyst is tested for n-heptane hydrocracking in a continuous flow fixed-bed reactor at reaction temperatures of 350 °C and 400 °C with a time on stream of 180 minutes. The fibers produced from nano zeolite-Y show superior performance with a total conversion of 98.81 wt% and 96.8 wt% at 350 °C and 400 °C respectively. In addition, a low amount of coke (0.40 wt% and 1.05 wt% at 350 °C and 400 °C respectively) was formed with the nano zeolite Y fibers. This superior performance is related to the enhanced accessibility due to the nanofiber shape where the non-woven mesh/network of catalytic fibers prevents the agglomeration of the nanoparticles. Agglomeration is a major cause of hindered accessibility of the reactants to the catalyst active sites. The zeolite particle size, and the shape of the fibrous catalyst, together with its mesoporous character (as confirmed through BET analysis) enhances diffusion and improves accessibility for the reactants to react on the catalytic active sites as proven by the high total n-heptane conversions and high hexane and iso hexane selectivity for n-heptane hydrocracking.
1. Introduction
Zeolites, a widely utilized material for various catalytic applications,1–3 finds its major application in petroleum refining.4,5 Commercially, zeolites are readily available in the micro particle form,6 whereas its nano particle counterpart is reported to show superior performance owing to a greater surface area7 and faster diffusion of the reactants and products inside the catalyst.8 However, there are certain limitations associated with using zeolite nano particles. Firstly, because of their high surface energy, the nano particles tend to agglomerate7 and hence the accessibility to the active sites is hindered. Secondly, nano particles are difficult to recover after the catalytic test. Owing to the small size of the particles, sometimes, extra effort may be required involving filtration and centrifugation to separate the catalyst from the reaction mixture.9 To overcome these limitations, there has been growing research on shaping the zeolite particles into fibrous form.10–12 The fibers provide an effective way to take advantage of the nanoscale, plus providing weight and volume to the catalyst for easier recovery. For example, Pham-Huu et al.13 reported superior performance of beta zeolite nanofibers compared to commercial beta zeolite particles for benzoylation of anisole. Liu et al.,14 compared the catalytic activity of commercial micro ZSM-5 particles to ZSM-5 nanoparticles and ZSM-5 fibers for iso-butane cracking. They reported superior conversion, selectivity and better catalyst lifetime of the ZSM-5 fibers compared to the particulate form. The superior activities in both the latter cases were attributed to higher accessibility of the active sites owing less agglomeration. However, only a few reports have been reported till now which provide a comparison of zeolite nano particles to zeolite fibers for catalytic applications.15 This in itself opens new doors for research into this field related to zeolite fiber fabrication, its characterization and consequent catalytic testing.Several methods may be adopted to produce zeolite fibers including hydrothermal synthesis,16 self-assembly techniques11 and electrospinning.6 Among these, electrospinning is reported to be a versatile, flexible, scalable yet economical method for fiber production.12,17,18 The method contains a syringe which is filled with an electrospinning solution. The solution may be a combination of zeolite and a polymer.6 The polymer is essential to provide viscosity for electrospinning.15 The syringe needle is fixed at a certain electrospinning distance from the collector. Both are connected together through a high voltage supply. The power drives the solution in the syringe to the tip of the needle where is emerges as fine jet from the liquid droplet, which consequently decreases in diameter on reaching the collector.18 The flexibility of this method allows us to incorporate certain elements in the electrospinning solution, such as metallic salts. This in turn seems promising in fabricating catalytic fibers which incorporate different elements on zeolite as a support, such as necessary in hydrocracking.19 In hydrocracking, heavier hydrocarbon molecules are broken into lighter fractions in the presence of hydrogen and a catalyst.20 However, fabrication and testing of these fibers is still a new research field with only recently the prospect of fabricating and testing the hydrocracking fibers utilizing micro zeolite particles was adopted by our group.20,21
Apart from agglomeration and recovery issues, another major challenge is the zeolite nanoparticle availability. Hydrothermal synthesis of these nanoparticles is usually challenging with rather high centrifugation speeds and times required to recover the particles from the source mixture.22 Moreover, direct synthesis with a high Si/Al ratio for certain zeolite types such as zeolite-Y is practically impossible and dealumination of the nanoparticles become impractical due to destruction of the crystal structure. A viable solution to this is reducing the particle size of high Si/Al zeolites through ball milling. Recently, Zhuman et al.,23 reported ball milling of high Si/Al ratio zeolite-Y, a viable candidate material for cracking and hydrocracking applications. They used carbon nanostructures (CNS) as a damping material while ball milling zeolite-Y to retain its crystallinity and structure. The CNS was removed after the ball milling process to obtain pure zeolite-Y nano particles with high crystallinity index.
In this study, we have utilized zeolite-Y nanoparticles to form hydrocracking fibers through the electrospinning method. Apart from the acidic zeolite support, hydrocracking essentially involves hydrogenation/dehydrogenation components such as nickel oxide and tungsten oxide.19 The incorporation of the hydrogenation component necessitates an optimum combination of solution and process parameters for the electrospinning of smooth and continuous composite fibers. A detailed study on the fabrication and hydrocracking testing of zeolite-Y micro hydrocracking fibers and particles has already been reported by our group.20 To the best of our knowledge, no study has been reported till now on the fabrication of hydrocracking fibers made from nano-zeolites. Moreover, it becomes imperative to study and compare the catalytic activities of hydrocracking fibers made from nano zeolite with the hydrocracking fibers made from zeolite-Y micro particles. Further, the fibrous catalysts have been compared with nano zeolite-Y hydrocracking particles for n-heptane hydrocracking. This study will further contribute to the field of catalysis, making significant usage of zeolite in the fibrous form, specifically utilizing nano zeolites for electrospinning zeolite fibers, a field which is still in its infant stages.15
2. Experimental
2.1 Materials
Polyvinylpyrrolidone (PVP, Mw = 1![[thin space (1/6-em)]](https://www.rsc.org/images/entities/char_2009.gif) 300
300![[thin space (1/6-em)]](https://www.rsc.org/images/entities/char_2009.gif) 000), nickel(II) acetate tetra hydrate (NiAc), ammonium metatungstate hydrate (AMT) and ethanol were purchased from Sigma-Aldrich (St. Louis, MO). Zeolite-Y (CBV 720, BET surface area of 780 m2 g−1) was purchased from Zeolyst.
000), nickel(II) acetate tetra hydrate (NiAc), ammonium metatungstate hydrate (AMT) and ethanol were purchased from Sigma-Aldrich (St. Louis, MO). Zeolite-Y (CBV 720, BET surface area of 780 m2 g−1) was purchased from Zeolyst.
2.2 Catalyst preparation
Nano zeolite Y was produced through the ball milling method as reported in,23 with a BET surface area of 522 m2 g−1. Three catalysts were prepared namely, hydrocracking fibers made from nano zeolite Y, hydrocracking fibers made from as received micro zeolite Y20 and hydrocracking particles made from nano zeolite Y24 particles. Electrospinning was used for fabricating the fibers. An electrospinning solution incorporating zeolite, AMT and NiAc was prepared as follows: NiAc was first dissolved in DI water, after which tungsten salt was allowed to dissolve in the NiAc-water solution. After the salt was completely dissolved, zeolite was added and sonicated (using a BRANSON 1510 model) for about 8 hours to homogeneously disperse the zeolite in the metal salt solution. The ratio of zeolite![[thin space (1/6-em)]](https://www.rsc.org/images/entities/char_2009.gif) :
:![[thin space (1/6-em)]](https://www.rsc.org/images/entities/char_2009.gif) NiAc
NiAc![[thin space (1/6-em)]](https://www.rsc.org/images/entities/char_2009.gif) :
:![[thin space (1/6-em)]](https://www.rsc.org/images/entities/char_2009.gif) AMT was kept as 10
AMT was kept as 10![[thin space (1/6-em)]](https://www.rsc.org/images/entities/char_2009.gif) :
:![[thin space (1/6-em)]](https://www.rsc.org/images/entities/char_2009.gif) 1
1![[thin space (1/6-em)]](https://www.rsc.org/images/entities/char_2009.gif) :
:![[thin space (1/6-em)]](https://www.rsc.org/images/entities/char_2009.gif) 15. This ratio was chosen in accordance to literature studies where the Ni
15. This ratio was chosen in accordance to literature studies where the Ni![[thin space (1/6-em)]](https://www.rsc.org/images/entities/char_2009.gif) :
:![[thin space (1/6-em)]](https://www.rsc.org/images/entities/char_2009.gif) W atomic ratio of 1
W atomic ratio of 1![[thin space (1/6-em)]](https://www.rsc.org/images/entities/char_2009.gif) :
:![[thin space (1/6-em)]](https://www.rsc.org/images/entities/char_2009.gif) 3 in the overall catalyst showed the highest hydrocracking activity.19 Zeolite content in the overall catalyst was 87 wt%. After sonication, the suspension was stirred overnight. PVP was then added in a zeolite
3 in the overall catalyst showed the highest hydrocracking activity.19 Zeolite content in the overall catalyst was 87 wt%. After sonication, the suspension was stirred overnight. PVP was then added in a zeolite![[thin space (1/6-em)]](https://www.rsc.org/images/entities/char_2009.gif) :
:![[thin space (1/6-em)]](https://www.rsc.org/images/entities/char_2009.gif) PVP ratio of 1
PVP ratio of 1![[thin space (1/6-em)]](https://www.rsc.org/images/entities/char_2009.gif) :
:![[thin space (1/6-em)]](https://www.rsc.org/images/entities/char_2009.gif) 1 by weight, and the electrospinning solution was further stirred for 5 hours or more, until a homogeneous suspension composed of zeolite particles- nickel salt- tungsten salt-PVP in water was obtained. The viscous solution was transferred to a syringe. A 22 gauge syringe needle and a Nanon-01A electrospinning setup (MECC, Japan) were used. Solution flow rate, electrospinning voltage and electrospinning distance of 0.5 ml h−1, 28 kV and 15 cm were used respectively. The as spun NiAc-AMT-zeolite-PVP composite fibers were collected and dried in a furnace at 80 °C for 6 hours to remove any moisture, following which the fibers were calcined at 550 °C at a heating rate of 1 °C min−1 for 2 hours under ambient conditions. This step removes the polymer25 and decomposes the salt for pure zeolite Y-NiO-WO3 fibers. The calcination temperature of 550 °C was chosen as per previous literature studies which confirmed the removal of polymer and decomposition of the salts at this temperature.25–27 Hydrocracking catalytic particles were also prepared from nano zeolite-Y by the wet impregnation method28 using similar hydrogenation metal and zeolite compositions for comparison with its fibrous counterpart. Because the particles were not to be electrospun, no polymer was added to it and the impregnated nano zeolite Y was post treated through a similar procedure as adopted for the as-spun fibers: they were first dried at 80 °C, followed by calcination at 550 °C. For convenience, we will be referring to the hydrocracking catalysts as follows: HDC NP for hydrocracking particles prepared from nano zeolite Y and HDC NF and HDC MF for hydrocracking fibers prepared from nano zeolite Y and as-received micro zeolite-Y particles respectively.
1 by weight, and the electrospinning solution was further stirred for 5 hours or more, until a homogeneous suspension composed of zeolite particles- nickel salt- tungsten salt-PVP in water was obtained. The viscous solution was transferred to a syringe. A 22 gauge syringe needle and a Nanon-01A electrospinning setup (MECC, Japan) were used. Solution flow rate, electrospinning voltage and electrospinning distance of 0.5 ml h−1, 28 kV and 15 cm were used respectively. The as spun NiAc-AMT-zeolite-PVP composite fibers were collected and dried in a furnace at 80 °C for 6 hours to remove any moisture, following which the fibers were calcined at 550 °C at a heating rate of 1 °C min−1 for 2 hours under ambient conditions. This step removes the polymer25 and decomposes the salt for pure zeolite Y-NiO-WO3 fibers. The calcination temperature of 550 °C was chosen as per previous literature studies which confirmed the removal of polymer and decomposition of the salts at this temperature.25–27 Hydrocracking catalytic particles were also prepared from nano zeolite-Y by the wet impregnation method28 using similar hydrogenation metal and zeolite compositions for comparison with its fibrous counterpart. Because the particles were not to be electrospun, no polymer was added to it and the impregnated nano zeolite Y was post treated through a similar procedure as adopted for the as-spun fibers: they were first dried at 80 °C, followed by calcination at 550 °C. For convenience, we will be referring to the hydrocracking catalysts as follows: HDC NP for hydrocracking particles prepared from nano zeolite Y and HDC NF and HDC MF for hydrocracking fibers prepared from nano zeolite Y and as-received micro zeolite-Y particles respectively.
2.3 Catalyst characterization
Phase identification and structural characteristics of the prepared catalysts were studied through powder X-ray diffraction (PXRD) and a simultaneous thermogravimetric-Fourier transform infrared spectroscopy (TGA-FTIR) respectively. PXRD patterns were acquired at room temperature using an X-ray diffractometer (PANalytical, Emperean) operating at 45 kV and 40 mA with Ni-filtered CuKα (λ = 1.5056 Å) radiations in 5–50° half angle range. TGA-FTIR was carried out using a NETZSCH TG 449 F3 Jupiter-Thermogravimetric Analyzer, connected to a Bruker FTIR for gas phase combustion products analysis. The sample was heated from room temperature to 1000 °C using a heating rate of 30°C min−1 under a continuous flow of 20 ml min−1 nitrogen. The infrared spectra were acquired in the range of 4500–700 cm−1. The catalysts were characterized for their morphology through high resolution scanning electron microscopy (HRSEM) using Nova nano field-enhanced SEM operating at 5 kV. SEM samples were gold coated (≈5 nm thickness) using a precision etching coating system (Gatan Model 682, Germany). A high resolution transmission electron microscope (HRTEM) (Tecnai F20, FEI), operating at 200 kV was also used together with STEM-EDS mode for chemical analysis and EDS mapping. For TEM sample preparation, the catalysts were first sonicated in ethanol for 15 minutes before depositing them onto a carbon coated copper grid. Zeolite acidity zeolite were measured by temperature-programmed desorption of ammonia (NH3-TPD) method. 100 mg of catalyst sample was pretreated in nitrogen at 500 °C for 1 h, cooled to 100 °C and adsorbed NH3 for 30 min. The excess ammonia was flushed by pure nitrogen gas at 100 °C for 45 min, after which temperature-programmed desorption started at a rate of 10°C min−1 from 100 °C to 500 °C. Nitrogen adsorption/desorption experiments were conducted using Brunauer, Emmett and Teller (BET), NOVA®-e Series Model 25 Quantachrome Instruments. The catalyst was first degassed at 300 °C for 4 hours in order to desorb the impurities on the surface. The surface area of the catalysts was calculated through multipoint BET method. Data in the relative pressure range of 0.05–0.30 was used for this purpose.2.4 Catalytic test
The feed molecule used in the catalytic test is n- heptane (Aldrich, >99 mol%). Catalytic tests were carried out in a continuous fixed-bed down-flow reactor with an inner diameter of 9 mm, operating at a total hydrogen pressure of 5 bars. The catalysts were used as prepared, without forming any extrudate. 500 mg of catalyst was loaded into the reactor sandwiched between quartz wool. For each new test, a fresh catalyst was used, where it was first kept in hydrogen stream for 3 h at 550 °C in order to pre-reduce active metal present in the fiber or particles. Feed was introduced thereafter, and two testing temperatures were chosen for the study, 350 °C and 400 °C. Weight hourly space velocity (WHSV) equal to 4 h−1 with a hydrogen to hydrocarbon molar ratio of 3![[thin space (1/6-em)]](https://www.rsc.org/images/entities/char_2009.gif) :
:![[thin space (1/6-em)]](https://www.rsc.org/images/entities/char_2009.gif) 1 was used. The first sample obtained after 1 hour was flushed out and discarded as drain, after which liquid and gaseous product samples were collected for 3 hours at each 1 hour interval. Liquid products were analyzed by an off line gas chromatography mass spectrum (GC MS), GC 7890B-MS5977A equipped with a 5 column nonpolar column. Nitrogen was used as a carrier gas. Gaseous products were analyzed offline using a 7890A GC system, 8-column RGA with a FID detector for hydrocarbon analysis.
1 was used. The first sample obtained after 1 hour was flushed out and discarded as drain, after which liquid and gaseous product samples were collected for 3 hours at each 1 hour interval. Liquid products were analyzed by an off line gas chromatography mass spectrum (GC MS), GC 7890B-MS5977A equipped with a 5 column nonpolar column. Nitrogen was used as a carrier gas. Gaseous products were analyzed offline using a 7890A GC system, 8-column RGA with a FID detector for hydrocarbon analysis.
The spent catalyst was treated to remove the absorbed hydrocarbons through toluene extraction after which thermo-gravimetric analysis (TGA) was performed in order to get the %coke formed. PerkinElmer TGA 4000 was used for this purpose where spent catalyst samples (20–30 mg) were placed in a sample pan and heated from room temperature to 1000 °C at a rate of 10 °C min−1 with an oxygen flow of 20 ml min−1.
Catalytic activity is expressed in terms of total % conversion, which is defined as follows:
 | (1) |
% cracking, % isomerization, % selectivity and % of olefin formation were calculated as follows:
 | (2) |
 | (3) |
 | (4) |
 | (5) |
3. Results and discussion
3.1 Catalyst characterization
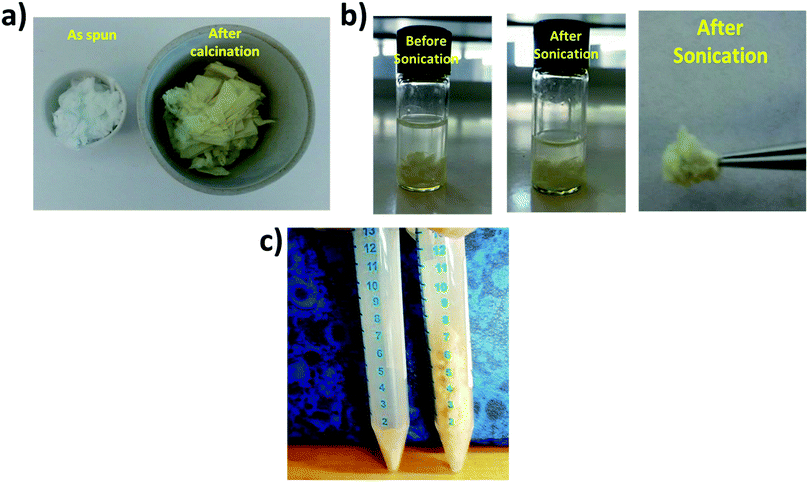
The hydrocracking catalysts were studied for their morphology and structural characteristics through various techniques. Fig. 1a shows the physical appearance of the as spun and calcined HDC NF. The yellowish color is characteristic of the m-WO3 phase.26 Similar color was observed for the HDC MF and HDC NP (Fig. S1†). It is imperative that the fabricated fibers retain their structural stability and do not disintegrate into particles thereafter. Therefore, fiber integrity was tested by sonicating the fibers in ethanol for 15 minutes. It can be seen from Fig. 1b that the fibers do not disperse in solution as reported by pure zeolite fibers in.20 Another interesting feature of the HDC NF is that the fibrous form occupy more volume compared to the HDC NP. This can be observed in Fig. 1c where equal amounts of catalyst, 200 mg were put into a tube. The higher volume of the HDC NF facilitates easier recovery of the catalyst, as nano particle recovery is also one of the major problems reported.9Fig. 2a shows the TGA graph of as spun HDC NF together with the corresponding FTIR spectrums shown in Fig. 2b and c. Decomposition of NiAc, AMT and PVP is taking place at different temperatures. Dehydration of NiAc and hydrolysis of acetate groups takes place at 200–250 °C. The side groups of PVP breakdown during the same temperature range. The sharp CO2 peaks at 345–350 °C are due to the combustion of the evolved gaseous species. Major decomposition of the tungsten salt, AMT takes place in the temperature range of 350–450 °C. The rest of the decomposition is due to evolution of any secondary products or gases from the fiber.
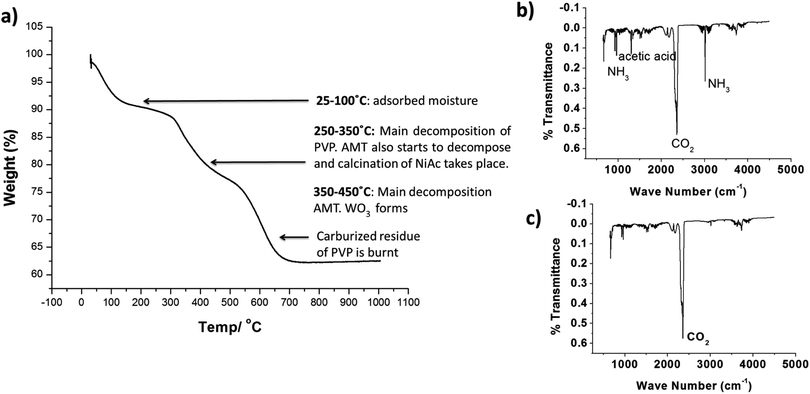 | ||
| Fig. 2 (a) TGA of as-spun nano zeolite Y-NiAc-AMT-PVP composite fibers and (b and c) corresponding FTIR spectrums to study the thermal decomposition of PVP, NiAc and AMT in the composite fiber. | ||
The XRD patterns for ball milled nano zeolite Y and as received zeolite Y particles are shown in Fig. 3a. As reported by Bota et al.,23 the zeolite structure after ball milling is still retained and all major zeolite peaks below 2θ 20° were registered. The XRD patterns for the three hydrocracking catalysts, HDC NF, HDC NP and HDC MF are shown in Fig. 3b with some major WO3 peak indexed. WO3 registers no peaks before 2θ 20°.20,29 The fibers registered similar XRD patterns to the HDC NP, confirming that the electrospinning method does not bring about any structural changes to the catalyst. All major zeolite peaks, as well major peaks of m-WO3 (ref. 25) were registered. All the peaks before 2θ 20° are essentially from zeolite Y. NiO peaks were not detected as NiO was present in very small amounts in the catalyst (less than 5 wt%) and therefore it was not practically possible to detect this phase using the current XRD equipment. Never the less, its presence was detected by EDS as discussed later.
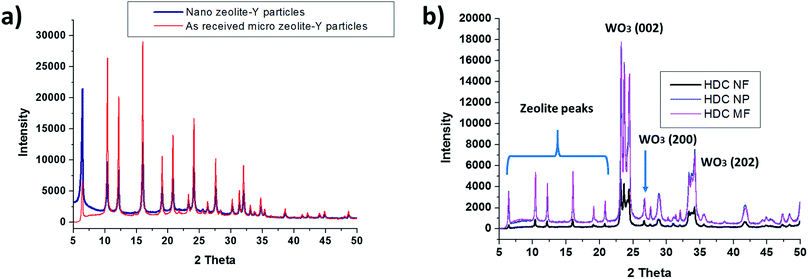 | ||
| Fig. 3 (a) XRD patterns for as received zeolite Y micro particles and ball milled nano zeolite Y particles (b) XRD patterns of HDC NF, HDC NP and HDC MF. | ||
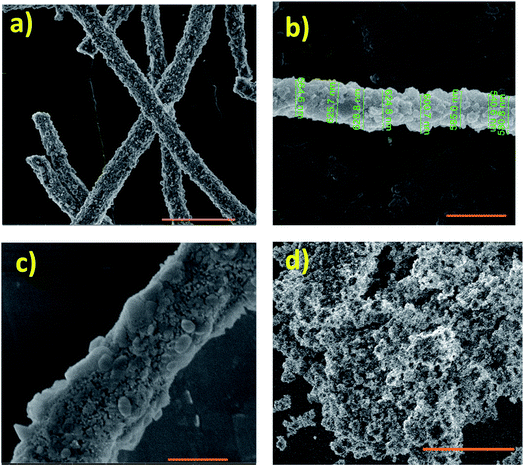
Fig. S2a†shows SEM image of as received zeolite Y micro particles while Fig. S2b† shows the TEM image of the reduced size, ball milled nano zeolite Y particles. The micro particles range from about 500 nm up to 1 μm. These micro zeolite particles were used in the preparation of HDC MF. The micro fibers ranged in diameter from about 1.3 μm to 2.3 μm as shown in Fig. S3.† The ball milled nano zeolite Y particles were used in the preparation of HDC NP and HDC NF. Fig. 4 shows HRSEM images of calcined HDC NF and HDC NP. HRSEM image in Fig. 4a reveals uniform, continuous HDC NF with fiber diameters varying from about 600 nm to 700 nm. A single fiber strand in Fig. 4b shows variation in fiber diameter. A magnified image of the HDC NF is shown in Fig. 4c where a combination of small and large crystallites on the fiber surface can be observed. Similar was observed with HDC MF (Fig. S3b†). Because the nano particles possess high surface energy, the HDC NP tend to agglomerate as seen in Fig. 4d. During calcination, the hydrogenation elements come to the surface of the catalyst.30 This decreases the surface area of the overall catalyst as components such as WO3 have a low BET surface area of around 10 m2 g−1.27 Fig. 5a shows the N2 adsorption/desorption curves and the BET surface areas for HDC NF, HDC NP and HDC MF. The HDC MF and HDC NP register similar surface areas of 290 and 296 m2 g−1 respectively while HDC NF gave a surface area of 242 m2 g−1. These surface areas are higher than those reported in the literature for various hydrocracking catalysts.31,32 Another interesting feature is that the mesoporosity33 of the catalyst is retained after it has been formed into a hydrocracking catalyst, for both particles and fibers as evident from the hysteresis loop of the graphs. This is an important feature of zeolite catalysts as their mesoporous character improves the mass transfer properties between the acidic and the metal function. Hence, hierarchical zeolites have known to be more promising for catalytic applications because they facilitate reactants and products within the catalyst and allow synergic metal-support interaction for optimal process efficiency.34 Fig. 5b shows the pore size distribution, with the mesopores centered at 11 nm within the HDC NF as determined by the BJH method.
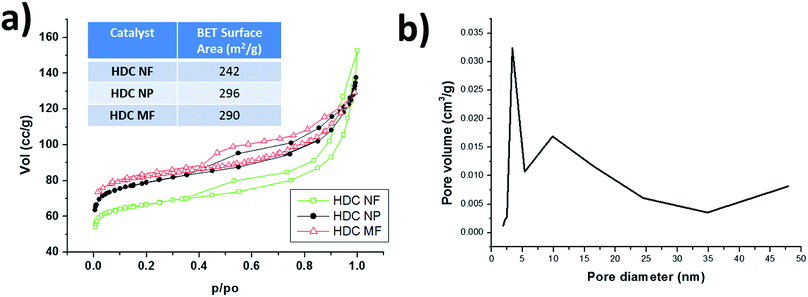 | ||
| Fig. 5 (a) N2 adsorption/desorption curves for HDC NF, HDC NP and HDC MF and their corresponding BET surface areas (b) BJH pore size distribution of HDC NF. | ||
Fig. 6a shows TEM image of a single HDC NF. As these fibers were sonicated for 15 minutes in ethanol before preparing the TEM sample, this further attests to the mechanical integrity of the fibers. Again, the different sizes of crystallites are quite prominent in the TEM image. It is difficult to know the exact location of zeolite and the hydrogenation components as due to the bulk EDS technique, any EDS point gives all the elements in the EDS spectrum. However, we can have an idea about the metal distribution through EDS mapping. Fig. 6b shows STEM-EDS analysis on a small part of the fiber strand as highlighted by the yellow box. All elements were seen to be uniformly distributed within the fiber with the silicon, aluminum and oxygen distribution attesting zeolite uniformity and the nickel, tungsten and oxygen distribution attesting the hydrogenation elements uniformity. Therefore, the electrospinning technique provides the advantage of a uniform elemental distribution within a single fiber which is desirable for a hydrocracking catalyst because of close proximity of acid and hydrogenation sites for shorter diffusion lengths of reactant molecules between the zeolite and hydrogenation components.35
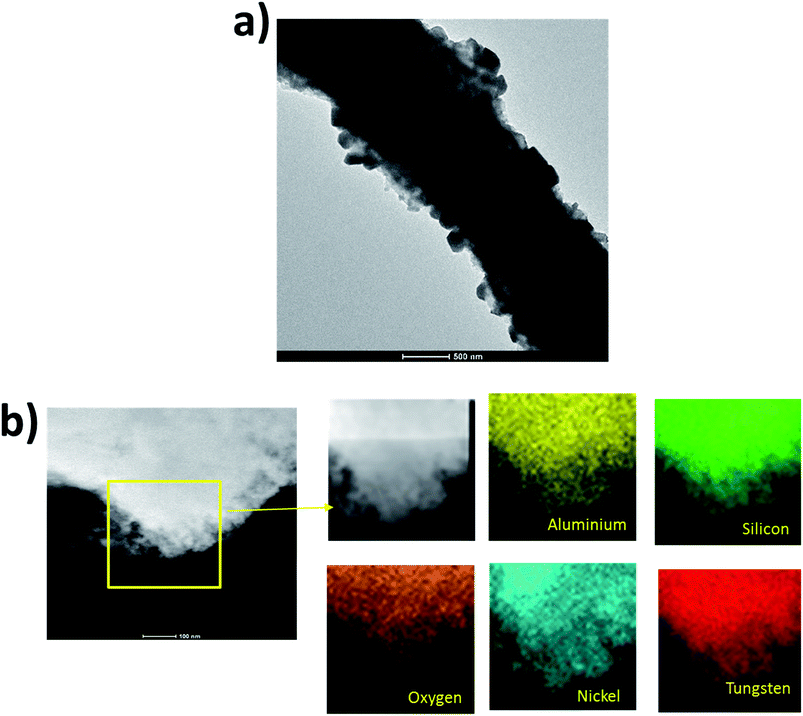 | ||
| Fig. 6 (a) TEM image of HDC NF (b) STEM-EDS analysis on part of a HDC NF showing uniform distribution of elements within the fiber even in a small fiber portion. | ||
3.2 Catalyst activity
Table 1 compares the total conversion and major product selectivity for HDC NF, HDC NP and HDC MF at 350 °C and 400 °C. A detailed discussion is provided in Sections 3.2.1 and 3.2.2 where HDC NF conversions and selectivity are compared to HDC MF and HDC NP respectively.| Catalyst/testing temperature | Conversion of n-heptane (wt%) | Selectivity for n-C6 (wt%) | Selectivity for i-C6 (wt%) | Selectivity for C3 (wt%) | Selectivity for C4 (wt%) |
|---|---|---|---|---|---|
| HDC NF [350 °C] | 98.8 | 19.8 | 39.3 | 2.3 | 9.9 |
| HDC NF [400 °C] | 96.8 | 50.7 | 18.9 | 2.3 | 1.4 |
| HDC NP [350 °C] | 98.3 | 20.8 | 33.7 | 3.7 | 6.1 |
| HDC NP [400 °C] | 95.7 | 42.0 | 24.2 | 3.1 | 2.4 |
| HDC MF [350 °C] | 63.1 | 0.5 | 0.9 | 20.9 | 24.9 |
| HDC MF [400 °C] | 31.8 | 0.6 | 0.7 | 19.0 | 24.9 |
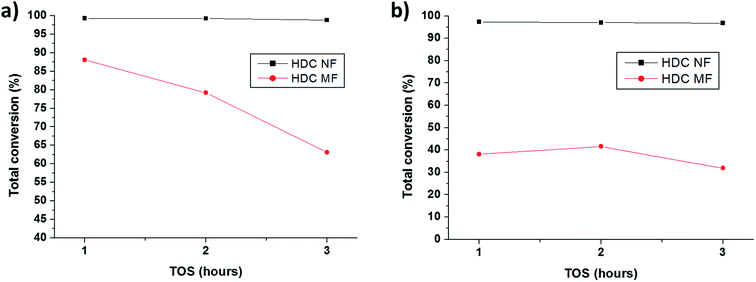 | ||
| Fig. 7 Comparison of total conversions for HDC NF and HDC MF on total TOS at (a) 350 °C and (b) 400 °C. | ||
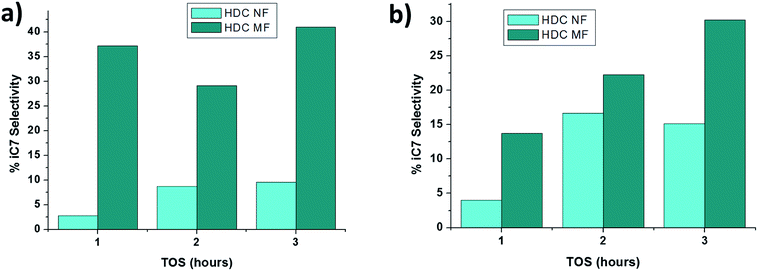
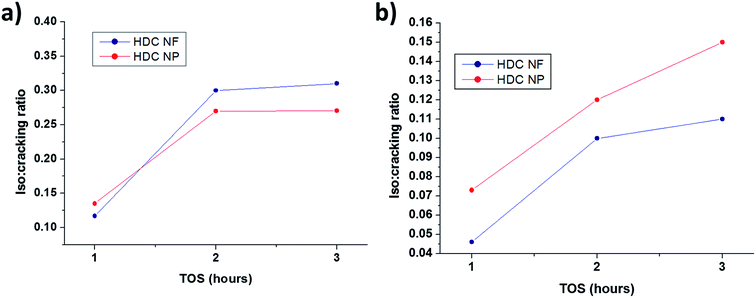
From Table 1, it can be observed that the major products for HDC MF are butane (C4) and propane (C3). These results are consistent with the literature37 where n-heptane usually cracks through a bi-functional mechanism with an olefin forming from dehydrogenation on the hydrogenation site, which diffuses to the acidic site and gets cracked through β-scission mechanism.38 Moreover, from Fig. 8, it might be inferred that the HDC MF is behaving not only as a cracking catalyst, but also as a hydro isomerization catalyst. The amount of heptane isomers (iC7) obtained with the HDC MF is much higher than that registered by HDC NF. This typical product feature of high iC7 has been observed previously when n-alkanes were hydrocracked with low to medium overall conversions.38 Another important feature is the increase in iC7 with TOS for both HDC NF and HDC MF. A possible reason for this is again deactivation of the catalyst. As the catalyst deactivates, isomerization of the feed increases and cracking decreases.39 It is interesting to note that the major products obtained with the HDC NF are n-hexane (n-C6) and iso-hexane (i-C6). The % selectivity changes with a change in temperature, where a higher temperature of 400 °C is producing more n-C6 concurrently with a lower amount of i-C6 when compared to 350 °C.
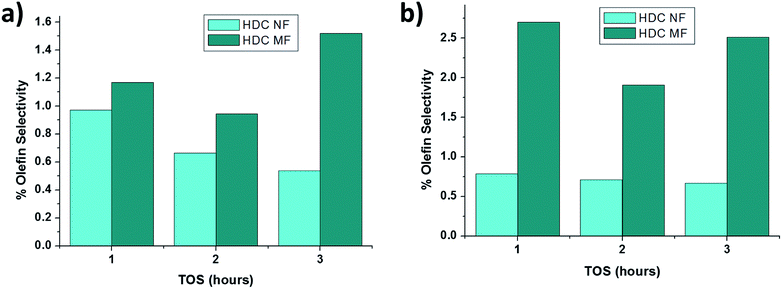
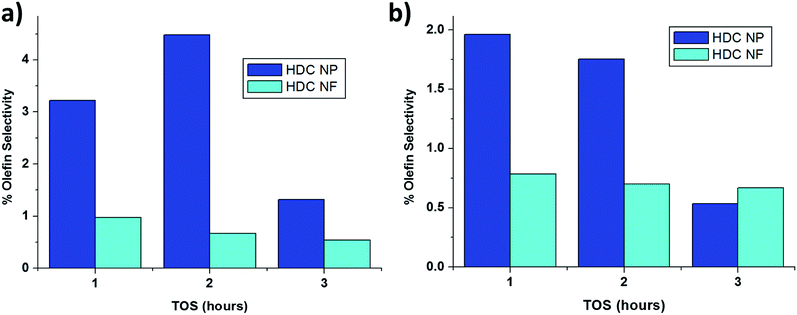
Fig. 9a and b compares the percentage of unsaturated products formed by HDC NF and HDC MF at 350 °C and 400 °C respectively. Less olefin formation is registered with the HDC NF hinting towards either more accessibility and/or less deactivation of the hydrogenation sites in catalytic fiber. Interestingly, the percentage of olefins formed with both the catalyst is quite small ranging from about 0.6 wt% to about 2.5 wt% of the total converted products. The major olefins obtained from GC were benzene derivatives and toluene.
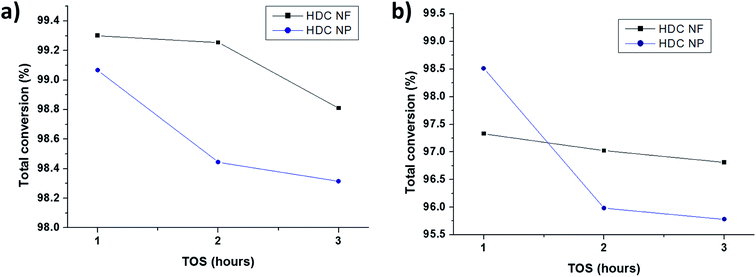 | ||
| Fig. 10 Comparison of total conversions for HDC NF and HDC NP on total TOS at (a) 350 °C and (b) 400 °C. | ||
From Table 1, it can be seen that the major products for both HDC NP and HDC NF are quite similar with large percentages of n-C6 and i-C6 obtained. Fig. 12 highlights the distribution of liquid products after each hour for 350 °C and 400 °C. It can be seen that the production of heptane isomers is much less compared to n-C6 and i-C6, which implies that the main reaction is cracking rather than isomerization unlike in HDC MF discussed in the previous section. Secondly, higher percentage of iC7 is obtained for HDC NP compared to HDC NF. There is a slight difference in selectivity for both HDC NP and HDC NF at the two temperatures. At 350 °C, the percentage of i-C6 obtained is greater than n-C6, while at 400 °C, more n-C6 is obtained than i-C6. One possibility is that after the production of n-C6, the molecule may isomerize to i-C6. At a lower temperature, this happens readily. While at 400 °C, most of the n-C6 does not isomerize and remains as n-C6. Further comparing the selectivity at 400 °C, it can be observed that the HDC NF register more percentage of n-C6 while HDC NP gave more percentage of i-C6. This might be attributed to an increased isomerization of n-C6 with catalyst deactivation.
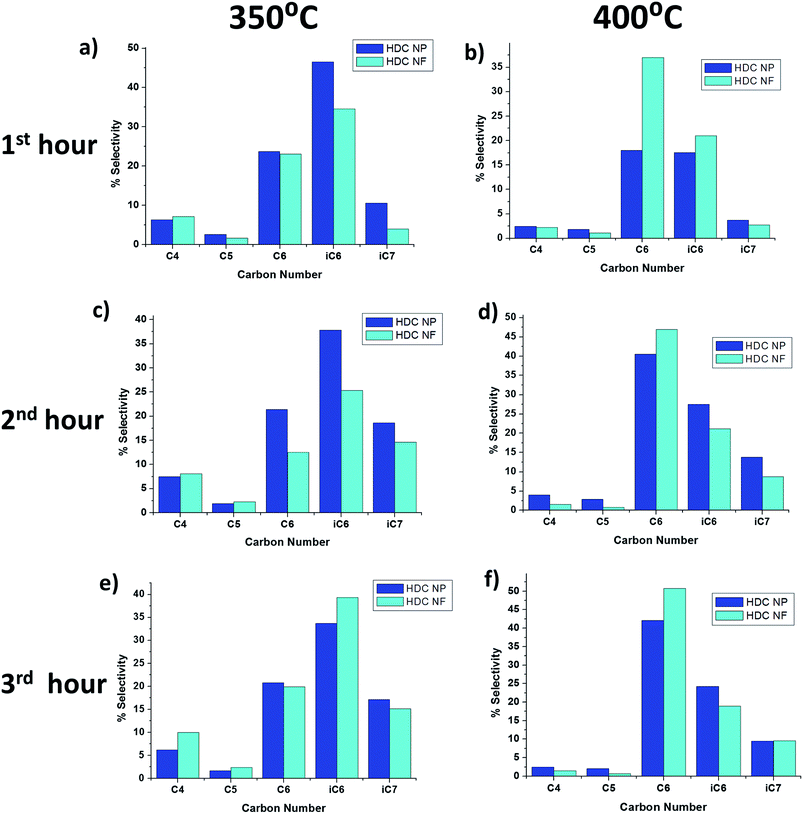 | ||
| Fig. 12 Product selectivity using HDC NF and HDC NP at 350 °C and 400 °C respectively after (a and b) 1st hour (c and d) 2nd hour and (e and f) 3rd hour of reaction. | ||
Fig. 13 compared the amount of olefin formed at the two testing temperatures for HDC NF and HDC NP. Interestingly, higher percentages of olefin are formed with HDC NP, compared to both HDC NF and HDC MF. Thus the fibrous form provides a close proximity of hydrogenation and acidic sites due to the uniform distribution of the elements compared to the particles.
The superior catalytic performance of nano zeolite-Y for the hydrocracking application suggests that the study may be extended for other applications whereby advantage of the nanostructure of the zeolite can be taken together with a uniform elemental distribution obtained through electrospinning. For example, it may be applied in producing hydrocracking catalysts with other hydrogenation components such as Co–Mo/nano Y, Ni–Mo/nano Y and for Mo/nano ZSM-5 for methanol oxidation and many others.
4. Conclusion
Hydrocracking fibrous catalysts utilizing nano zeolite Y were prepared from the electrospinning method whereby a suspension of nano zeolite Y, nickel and tungsten salts and PVP polymer was electrospun. The nano zeolite Y-NiO-WO3 fibers were characterized for their morphology, mechanical strength, structural properties and elemental analysis through various techniques including HR-SEM, HR-TEM, BET, XRD and STEM-EDS. The fibers showed good mechanical stability in ethanol after sonication with a uniform distribution of the hydrogenation and acidic component within the fibers. These fibers were compared for n-heptane hydrocracking activity with hydrocracking fibers made from micro zeolite Y and hydrocracking particles made from nano zeolite Y at 350 °C and 400 °C. The nano zeolite Y hydrocracking fibers showed superior conversions of about 98.8 wt% and 96.8 wt% compared to hydrocracking micro zeolite Y fibers with 63.1 wt% and 31.8 wt% at 350 °C and 400 °C respectively. Similar conversions for nano zeolite fibers and nano zeolite Y particles were registered, however, the former showed better catalytic stability over the total time on stream of 3 hours. The fibrous form gives an added advantage of easier recovery of the catalyst. In addition, less coke was formed with the nano zeolite Y fibers compared to hydrocracking nano particles. This in turn was attributed to much lesser deactivation of the fibrous catalyst. These results for nano zeolite Y-NiO-WO3 composite catalysts prove to be promising for utilizing zeolite in the nano form for hydrocracking application and further, this study can be extended to a wider context for different zeolite types for various catalytic applications where zeolite is often used in conjunction with other metals or metal oxides.Conflicts of interest
There are no conflicts to declare.Acknowledgements
The authors would like to thank ADNOC Refining Research Center (ARRC), Abu Dhabi for funding this work.References
- M. G. Rimoli, M. R. Rabaioli, D. Melisi, A. Curcio, S. Mondello and R. Mirabelli, et al., Synthetic zeolites as a new tool for drug delivery, J. Biomed. Mater. Res., 2008, 87A(1), 156–164 CrossRef CAS PubMed
.
- M. J. Climent, A. Corma, S. Iborra and J. Primo, Base catalysis for fine chemicals production: Claisen-Schmidt condensation on zeolites and hydrotalcites for the production of chalcones and flavanones of pharmaceutical interest, J. Catal., 1995, 151(1), 60–66 CrossRef CAS
.
- S. Kulprathipanja, Zeolites in industrial separation and catalysis, Wiley Online Library, 2010 Search PubMed
.
- J. D. Sherman, Synthetic zeolites and other microporous oxide molecular sieves, Proc. Natl. Acad. Sci., 1999, 96(7), 3471–3478 CrossRef CAS
.
- C. Marcilly, Where and how shape selectivity of molecular sieves operates in refining and petrochemistry catalytic processes, Top. Catal., 2000, 13(4), 357–366 CrossRef CAS
.
- S. F. Anis and R. Hashaikeh, Electrospun zeolite-Y fibers: Fabrication and morphology analysis, Microporous Mesoporous Mater., 2016, 233(suppl. C), 78–86 CrossRef CAS
.
- L. Tosheva and V. P. Valtchev, Nanozeolites: Synthesis, Crystallization Mechanism, and Applications, Chem. Mater., 2005, 17(10), 2494–2513 CrossRef CAS
.
- H. Konno, T. Okamura, T. Kawahara, Y. Nakasaka, T. Tago and T. Masuda, Kinetics of n-hexane cracking over ZSM-5 zeolites–effect of crystal size on effectiveness factor and catalyst lifetime, Chem. Eng. J., 2012, 207, 490–496 CrossRef
.
- S. Ivanova, B. Louis, M.-J. Ledoux and C. Pham-Huu, Autoassembly of nanofibrous zeolite crystals via silicon carbide substrate self-transformation, J. Appl. Chem. Sci., 2007, 129(11), 3383–3391 CAS
.
- C. Pham-Huu, G. Winé, J.-P. Tessonnier, M.-J. Ledoux, S. Rigolet and C. Marichal, BETA zeolite nanowire synthesis under non-hydrothermal conditions using carbon nanotubes as template, Carbon, 2004, 42(10), 1941–1946 CrossRef CAS
.
- B. S. Liu, D. C. Tang and C. T. Au, Fabrication of analcime zeolite fibers by hydrothermal synthesis, Microporous Mesoporous Mater., 2005, 86(1–3), 106–111 CrossRef CAS
.
- D. Srinivasan, R. Rao and A. Zribi, Synthesis of novel micro- and mesoporous zeolite nanostructures using electrospinning techniques, J. Electron. Mater., 2006, 35(3), 504–509 CrossRef CAS
.
- C. Pham-Huu, G. Wina, J.-P. Tessonnier, M.-J. Ledoux, S. Rigolet and C. Marichal, BETA zeolite nanowire synthesis under non-hydrothermal conditions using carbon nanotubes as template, Carbon, 2004, 42(10), 1941–1946 CrossRef CAS
.
- J. Liu, G. Jiang, Y. Liu, J. Di, Y. Wang and Z. Zhao, et al., Hierarchical macro-meso-microporous ZSM-5 zeolite hollow fibers with highly efficient catalytic cracking capability, Sci. Rep., 2014, 4, 7276 CrossRef CAS PubMed
.
- S. F. Anis, A. Khalil, G. Singaravel and R. Hashaikeh, A review on the fabrication of zeolite and mesoporous inorganic nanofibers formation for catalytic applications, Microporous Mesoporous Mater., 2016, 236, 176–192 CrossRef CAS
.
- K. Okada, K.-i. Kuboyama, T. Takei, Y. Kameshima, A. Yasumori and M. Yoshimura, In situ zeolite Na–X coating on glass fibers by soft solution process, Microporous Mesoporous Mater., 2000, 37(1–2), 99–105 CrossRef CAS
.
- H. Wu, W. Pan, D. Lin and H. Li, Electrospinning of ceramic nanofibers: Fabrication, assembly and applications, J. Adv. Ceram., 2012, 1(1), 2–23 CrossRef CAS
.
- J. Di, H. Chen, X. Wang, Y. Zhao, L. Jiang and J. Yu, et al., Fabrication of zeolite hollow fibers by coaxial electrospinning, Chem. Mater., 2008, 20(11), 3543–3545 CrossRef CAS
.
- L. Gutberlet, R. Bertolacini and S. Kukes, Design of a nickel-tungsten hydrocracking catalyst, Energy Fuels, 1994, 8(1), 227–233 CrossRef CAS
.
- S. F. Anis, G. Singaravel and R. Hashaikeh, Electrospun Ni-W/zeolite composite fibers for n-heptane hydrocracking and hydroisomerization, Mater. Chem. Phys., 2017, 200, 146–154 CrossRef CAS
.
- T. Kaminski, S. F. Anis, M. M. Husein and R. Hashaikeh, Hydrocracking of Athabasca VR Using NiO-WO3 Zeolite-Based Catalysts, Energy Fuels, 2018, 32(2), 2224–2233 CrossRef CAS
.
- H. Awala, J.-P. Gilson, R. Retoux, P. Boullay, J.-M. Goupil and V. Valtchev, et al., Template-free nanosized faujasite-type zeolites, Nat. Mater., 2015, 14(4), 447–451 CrossRef CAS PubMed
.
- B. Zhuman, Thesis: The Use of Carbon Nanostructures as a Binding Material for Zeolite Particles and the Evaluation of their Catalytic Performance, MSc thesis, Masdar Institute of Science and Technology, Abu Dhabi, UAE, 2017
.
- S. F. Anis, G. Singaravel and R. Hashaikeh, NiW/nano zeolite Y catalysts for n-heptane hydrocracking, Mater. Chem. Phys., 2018, 212, 87–94 CrossRef CAS
.
- S. F. Anis, B. S. Lalia, A. O. Mostafa and R. Hashaikeh, Electrospun nickel–tungsten oxide composite fibers as active electrocatalysts for hydrogen evolution reaction, J. Mater. Sci., 2017, 52(12), 7269–7281 CrossRef CAS
.
- I. Szilágyi, E. Santala, M. Heikkilä, M. Kemell, T. Nikitin and L. Khriachtchev, et al., Thermal study on electrospun polyvinylpyrrolidone/ammonium metatungstate nanofibers: optimising the annealing conditions for obtaining WO3 nanofibers, J. Therm. Anal. Calorim., 2011, 105(1), 73–81 CrossRef
.
- S. F. Anis, B. S. Lalia, G. Palmisano and R. Hashaikeh, Photoelectrochemical activity of electrospun WO3/NiWO4 nanofibers under visible light irradiation, J. Mater. Sci., 2018, 53(3), 2208–2220 CrossRef CAS
.
- H.-y. Zhang, Y.-g. Wang, P.-z. Zhang, X.-c. Lin and Y.-f. Zhu, Preparation of NiW catalysts with alumina and zeolite Y for hydroprocessing of coal tar, J. Fuel Chem. Technol., 2013, 41(9), 1085–1091 CrossRef CAS
.
- S. F. Anis and R. Hashaikeh, Electrochemical water splitting using nano-zeolite Y supported tungsten oxide electrocatalysts, J. Nanopart. Res., 2018, 20(2), 47 CrossRef
.
- S. Mohanty, D. Kunzru and D. N. Saraf, Hydrocracking: a review, Fuel, 1990, 69(12), 1467–1473 CrossRef CAS
.
- Y. Rezgui and M. Guemini, Effect of acidity and metal content on the activity and product selectivity for n-decane hydroisomerization and hydrocracking over nickel–tungsten supported on silica–alumina catalysts, Appl. Catal., A, 2005, 282(1), 45–53 CrossRef CAS
.
- J. Campelo, F. Lafont and J. Marinas, Hydroisomerization and hydrocracking of n-heptane on Pt/SAPO-5 and Pt/SAPO-11 catalysts, J. Catal., 1995, 156(1), 11–18 CrossRef CAS
.
- J. Wang, D.-m. Chen, H.-w. Gu, H. Teng and X.-q. Ren, Advances in preparation and catalytic applications of mesoporous ZSM-5 zeolitic materials, J. Nanjing Univ. Technol., 2010, 4, 022 Search PubMed
.
- A. Galadima and O. Muraza, Hydrocracking catalysts based on hierarchical zeolites: A recent progress, J. Ind. Eng. Chem., 2017 DOI:10.1016/j.jiec.2017.12.024
.
- P. Robinson and G. Dolbear, Hydrotreating and Hydrocracking: Fundamentals, in Practical Advances in Petroleum Processing, ed. C. Hsu and P. Robinson, Springer New York, 2006, pp. 177–218 Search PubMed
.
- H. Cerqueira, G. Caeiro, L. Costa and F. R. Ribeiro, Deactivation of FCC catalysts, J. Mol. Catal. A: Chem., 2008, 292(1), 1–13 CrossRef CAS
.
- G. E. Giannetto, G. R. Perot and M. R. Guisnet, Hydroisomerization and hydrocracking of n-alkanes. 1. Ideal hydroisomerization PtHY catalysts, Ind. Eng. Chem. Prod. Res. Dev., 1986, 25(3), 481–490 CrossRef CAS
.
- J. A. Martens, P. A. Jacobs and J. Weitkamp, Attempts to rationalize the distribution of hydrocracked products. I qualitative description of the primary hydrocracking modes of long chain paraffins in open zeolites, Appl. Catal., 1986, 20(1), 239–281 CrossRef CAS
.
- F. R. Ribeiro, Zeolite Bifunctional Catalysis, Zeolites: Science and Technology, 1984, 404–411 Search PubMed
.
Footnote |
| † Electronic supplementary information (ESI) available. See DOI: 10.1039/c8ra02662a |
| This journal is © The Royal Society of Chemistry 2018 |

