 Open Access Article
Recrystallization techniques for the synthesis of ZnO nanorods: an in situ process for carbon doping and enhancing the dispersion concentration of ZnO nanorods†
Muhammad Mohsin Hossain a,
Md. Akherul Islamb,
Hossain Shimac,
Mudassir Hasand,
Muhammad Hilal
 e and
Moonyong Lee*f
aDepartment of Energy and Materials Engineering, Dongguk University, Seoul 04620, Republic of Korea 712-749
bDepartment of Pharmacy, Atish Dipankar University of Science & Technology, Banani, Dhaka 1213, Bangladesh
cDepartment of Chemistry, Rajshahi Univesity, Rajshahi 6205, Bangladesh
dDepartment of Chemical Engineering, King Khalid University, Abha 61411, Kingdom of Saudi Arabia
eGhulam Ishaq Khan Institute of Engineering Sciences and Technology, Topi, Khyber Pakhtunkhwa, Pakistan
fSchool of Chemical Engineering, Yeungnam University, Gyeongsan 712-749, Republic of Korea
First published on 9th May 2018
Abstract
Zinc acetate is recrystallized as lumber-shaped tetragonal rods by a novel recrystallization technique. Subsequently, the recrystallized zinc acetate is converted into ZnO nanorods in a glass vial by the simplest and cheapest method without utilizing any expensive instrumentation. Carbon is doped in ZnO nanorods during the preparation ZnO nanorods without any extra steps, chemicals, or effort. The carbon-doped ZnO nanorods can be dispersed in a solvent at very high concentrations and are also stable for a very long time, which are comparatively higher than those of the other existing ZnO nanoparticles. The higher dispersion concentration and higher stability of ZnO nanoparticles are explained by a scheme that demonstrates the suspending mechanism of the ZnO nanoparticles at higher concentrations with higher stabilities in a solvent through the anchoring groups of carbon. No materials are used for surface modification; no surface coatings, ionic materials, or pH controlling materials are used to increase the dispersion concentration and stability. This is the first observation of the doped carbon playing a significant role in the dispersion of ZnO nanoparticles at higher concentrations by withholding them in the solvent. Therefore, doped carbon at the surface of ZnO nanoparticles prevents the self-aggregation of ZnO nanoparticles in the solution phase by interfacial barrier layers among ZnO nanorods and interfacial interactive layer between ZnO nanorod and solvent.
1Introduction
Nanoparticles and their high-concentration dispersion are very important for many applications.1 For example, the high dispersion of ZnO nanoparticles can be used in oil recovery or oil separation,2 coolants, heat transfer,3 strong blue emission4–7 photoluminescence,8 beautification products, textiles, coatings, paints, as fillers for composite materials, in optoelectronic applications,9 water splitting,10,11 photoanodes and photocatalysis,11 and organic molecule synthesis.12However, for different types of device formation and applications, the nanoparticles should be dispersed homogeneously in the liquid phase with good stability. Subsequently, this homogeneous stable solution of ZnO nanoparticles can be used for painting, coating, textiles, skin beautification, heat transfer, blue emission, and optoelectronic applications. However, if nanoparticles are not dispersed homogeneously, they create aggregations in the thin film device surface, composite matrix, other substrates, or solution. Generally, this disadvantage is due to the high surface energy of the nanoparticles, which causes their agglomeration.13 Consequently, such nanoparticles are not stable in aqueous media during storage.14
Several methods have been utilized to prevent such aggregation and produce stable ZnO nanoparticles, including covering ZnO nanoparticles by organic molecules15–17 or inorganic SiO2 shells18 and coating19 the nanoparticle surface by polymerization. Alternatively, other efforts have been undertaken to improve the dispersion stability of ZnO in an organic solvent or in the aqueous phase by using a surfactant,20 polymer8,21,22 phosphate,23 inositol hexakisphosphate,24 organic matter,25–27 or oleic acid,6,28 a combination of a polymer and exfoliating agent such as zirconium phosphate;29 ionic materials;30 and the controlled combined effect31 of pH and ionic strength. However, surface modification has a significant impact on various properties;4,5 further, it is useful to obtain a stable ZnO solution that allows the dispersion of ZnO nanoparticles in organic and water7 solvents.
However, the concentration of ZnO nanoparticles had not been mentioned in most studies.6,21–25,31 Without the optimum concentration of ZnO nanoparticles, the stability of ZnO nanoparticles cannot be guaranteed, because the stability directly depends of the concentration of ZnO nanoparticles. If a higher concentration is used, ZnO will be aggregated quickly and if a lower concentration is used, a higher stability is shown. Therefore, the dispersion concentration is very important to show the dispersion stability of ZnO nanoparticles. Nevertheless, most previous studies have excluded the concentration of ZnO nanoparticles. The researchers in previous works have used lower initial concentrations of ZnO nanoparticles to show the long-time stability of ZnO nanoparticles in solution. However, it is not significant to understand actual stability of ZnO nanoparticles because of the lower concentration of ZnO. Additionally, a lower concentration is not ideal for applications. Anyway, previous studies have demonstrated dispersion concentrations of 0.02 mg mL−1,3 0.001 mg mL−1,20 0.01 mg mL−1,26 0.02 mg mL−1,29 0.05–0.10 mg mL−1,30 0.01 mg mL−1,27 0.01 mg mL−1,32 and 0.2 and mg mL−1,8 which are very low.
The most fruitful method to prepare ZnO nanoparticles is the sol–gel route.33 This method well dispersed ZnO nanoparticles using simple ultrasound but the dispersion concentration (0.08 mg mL−1) was lower. For the case of polymer coating or polymer functionalization on ZnO nanoparticles surface, the synthesized polymer increases the viscosity of the solution or ZnO medium. Therefore, the sedimentation of ZnO nanoparticles in the polymer matrix or in the polymer solution decreases. In fact, this is due to suspending ZnO nanoparticles by increasing the viscosity of the medium. Therefore, this process is only applicable for specific applications because of the limitation of the separation techniques of ZnO nanoparticles from a polymer solution or from the surface-deposited polymer matrix. Thus, these techniques are not feasible for a wide range of applications. For the other cases above, third materials (surfactant, organic matters, phosphate, inositol hexakisphosphate, zirconium phosphate, ionic materials, oleic acid, etc.) are used for improving the dispersion stability; however, this resulted in a longer, more complex, and more expensive synthesis.
Recently, dispersion concentration has been improved by the interaction of Zn in ZnO nanoparticles with CO2,9 which is very interesting work. By this process, the improvement in dispersion concentration occurred from 0.001 mg mL−1 to 0.02 mg mL−1; however, the final dispersion concentration was very low (0.02 mg mL−1). Therefore, a flexible process that allows for the smooth synthesis of highly dispersible and higher stability ZnO nanoparticles is required.
Here, we synthesized ZnO nanoparticles by a novel recrystallization technique in which a cheap and easy process was utilized. The unique recrystallization technique can synthesize a large amount of ZnO nanoparticles without utilizing any expensive instrumentation. In addition, this process permits in situ carbon doping in ZnO nanorods without any extra steps, chemicals, or effort. The prepared carbon-doped ZnO nanoparticles showed significantly higher dispersion concentration and higher stability than the existing research works. The doped carbon inside the ZnO nanoparticles bonded chemically with Zn and functioned as anchoring groups through its functional groups with the solvent at interface. Therefore, the ZnO nanoparticles were suspended well in the solution and the dispersion concentration and stability were increased. Finally, the mechanism of dispersion improvement is shown to explain the role of doped carbon as an anchor to suspend ZnO nanoparticles in liquid media.
2 Experimental
2.1 Instrumentation
The structural morphology of the ZnO nanorods was determined using field-emission scanning electron microscopy (FESEM, S-4800, Hitachi, Japan) and transmission electron microscopy (FE-TEM, TECHNAI G2 F2O S-TWIN, FEI Company, USA). Crystallographic information was acquired using X-ray diffraction (XRD, thin film, MPD, PANalytical). The vibrational phonon modes of the nanorods were described by Raman spectroscopy (HORIBA JOBIN YVON, Lab RAM HR, laser wavelength 514.54). X-ray photoelectron spectroscopy (XPS, K-Alpha, Thermo Scientific, USA) was utilized to determine the binding character of ZnO nanorods and carbon, where the latter was doped in ZnO nanorods.2.2 Chemicals
Zinc acetate dihydrate (Sigma Aldrich, 98%) was dissolved in ethanol (95%, Duksan, Korea) and sonicated to prepare the solution of zinc acetate (60 mg mL−1). The recrystallized zinc acetate was prepared from the zinc acetate solution by a long-time settlement. ZnO nanorods were synthesized from the recrystallized zinc acetate.2.3 Preparation process of ZnO nanorods
Zinc acetate dihydrate (4.8 g) was added to ethanol (80 mL) to prepare 60 mg mL−1 solution of zinc acetate. The solution was sonicated in a glass bottle around 70 min until a clear homogeneous solution was obtained. Subsequently, it was allowed to settle for 12 h so that the compound recrystallized at the bottom of the glass bottle. Then, the clear ethanol was discarded from the bottle, and the recrystallized zinc acetate was collected. Some of this zinc acetate was placed in an empty glass vial (10 mL) and heated at 450 °C for 45 min to prepare the ZnO nanorods.3 Results and discussion
3.1 ZnO and HT ZnO nanorods
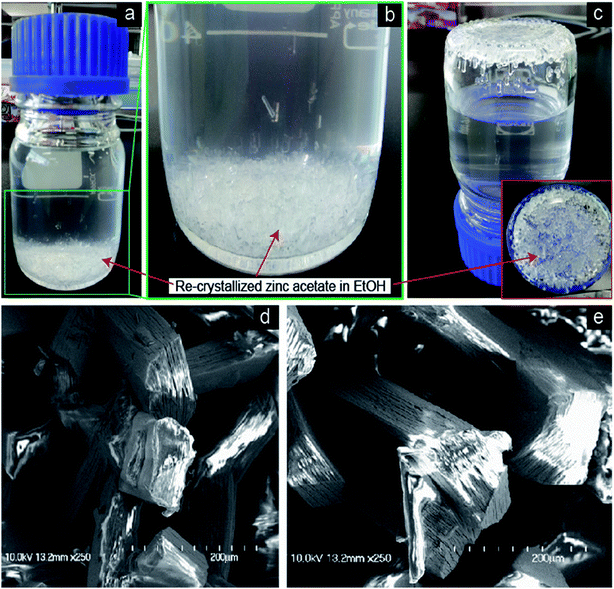
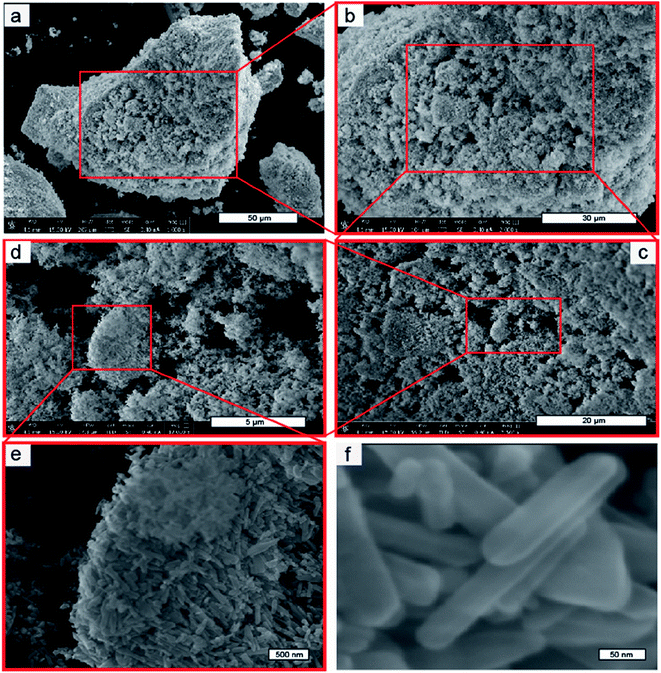
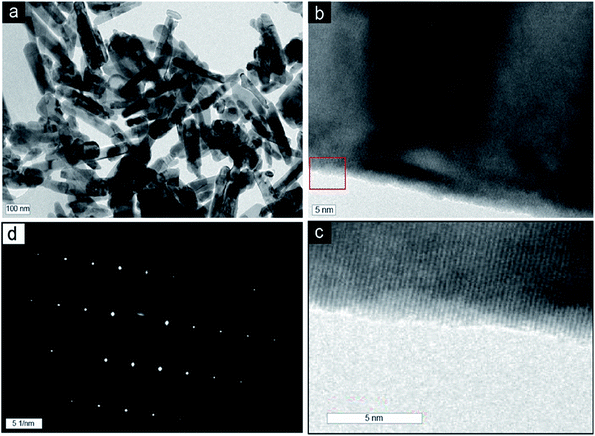
Fig. 1a shows the optical image of the recrystallized zinc acetate at the bottom side of the glass bottle. To clearly show the recrystallized zinc acetate, a high-resolution image is shown in Fig. 1b and the bottle top side was turned down (Fig. 1c). FESEM images (Fig. 1d and e) of the recrystallized zinc acetate were obtained to investigate the surface morphology of the recrystallized zinc acetate. Fig. 1d and e indicate the chopped-wood structure. Further, 500 mg of the recrystallized zinc acetate was heated in a glass vial (10 mL) to prepare ZnO nanorods at 450 °C for 45 min. FESEM images (Fig. 2) of the prepared ZnO nanorods were obtained. Fig. 2a shows the ZnO nanorods pile. Step-by-step high-resolution FESEM images (Fig. 2b–e) show the rod-shaped ZnO nanoparticles. Fig. 2e is obtained from the marked area of Fig. 2d; Fig. 2d is obtained from the rectangular area of Fig. 2c; Fig. 2c is shown from the rectangular marked area of Fig. 2b; finally, Fig. 2b is exhibited from the marked area of Fig. 2a. Fig. 2e exhibited the rod-shaped structure. Clear nanorod-shaped structures are shown in Fig. 2f. Based on Fig. 1 and 2, the ZnO nanorods preparation schematic diagram is as shown in Fig. 3. Fig. 3a shows the recrystallized zinc acetate that was converted to ZnO nanorods at 450 °C (Fig. 3b). The TEM image of the ZnO nanorods is shown in Fig. 4a. Here, ZnO nanorods were clearly observed. The high-resolution TEM image (Fig. 4b) shows the crystalline phase of the ZnO nanorods, which are more visible in Fig. 4c. The latter is obtained from the marked area of Fig. 4b. It shows the (002) plane with 0.26 Å of the ZnO nanorods. The selected-area electron diffraction pattern of ZnO nanorods is shown in Fig. 4d.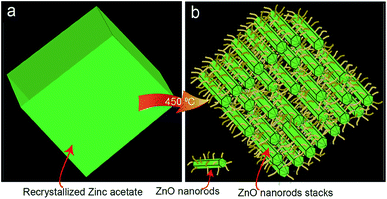 | ||
| Fig. 3 Schematic diagram of the ZnO nanorods from zinc acetate recrystal. (a) Re-crystallized zinc acetate and (b) ZnO nanorods prepared from the zinc acetate re-crystal. | ||
The XRD spectrum (Fig. 5a) shows peaks at 31.0, 33.7, 35.5, 46.8, 55.8, 62.2, 65.7, 67.3, 68.4, 71.9, 76.3, 80.8, and 89.0, which are correspond to the (100), (002), (101), (102), (110), (103), (200), (112), (201), (004), (202), (104), and (203) planes, respectively. The peak positions and their corresponding planes suggest the wurtzite structure of ZnO nanorods with JCPDS no. 01-075-0576.34–38 The high-intensity (101)-plane peak at 35.5 indicated that the nanorods were selectively oriented to the (101) plane. The 2–30 (2θ) area was magnified and shown in Fig. 5b. The XRD curve (Fig. 5b) of the 7–30 (2θ) area indicated a broad band peak of the (002) plane. It is the characteristic peak of carbon at position 22.75.37,39–41 This broad band carbon peak suggests that low-crystalline carbon is present in the ZnO nanorods. The formation of low-crystalline carbon inside the ZnO nanorods may have occurred during the decomposition of recrystallized zinc acetate 450 °C for 45 min. However, the XRD spectrum indicates that carbon is present inside the ZnO nanorods.
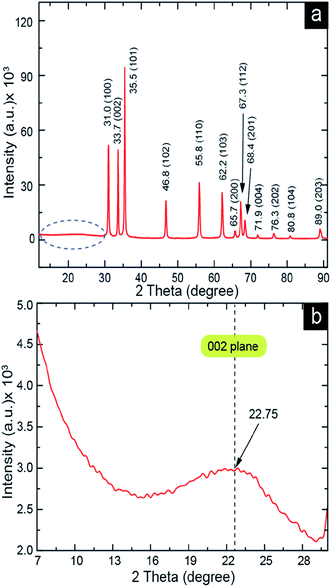 | ||
| Fig. 5 XRD of ZnO nanorods. (a) ZnO nanorods XRD pattern and (b) high resolution XRD curve of the marked dotted area of (a) was shown here to see the carbon characteristic 002 plane peak. | ||
3.2 Raman spectrum to determine the carbon and its character inside the ZnO nanorods
Raman spectroscopy (Fig. S1†) analysis of ZnO was performed to investigate the interactions of the ZnO nanorods containing carbon. Fig. S1† exhibits the Raman spectra at 50–1700 cm−1, showing peaks at 94.4, 221.2, 325.5, 378.0, 432.7, 570.0, 1145.0, and 1578.5 cm−1. The peak at 221.2 cm−1 was assigned to the 2-E2(M) phonon mode of the ZnO nanorod, which is the second-order Raman spectrum due to the zone boundary (M point).41 The peak at 378.0 cm−1 was related to the A1 phonon vibration mode to the transverse optical (TO) direction of the ZnO nanorods.42 The peaks at positions 94.4 cm−1 and 432.7 cm−1 of the ZnO nanorods were allotted to the E2 (low)43 and E2 (high)44 phonon, respectively. The peak at 570.0 cm−1 for ZnO was allotted to the A1-LO (longitudinal optical)43,45 phonon mode of ZnO, which is a lower-frequency position than that of the normal position (574–579 cm−1).43,45–47 Therefore, the position of the lower frequency (570.0 cm−1) A1-LO phonon mode also indicated the strong interfacial interaction between the carbon and the Zn in the ZnO nanorods. The carbon doping in ZnO might have decreased the vibrational frequency of Zn–O at the longitudinal direction during the incident 514 nm laser on the ZnO nanorods. The 325 cm−1 peak is for the second-order mode of multiple phonon scattering. The 1145 cm−1 phonon mode is for the Raman peak of the tetrahedral amorphous sp3 carbon, which is generated by the visible excitation (514 nm laser) with a G band at 1578.5 cm−1.48 Therefore, the Raman spectra indicated that carbon is present inside the ZnO nanorods and that it has good interactions with Zn. Additionally, the 1145 cm−1 peak indicates a tetrahedral-type (sp3) carbon.3.3 XPS analysis to confirm the existence of carbon phase
The 2p3/2 and 2p1/2 peaks (Fig. 6a) at positions 1022 eV and 1045 eV, respectively, specify Zn as ZnO. The interaction of the carbon-containing functional group with Zn in the ZnO nanorods is shown by the O 1s core level peak in Fig. 6b, which is split into 530.40, 531.10, 532.21, 533.21, and 533.91 eV. The 530.40 eV peak of O2− shows a wurtzite structure of the ZnO. Two peaks occurred at positions 531.10 eV and 532.21 eV, which were generated in the oxygen deficiency region in the ZnO matrix.49 The two oxygen deficiency peaks reveal two different oxygen vacancy environments, which were created owing to the environments of different electronegativities. The C–Zn–C and –O–Zn–C environments might have been available. Between the two environments of Zn above, –O–Zn–C is more electronegative than C–Zn–C. Therefore, the C–Zn–C environment is for the 531.10 eV peak and –O–Zn–C is for the 532.21 eV peak. The 533.21 eV and 533.91 eV peaks are associated to the C![[double bond, length as m-dash]](https://www.rsc.org/images/entities/char_e001.gif) O and C–O functional groups, respectively, which were attached chemically to Zn in the ZnO nanorods matrix.50,51 In general, the peaks are shifted to higher binding energy positions owing to the higher electronegativity.52,53 Therefore, the higher electronegative oxygen environment played a significant role in creating the two peaks above in higher binding energy positions. As the C
O and C–O functional groups, respectively, which were attached chemically to Zn in the ZnO nanorods matrix.50,51 In general, the peaks are shifted to higher binding energy positions owing to the higher electronegativity.52,53 Therefore, the higher electronegative oxygen environment played a significant role in creating the two peaks above in higher binding energy positions. As the C![[double bond, length as m-dash]](https://www.rsc.org/images/entities/char_e001.gif) O and C–O functional groups were connected to Zn, O
O and C–O functional groups were connected to Zn, O![[double bond, length as m-dash]](https://www.rsc.org/images/entities/char_e001.gif) C–O–Zn–O–C
C–O–Zn–O–C![[double bond, length as m-dash]](https://www.rsc.org/images/entities/char_e001.gif) O and C–O–Zn–O–C features might be available. The O
O and C–O–Zn–O–C features might be available. The O![[double bond, length as m-dash]](https://www.rsc.org/images/entities/char_e001.gif) C–O–Zn–O–C
C–O–Zn–O–C![[double bond, length as m-dash]](https://www.rsc.org/images/entities/char_e001.gif) O and C–O–Zn–O–C motif features are related to the C
O and C–O–Zn–O–C motif features are related to the C![[double bond, length as m-dash]](https://www.rsc.org/images/entities/char_e001.gif) O and C–O functional groups, respectively.
O and C–O functional groups, respectively.
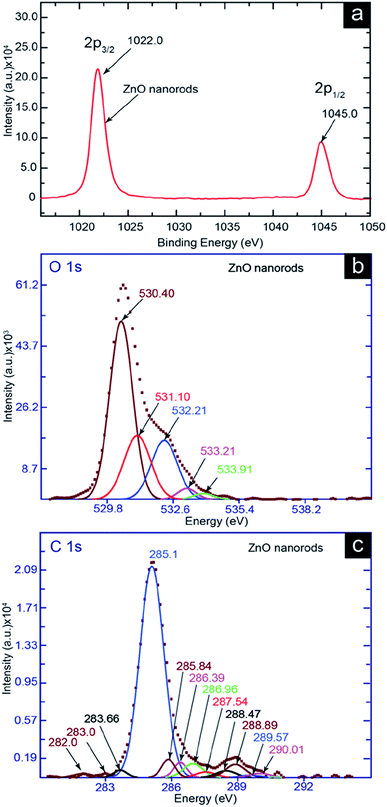 | ||
| Fig. 6 XPS spectra of ZnO nanorods. (a) ZnO 2p3/2 2p1/2, (b) ZnO O 1s, and (c) C 1s core level XPS spectra. | ||
The deconvolution of the C 1s curve (Fig. 6c) showed peaks at 285.10, 285.84, 286.39, 286.96, 287.54, 288.47, 288.89, 289.57, and 290.01 eV. A high number of deconvoluted peak in the area of 285 eV to 290 eV suggested that the carbon (sp2) inside the ZnO nanorods were highly functionalized. For example, the binding energies 285.10, 285.84, 286.39, and 286.96 eV were associated with the bond of C![[double bond, length as m-dash]](https://www.rsc.org/images/entities/char_e001.gif) C (sp2), C–C (sp3), C–O–C, and C
C (sp2), C–C (sp3), C–O–C, and C![[double bond, length as m-dash]](https://www.rsc.org/images/entities/char_e001.gif) O, respectively.54 The π electrons transition (π–π*) of sp2 carbon of the C
O, respectively.54 The π electrons transition (π–π*) of sp2 carbon of the C![[double bond, length as m-dash]](https://www.rsc.org/images/entities/char_e001.gif) C system here was exhibited at the binding energy of 290.1 eV. The peaks at the binding energies of 287.54 eV and 288.47 eV were generated owing to the interaction of Zn with the C–O–C system. Here, Zn might have interacted with C–O–C and formed Zn–C–O–C–Zn for the 287.54 eV peak, and formed Zn–O–C–O–C–O–Zn for 288.47 eV. Similarly, the other two peaks at binding energies of 288.89 eV and 289.57 eV were created by the interaction of Zn and H with the C
C system here was exhibited at the binding energy of 290.1 eV. The peaks at the binding energies of 287.54 eV and 288.47 eV were generated owing to the interaction of Zn with the C–O–C system. Here, Zn might have interacted with C–O–C and formed Zn–C–O–C–Zn for the 287.54 eV peak, and formed Zn–O–C–O–C–O–Zn for 288.47 eV. Similarly, the other two peaks at binding energies of 288.89 eV and 289.57 eV were created by the interaction of Zn and H with the C![[double bond, length as m-dash]](https://www.rsc.org/images/entities/char_e001.gif) O system. For this case, Zn and H might have interacted with C
O system. For this case, Zn and H might have interacted with C![[double bond, length as m-dash]](https://www.rsc.org/images/entities/char_e001.gif) O and formed Zn–O–C
O and formed Zn–O–C![[double bond, length as m-dash]](https://www.rsc.org/images/entities/char_e001.gif) O and H–O–C
O and H–O–C![[double bond, length as m-dash]](https://www.rsc.org/images/entities/char_e001.gif) O system for 288.89 eV and 289.57 eV peak, respectively. Generally, the chemical-bond binding energy of the carbide type is found in the area ∼282–283 eV.55,56 Therefore, the peaks at 283.66, 283.0, and 282.0 eV were responsible for the carbide type (Zn–C) chemical bond. The three peaks at 283.66, 283.0, and 282.0 eV indicated different types of electronegative or oxygen-containing environments near the carbide bond. For instance the Zn–C–Zn, C–Zn–C, and O–Zn–C carbide systems might have been available. The electronegativity order of these three carbide systems is Zn–C–Zn < C–Zn–C < O–Zn–C. Therefore, Zn has a higher electronegative environment in the O–Zn–C carbide system owing to the oxygen atom. It has a lower and medium electronegative environment in the Zn–C–Zn and C–Zn–C carbide systems, respectively, due to the less and medium electronegative environments compared to oxygen. Thus, the 282.0, 283.0, and 283.6 eV binding energies are associated with the Zn–C–Zn, C–Zn–C, and O–Zn–C carbide systems, respectively.
O system for 288.89 eV and 289.57 eV peak, respectively. Generally, the chemical-bond binding energy of the carbide type is found in the area ∼282–283 eV.55,56 Therefore, the peaks at 283.66, 283.0, and 282.0 eV were responsible for the carbide type (Zn–C) chemical bond. The three peaks at 283.66, 283.0, and 282.0 eV indicated different types of electronegative or oxygen-containing environments near the carbide bond. For instance the Zn–C–Zn, C–Zn–C, and O–Zn–C carbide systems might have been available. The electronegativity order of these three carbide systems is Zn–C–Zn < C–Zn–C < O–Zn–C. Therefore, Zn has a higher electronegative environment in the O–Zn–C carbide system owing to the oxygen atom. It has a lower and medium electronegative environment in the Zn–C–Zn and C–Zn–C carbide systems, respectively, due to the less and medium electronegative environments compared to oxygen. Thus, the 282.0, 283.0, and 283.6 eV binding energies are associated with the Zn–C–Zn, C–Zn–C, and O–Zn–C carbide systems, respectively.
3.4 Dispersion concentration and it mechanism for higher dispersion stability
The prepared ZnO nanorods (Fig. 7a) were dispersed in ethanol solvent at the rate of 1.2 mg mL−1. Using a bath sonicator, sonication was performed for 5 min to disperse the ZnO nanorods. The entire ZnO nanorods were dispersed in ethanol solution and no sediment appeared within 72 h (Fig. 7c). Even though no surfactant,20 polymer8,21,22 phosphate,23 inositol hexakisphosphate,24 different organic matters,25–27 oleic acid,6,28 combined polymer and exfoliating agent of zirconium phosphate,29 ionic materials,30 and the controlled combined effect31 of pH and ionic strength were utilized to improve the dispersion stability of ZnO nanorods in the solvent, the ZnO nanorods exhibited excellent dispersion stability and concentration after only 5 min of sonication. The dispersion concentration is comparatively high (Table S1†) than that of other ZnO nanoparticles.3,8,9,20,26,27,29,30,32,33,57,58 Therefore, a higher dispersion stability indicates that a good interfacial interaction developed between the ZnO nanorods and ethanol solvent, which helps to suspend the ZnO nanorods in the solvent. However, surface modification has significant impact on various properties.4,5 Many researchers have identified that the surface modification of nanoparticles by the deposition of other materials enhances the dispersion stability of nanoparticles in liquids.15–31,59 Therefore, the functional group of doped carbon, which is created by an in situ process in the ZnO nanorods through the recrystallization technique, might have increased the dispersion concentration and stability. Based on the XPS analysis, we found that –COOH, –O–, –OH,![[double bond splayed left]](https://www.rsc.org/images/entities/char_e009.gif) C
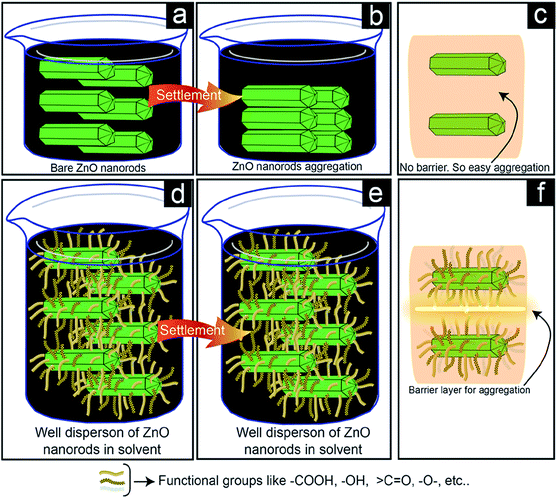
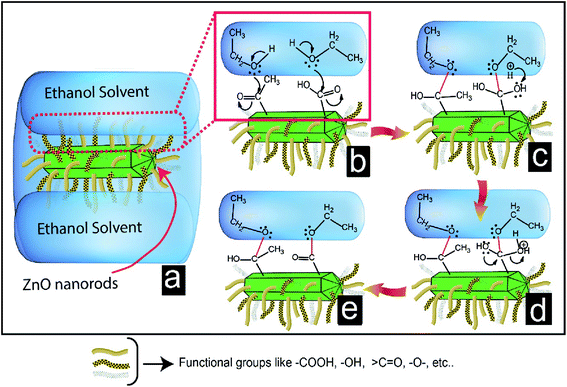
C![[double bond, length as m-dash]](https://www.rsc.org/images/entities/char_e001.gif) O, etc. are present on the doped carbon surfaces. We proposed that the mechanism of higher dispersion stability of ZnO nanorods shown in Fig. 8. Fig. 8a shows the dispersion of ZnO nanorods in the solvent. The nanorods aggregated after settling (Fig. 8b) in the dispersed solution because there was no barrier layer (Fig. 8c) present at the interface of ZnO nanorods to prevent aggregation. On the contrary, Fig. 8d shows a good dispersion solution (Fig. 8e) after settlement. The carbon-doped ZnO nanorods have many functional groups on its surface, which are shown by the different-colored curved lines on the surface of the ZnO nanorods. These different types of functional groups cause the barrier layers (Fig. 8f) to prevent aggregation. So, ZnO nanorods are hindered to be close each other for the liquid-phase aggregation. The interaction force at the interface of ZnO nanorods and solvent through the functional groups of doped carbon may have played important role for higher dispersion concentration. The interfacial interactions through the functional groups are shown in Fig. 9. In this case, new bonds formation are happened (red color bonds) in Fig. 9e. These bonds formation are happened through the reaction steps of Fig. 9c and d. Here, functional groups –COOH and
O, etc. are present on the doped carbon surfaces. We proposed that the mechanism of higher dispersion stability of ZnO nanorods shown in Fig. 8. Fig. 8a shows the dispersion of ZnO nanorods in the solvent. The nanorods aggregated after settling (Fig. 8b) in the dispersed solution because there was no barrier layer (Fig. 8c) present at the interface of ZnO nanorods to prevent aggregation. On the contrary, Fig. 8d shows a good dispersion solution (Fig. 8e) after settlement. The carbon-doped ZnO nanorods have many functional groups on its surface, which are shown by the different-colored curved lines on the surface of the ZnO nanorods. These different types of functional groups cause the barrier layers (Fig. 8f) to prevent aggregation. So, ZnO nanorods are hindered to be close each other for the liquid-phase aggregation. The interaction force at the interface of ZnO nanorods and solvent through the functional groups of doped carbon may have played important role for higher dispersion concentration. The interfacial interactions through the functional groups are shown in Fig. 9. In this case, new bonds formation are happened (red color bonds) in Fig. 9e. These bonds formation are happened through the reaction steps of Fig. 9c and d. Here, functional groups –COOH and ![[double bond splayed left]](https://www.rsc.org/images/entities/char_e009.gif) CO reacted with the –OH groups of ethanol and formed –O–C– bonds. Due the formation of these types of bonds with ethanol solvents at the interface, ZnO nanorods were also floated easily in the solvent. Therefore, two factors such as interfacial barrier layers among the ZnO nanorods and interfacial interaction between the ZnO nanorods and ethanol solvent are responsible for the higher dispersion of ZnO nanorods.
CO reacted with the –OH groups of ethanol and formed –O–C– bonds. Due the formation of these types of bonds with ethanol solvents at the interface, ZnO nanorods were also floated easily in the solvent. Therefore, two factors such as interfacial barrier layers among the ZnO nanorods and interfacial interaction between the ZnO nanorods and ethanol solvent are responsible for the higher dispersion of ZnO nanorods.
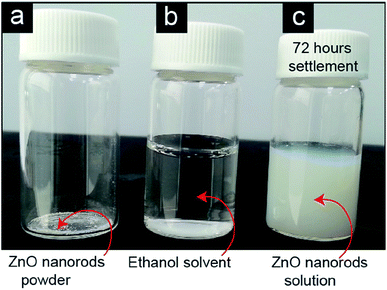 | ||
| Fig. 7 Dispersion image of ZnO nanorods (a) ZnO nanorods powder in the vial, (b) ZnO nanorods in ethanol solvent, and (c) dispersed ZnO nanorods solution in ethanol. | ||
3.5 Optical properties
The light absorption property of ZnO nanorods was measured by UV-visible spectrophotometer. It shows absorption peak at 370 nm position (Fig. S2†). Normally, the absorption intensity was decreased dramatically up to 400 nm. Then, the decreasing rate of light absorption became slower up to 620 nm. After that, decreasing rate of light absorption became near to constant within the range of 620 nm to 720 nm. Surprisingly, it increases from 720 nm to 1100 nm. So, this increasing of light absorption in the longer wavelength (720–1100) is very important for the application of ZnO nanorods in visible light driven photocatalysis, water splitting, and for photovoltaic application. The amount of the visible to NIR (400–1100 nm) light absorption area (yellow mark part, Fig. S2†) was increased significantly due to the increasing of light absorption in longer wavelength instead of decreasing. Probably, the doped carbon inside the ZnO nanorods played significant role for increasing the light absorption in visible to near IR range.35,604 Conclusion
We synthesized ZnO nanoparticles by a novel recrystallization technique, which is the cheapest and easiest process. The unique recrystallization technique allows a large number of ZnO nanoparticles to be synthesized without utilizing any expensive instrumentation. This is the first report on the preparation of ZnO nanorods using the recrystallization technique, which allowed for in situ carbon doping in the nanorods without any extra steps, chemicals, or effort. The prepared carbon-doped ZnO nanoparticles showed excellent dispersion concentration and higher stability than that of the current preparation methods of ZnO nanoparticles or nanorods. The carbon doping in ZnO nanorods has different types of functional groups, which are bonded chemically with Zn. These functional groups made the ZnO nanorods highly dispersible through anchoring them with the solvent in the liquid phase. The mechanism underlying the improved dispersion concentration was demonstrated, and the role of doped carbon in increasing the dispersion concentration and stability was explained.Conflicts of interest
The authors declare no competing financial interest.Acknowledgements
This work was supported by the Priority Research Centers Program through the National Research Foundation of Korea (NRF) funded by the Ministry of Education (2014R1A6A1031189).References
- Y. Wu, C. Lim, S. Fu, A. Tok, H. Lau, F. Boey and X. Zeng, Nanotechnology, 2007, 18, 215604 CrossRef.
- D. T. Wasan and A. D. Nikolov, Nature, 2003, 423, 156 CrossRef CAS PubMed.
- S. Chung, J. Leonard, I. Nettleship, J. Lee, Y. Soong, D. Martello and M. Chyu, Powder Technol., 2009, 194, 75–80 CrossRef CAS.
- A. C. Balazs, T. Emrick and T. P. Russell, Science, 2006, 314, 1107–1110 CrossRef CAS PubMed.
- L. P. Bauermann, J. Bill and F. Aldinger, J. Phys. Chem. B, 2006, 110, 5182–5185 CrossRef CAS PubMed.
- Y.-S. Fu, X.-W. Du, S. A. Kulinich, J.-S. Qiu, W.-J. Qin, R. Li, J. Sun and J. Liu, J. Am. Chem. Soc., 2007, 129, 16029–16033 CrossRef CAS PubMed.
- D. Vollath, D. Szabo and S. Schlabach, J. Nanopart. Res., 2004, 6, 181–191 CrossRef CAS.
- H.-M. Xiong, Y. Xu, Q.-G. Ren and Y.-Y. Xia, J. Am. Chem. Soc., 2008, 130, 7522–7523 CrossRef CAS PubMed.
- A. Gankanda, D. M. Cwiertny and V. H. Grassian, J. Phys. Chem. C, 2016, 120, 19195–19203 CAS.
- S. Liu, C. Han, Z.-R. Tang and Y.-J. Xu, Mater. Horiz., 2016, 3, 270–282 RSC.
- S. Liu, Z.-R. Tang, Y. Sun, J. C. Colmenares and Y.-J. Xu, Chem. Soc. Rev., 2015, 44, 5053–5075 RSC.
- B. Weng, S. Liu, Z.-R. Tang and Y.-J. Xu, RSC Adv., 2014, 4, 12685–12700 RSC.
- W. Ostwald, Z. Phys. Chem., 1901, 37, 385 Search PubMed.
- D. V. Talapin, A. L. Rogach, E. V. Shevchenko, A. Kornowski, M. Haase and H. Weller, J. Am. Chem. Soc., 2002, 124, 5782–5790 CrossRef CAS PubMed.
- M. L. Kahn, T. Cardinal, B. Bousquet, M. Monge, V. Jubera and B. Chaudret, ChemPhysChem, 2006, 7, 2392–2397 CrossRef CAS PubMed.
- D. P. Liu, G. D. Li, Y. Su and J. S. Chen, Angew. Chem., Int. Ed., 2006, 45, 7370–7373 CrossRef CAS PubMed.
- H. M. Xiong, Z. D. Wang, D. P. Liu, J. S. Chen, Y. G. Wang and Y. Y. Xia, Adv. Funct. Mater., 2005, 15, 1751–1756 CrossRef CAS.
- M. Abdullah, S. Shibamoto and K. Okuyama, Opt. Mater., 2004, 26, 95–100 CrossRef CAS.
- H. M. Xiong, Z. D. Wang and Y. Y. Xia, Adv. Mater., 2006, 18, 748–751 CrossRef CAS.
- M. Adil, H. M. Zaid, L. K. Chuan and N. R. A. Latiff, Energy Fuels, 2016, 30, 6169–6177 CrossRef CAS.
- S. Saliba, C. Valverde Serrano, J. Keilitz, M. L. Kahn, C. Mingotaud, R. Haag and J.-D. Marty, Chem. Mater., 2010, 22, 6301–6309 CrossRef CAS.
- E. Tang, G. Cheng, X. Ma, X. Pang and Q. Zhao, Appl. Surf. Sci., 2006, 252, 5227–5232 CrossRef CAS.
- J. Lv, S. Zhang, L. Luo, W. Han, J. Zhang, K. Yang and P. Christie, Environ. Sci. Technol., 2012, 46, 7215–7221 CrossRef CAS PubMed.
- X. Feng, Y. Yan, B. Wan, W. Li, D. P. Jaisi, L. Zheng, J. Zhang and F. Liu, Environ. Sci. Technol., 2016, 50, 5651–5660 CrossRef CAS PubMed.
- C. Jiang, G. R. Aiken and H. Hsu-Kim, Environ. Sci. Technol., 2015, 49, 11476–11484 CrossRef CAS PubMed.
- Y.-H. Peng, Y.-C. Tsai, C.-E. Hsiung, Y.-H. Lin and Y.-h. Shih, J. Hazard. Mater., 2017, 322, 348–356 CrossRef CAS PubMed.
- Y. Zhang, Y. Chen, P. Westerhoff and J. Crittenden, Water Res., 2009, 43, 4249–4257 CrossRef CAS PubMed.
- R. Hong, T. Pan, J. Qian and H. Li, Chem. Eng. J., 2006, 119, 71–81 CrossRef CAS.
- D. Sun, H.-J. Sue and N. Miyatake, J. Phys. Chem. C, 2008, 112, 16002–16010 CAS.
- C. A. David, J. Galceran, C. Rey-Castro, J. Puy, E. Companys, J. Salvador, J. Monné, R. Wallace and A. Vakourov, J. Phys. Chem. C, 2012, 116, 11758–11767 CAS.
- S.-W. Bian, I. A. Mudunkotuwa, T. Rupasinghe and V. H. Grassian, Langmuir, 2011, 27, 6059–6068 CrossRef CAS PubMed.
- A. A. Keller, H. Wang, D. Zhou, H. S. Lenihan, G. Cherr, B. J. Cardinale, R. Miller and Z. Ji, Environ. Sci. Technol., 2010, 44, 1962–1967 CrossRef CAS PubMed.
- L. Spanhel and M. A. Anderson, J. Am. Chem. Soc., 1991, 113, 2826–2833 CrossRef CAS.
- M. Hossain, A. Mamun and J. Hahn, J. Phys. Chem. C, 2012, 116, 23153–23159 CAS.
- M. M. Hossain, B.-C. Ku and J. R. Hahn, Appl. Surf. Sci., 2015, 354, 55–65 CrossRef CAS.
- H. Shima, M. M. Hossain, I. Lee, S. Son and J. R. Hahn, Mater. Chem. Phys., 2017, 185, 73–82 CrossRef CAS.
- M. Hossain, H. Shima, M. A. Islam, M. Hasan and M. Lee, RSC Adv., 2016, 6, 4683–4694 RSC.
- M. M. Hossain, H. Shima, B.-C. Ku and J. R. Hahn, J. Mater. Sci., 2015, 50, 93–103 CrossRef CAS.
- M. M. Hossain, O.-K. Park, J. R. Hahn and B.-C. Ku, Mater. Lett., 2014, 123, 90–92 CrossRef CAS.
- M. M. Hossain, H. Shima, S. Son and J. R. Hahn, RSC Adv., 2016, 6, 71450–71460 RSC.
- M. M. Hossain, H. Shima, M. A. Islam, M. Hasan and M. Lee, J. Phys. Chem. C, 2016, 120, 17670–17682 CAS.
- R. Sato-Berrú, A. Vázquez-Olmos, A. Fernández-Osorio and S. Sotres-Martínez, J. Raman Spectrosc., 2007, 38, 1073–1076 CrossRef.
- B. Bairamov, A. Heinrich, G. Irmer, V. Toporov and E. Ziegler, Phys. Status Solidi B, 1983, 119, 227–234 CrossRef CAS.
- D. I. Son, B. W. Kwon, D. H. Park, W.-S. Seo, Y. Yi, B. Angadi, C.-L. Lee and W. K. Choi, Nat. Nanotechnol., 2012, 7, 465 CrossRef CAS PubMed.
- T. C. Damen, S. Porto and B. Tell, Phys. Rev., 1966, 142, 570 CrossRef CAS.
- C. Arguello, D. L. Rousseau and S. P. d. S. Porto, Phys. Rev., 1969, 181, 1351 CrossRef CAS.
- M. Koyano, P. QuocBao, L. T. ThanhBinh, L. HongHa, N. NgocLong and S. Ktayama, Phys. Status Solidi A, 2002, 193, 125–131 CrossRef CAS.
- A. Ferrari and J. Robertson, Phys. Rev. B: Condens. Matter Mater. Phys., 2001, 63, 121405 CrossRef.
- J. Wang, Z. Wang, B. Huang, Y. Ma, Y. Liu, X. Qin, X. Zhang and Y. Dai, ACS Appl. Mater. Interfaces, 2012, 4, 4024–4030 CAS.
- Y. Lv, L. Yu, H. Huang, Y. Feng, D. Chen and X. Xie, Nanotechnology, 2012, 23, 065402 CrossRef PubMed.
- M. Salavati-Niasari, F. Davar and M. Bazarganipour, Dalton Trans., 2010, 39, 7330–7337 RSC.
- M. Samadi, H. A. Shivaee, M. Zanetti, A. Pourjavadi and A. Moshfegh, J. Mol. Catal. A: Chem., 2012, 359, 42–48 CrossRef CAS.
- K. Jayanthi, S. V. Manorama and S. Chawla, J. Phys. D: Appl. Phys., 2013, 46, 325101 CrossRef.
- C.-C. Teng, C. C. M. Ma, C.-H. Lu, S.-Y. Yang, S.-H. Lee, M.-C. Hsiao, M.-Y. Yen, K.-C. Chiou and T.-M. Lee, Carbon, 2011, 49, 5107–5116 CrossRef CAS.
- Y.-P. Zhu, M. Li, Y.-L. Liu, T.-Z. Ren and Z.-Y. Yuan, J. Phys. Chem. C, 2014, 118, 10963–10971 CAS.
- X. Zhou, Y. Li, T. Peng, W. Xie and X. Zhao, Mater. Lett., 2009, 63, 1747–1749 CrossRef CAS.
- W. J. Beek, M. M. Wienk and R. A. Janssen, Adv. Mater., 2004, 16, 1009–1013 CrossRef CAS.
- C. Pacholski, A. Kornowski and H. Weller, Angew. Chem., Int. Ed., 2002, 41, 1188–1191 CrossRef CAS PubMed.
- H.-M. Xiong, D.-P. Liu, Y.-Y. Xia and J.-S. Chen, Chem. Mater., 2005, 17, 3062–3064 CrossRef CAS.
- A. F. Khalizov, H. Xue, L. Wang, J. Zheng and R. Zhang, J. Phys. Chem. A, 2009, 113, 1066–1074 CrossRef CAS PubMed.
Footnote |
| † Electronic supplementary information (ESI) available. See DOI: 10.1039/c8ra03016b |
| This journal is © The Royal Society of Chemistry 2018 |

