 Open Access Article
Formation of different shell structures in lithium-rich layered oxides and their influence on electrochemical properties†
Kai Caoab,
Kangping Wangab,
Taotao Shenb,
Wenlou Wang *abcd and
Dongming Chena
aDepartment of Chemical Physics, University of Science and Technology of China, Hefei, Anhui 230026, P. R. China. E-mail: wlwang@ustc.edu.cn
bNano Science and Technology Institute, University of Science and Technology of China, Suzhou, Jiangsu 215123, P. R. China
cCollaborative Innovation Center of Suzhou Nano Science and Technology, Suzhou, Jiangsu 215123, P. R. China
dNational Synchrotron Radiation Laboratory, University of Science and Technology of China, Hefei, Anhui 230029, P. R. China
First published on 22nd May 2018
Abstract
A lithium-rich layered oxide with different shell structures was synthesized by a simple wet-chemical surface deposition method. X-ray diffraction (XRD), scanning electron microscopy (SEM), transmission electron microscopy (TEM), X-ray photoelectron spectroscopy (XPS), and other techniques were applied to characterize the crystal structure, morphology, and micro-structure of the samples. The surface of the lithium-rich layered oxide can successively produce island-like spinel, ultra-thin spinel, and thick two-phase (spinel and amorphous manganese oxides) separation shell layers with an increase in the coating amount. The formation process of the different shell structures and the effect of the shell structure on the lattice parameters were discussed. The different shell structures play an important role in the electrochemical performance of the lithium-rich oxide. In particular, when the coating amount is 1 wt%, the lithium-rich material with a uniform Li4Mn5O12 spinel shell layer exhibits superior electrochemical performance, and can maintain a discharge capacity of 209.9 mA h g−1 and 166.8 mA h g−1 at rates of 2C and 5C.
1. Introduction
Lithium ion batteries are one of the most popular energy storage devices in the world because of their long service life and high energy density.1,2 However, due to the rapid development of large energy storage equipment (such as electric vehicles, plug-in hybrid electric vehicles, smart grids, etc.), it is becoming more and more difficult for the energy density of lithium ion batteries to meet the criteria, something which is mainly ascribed to the limitation of the low specific capacity of current commercial cathode materials. Recently, lithium-rich layered oxides with the chemical formulas Li[Lix(MnyM1−y)1−x]O2 and/or xLi2MnO3·(1 − x)LiMO2 (M = Ni, Co, Fe, etc.) have attracted much attention, owing to their high specific capacity (ca. 250 mA h g−1), environmental friendliness, low cost (a major component of these transition metal compounds is manganese), and high operating discharge voltage (∼3.5 V).3–6 Nevertheless, this kind of material is also plagued by poor cycle stability and dreadful rate performance.7–9 Therefore, it is urgent to solve these shortcomings in order to obtain lithium-rich layered oxides with excellent electrochemical performance.Many efforts have been employed to remedy these drawbacks. For instance, surface coating,10–13 heterogeneous element doping,14,15 construction of nano-size particles,16,17 acid treatment,18 and blending with lithium intercalation compounds19 have been discussed. Among them, surface coating has been proven to be an effective method to improve the cycle stability and high rate performance of lithium-rich layered materials. Various materials, including various oxides, fluorides, phosphates, and carbon materials, have been used to form coating layers.20–22 On the other hand, these coated materials have either low ionic conductivity or poor electronic conductivity or are even electrochemically inactive, which may hamper the further improvement of the electrochemical properties of lithium-rich cathode materials. Currently, the superior electrochemical performance of spinel materials has attracted much attention as a result of their excellent ionic and electronic conductivity.23,24 Spinel materials have been widely used as coating materials for lithium-rich cathode oxides. Su’s group reported that, by using the spinels LiNi0.5Mn1.5O4 and LiMn2O4 as a protective shell layer, the electrochemical performance of lithium-rich cathode materials is greatly improved.25,26 The spinel LiNi0.5Mn4.5O12 was also used by Xie et al.27 as a coating, and the lithium-rich oxide equally showed good electrochemical properties. Although some reports have been focused on lithium ion cathode materials with layered spinel core–shell structures, there is little investigation of Li4Mn5O12 as a shell material in lithium-rich layered oxides.
In this work, we reported a lithium-rich layered oxide encapsulated by the ultra-thin spinel Li4Mn5O12 through a simple surface deposition method. The Li4Mn5O12 spinel shell material is generated by the solid-state reaction of manganese oxide with lithium. This lithium comes from the in situ diffusion of the lithium-rich cathode material during heat treatment. In order to form the Li4Mn5O12 shell layer, the heat treatment temperature is chosen to be 400 °C. The basis for choosing this temperature is that Li4Mn5O12 is decomposed into Li2MnO3 and LiMn2O4 when the temperature is higher than 500 °C.28 Hence, 400 °C is the relative optimum temperature for the formation of Li4Mn5O12. In principle, the diffusion amount of the lithium in the lithium-rich layered oxide to the interface is finite under certain conditions (heat treatment temperature and time). This will lead to the formation of different shell structures with changes in the coating amount. Therefore, the formation of different shell structures is discussed in this paper. We also considered the influence of the shell structure on the lattice parameters of the core particle and the electrochemical properties.
2. Experimental and computational methods
Synthesis of the lithium-rich layered oxide
Layered Li1.24Ni0.12Co0.13Mn0.51O2 was synthesized by a conventional co-precipitation method followed by the conduction of a solid-state reaction at high temperature in air. Analytical grade chemicals NiSO4·6H2O, CoSO4·7H2O, and MnSO4·H2O in stoichiometric amounts were dissolved in 75 ml distilled water, while excess 2 mol% Na2CO3 (ensuring the precipitation of all the transition metals) was dissolved in the same volume of distilled water. The molar concentration of the two solutions was 2 M. Afterwards, the two solutions were simultaneously dropped into the reactor at a constant feed rate (0.58 ml min−1) through two peristaltic pumps. The solid–liquid mixture was continuously stirred (rotating speed: 400 rpm min−1) for 13 h under a nitrogen atmosphere and the aging temperature was maintained at 55 °C. After aging, the obtained carbonate precursor was carefully filtered, washed, and dried in a vacuum at 100 °C for 6 h. Then, the carbonate precursor underwent pre-calcination at 500 °C for 5 h in air and was thoroughly mixed with the required amount of LiOH. Afterwards, the mixture was calcined at 900 °C for 12 h in a muffle furnace and then cooled to room temperature to obtain the target sample (pristine sample).Synthesis of samples with different shell structures
Firstly, solids MnSO4 and Na2CO3 were dissolved in 20 ml and 10 ml distilled water, respectively. Then, the prepared lithium-rich oxide powder was dispersed in the MnSO4 aqueous solution, and the Na2CO3 solution was added dropwise to the suspension solution. After all of this, the turbid solution continued to be mechanically stirred for 1 h, and was then filtered, washed, and dried in a vacuum oven at 100 °C for 2 h. Finally, these carbonate coated lithium-rich materials were heat treated at 400 °C for 3 h in air. According to their different mass ratios (lithium-rich oxide/carbonate), they were designated as samples of 0.5 wt%, 1 wt% and 3 wt%, respectively.Structure characterization
The crystal structures of the samples were identified by powder X-ray diffraction performed using a Philips X’pert pro X-ray diffractometer (Cu-Kα radiation, λ = 1.5418 Å) in the 2θ range from 10° to 70°. The morphologies of the different samples were observed with a scanning electron microscope (SEM, JEOL JSM-6700F) and a transmission electron microscope (TEM, JEOL-2010). The chemical element composition was examined quantitatively by an inductive coupled plasma atomic emission spectrometer (ICP-AES) with an emission spectrometer (Optima 2010 DV, Perkin-Elmer). The specific surface area of the pristine sample was measured by the adsorption–desorption of N2 using an ASAP 2020 instrument. X-ray photoelectron spectroscopy (XPS) was carried out using a Perkin-Elmer RBD upgraded PHI-5000C ESCA system. Curve fitting of the XPS spectra was performed using a CasaXPS program and the binding scale was calibrated from the hydrocarbon contamination using the C 1s peak at 284.8 eV. Differential Scanning Calorimetry (DSC) analysis of the different samples in the delithiated state was carried out on an SDT Q600 from ambient temperature to 400 °C at a rate of 10 °C min−1 under air flow.Electrochemical measurements
The electrode material was prepared with a weight ratio of 80% active material, 10% acetylene black, and 10% binder (polyvinylidene fluoride, PVDF, dissolved in N-methyl-2-pyrrolidone, NMP, in a certain volume). Then, the mixture was stirred for 6 h in a closed environment, and afterwards covered in aluminium foil and dried in a vacuum oven at 120 °C overnight. The 2032-type coin cells were assembled in an argon-filled glove box (H2O < 0.1 ppm, O2 < 0.1 ppm). Metal lithium foil was used as the counter electrode and reference electrode, and a porous Celgard 2325 membrane was used as the separator. The electrolyte consisted of 1 M LiPF6 dissolved in ethylene carbonate (EC), dimethyl carbonate (DMC), and fluoroethylene carbonate (FEC) at a weight ratio of 3![[thin space (1/6-em)]](https://www.rsc.org/images/entities/char_2009.gif) :
:![[thin space (1/6-em)]](https://www.rsc.org/images/entities/char_2009.gif) 5
5![[thin space (1/6-em)]](https://www.rsc.org/images/entities/char_2009.gif) :
:![[thin space (1/6-em)]](https://www.rsc.org/images/entities/char_2009.gif) 2 (Beijing Institute of Chemical Reagents, P. R. China). The constant current charge and discharge mode was achieved with a multichannel battery tester (Shenzhen Neware, BTS, P. R. China) in the voltage range of 2.0–4.6 V. Cyclic voltammetry (CV) was operated between 2.0 and 4.8 V at a 0.1 mV s−1 scanning rate. All electrochemical operations were performed at room temperature.
2 (Beijing Institute of Chemical Reagents, P. R. China). The constant current charge and discharge mode was achieved with a multichannel battery tester (Shenzhen Neware, BTS, P. R. China) in the voltage range of 2.0–4.6 V. Cyclic voltammetry (CV) was operated between 2.0 and 4.8 V at a 0.1 mV s−1 scanning rate. All electrochemical operations were performed at room temperature.
Density functional theory (DFT) calculations
Periodic DFT calculations were carried out based on a norm-conserving pseudo-potential and the Perdew–Wang (PW91) functional in Cambridge Sequential Total Energy Package of Materials Studio (version 8.1). The K–S valence states of Mn (4s3d), O (2s2p), and Li (2s) were expanded in a plane wave basis up to a kinetic energy of 830 eV, while the separation of the k-points is 0.05 Å−1. The results show that the free energy has converged at this precision. As a transition metal, the intensively localized 3d electrons of manganese will produce a self-interaction error within the DFT calculation, which must be corrected. Therefore, a Hubbard Ueff value must be used to describe the interaction of manganese with 3d electrons.29 The empirical value of Ueff was measured by comparing the calculated and experimental LiMO2 crystal structures in this work. When the Ueff value is 0.5 eV, the lattice parameters a (2.8686 Å) and c (14.2745 Å) of LiMO2 after optimization are very close to the experimental values (a: 2.8531 Å, c: 14.2643 Å).Currently, it is still a controversial issue whether lithium-rich layered oxide exists as a solid solution or a composite phase structure. In this calculation, we only intend to study the structural changes of the samples after the diffusion of lithium in the synthesis process, so we consider the structure of LiMO2 (M = Li0.24Ni0.12Co0.13Mn0.51) to be a solid solution. In order to cope with the hexagonal structure of lithium-rich oxides, we also assume that LiMnO2 is in the R![[3 with combining macron]](https://www.rsc.org/images/entities/char_0033_0304.gif) m structure.30,31 Since there are only a small proportion of the lithium ions diffusing from the lithium-rich oxide by heating, the effect on the whole symmetry of the hexagonal structure can be ignored. Therefore, the atomic fractional coordinates were fixed in the optimization.
m structure.30,31 Since there are only a small proportion of the lithium ions diffusing from the lithium-rich oxide by heating, the effect on the whole symmetry of the hexagonal structure can be ignored. Therefore, the atomic fractional coordinates were fixed in the optimization.
3. Results and discussion
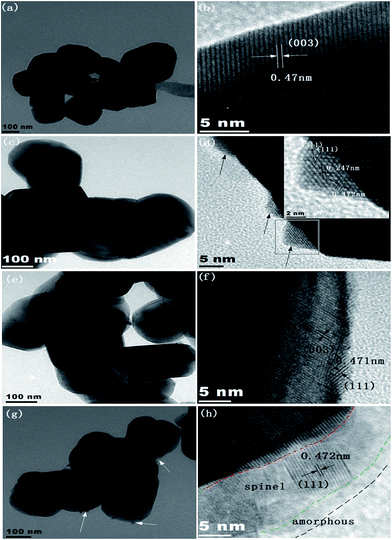
As shown in Fig. S1a,† the lithium-rich layered oxide with micron-sized spherical secondary particles is assembled by primary sub-micron (100–300 nm) particles. The morphology of the samples before and after coating shows almost no change (Fig. S1b–d†). In order to investigate the influence of the coating amount on the surface morphology and structure, the samples were characterized by TEM and HRTEM. The smooth surface of the sub-micron primary particles is observed in the uncoated sample (Fig. 1a). The (003) plane of the lithium-rich oxide with 0.47 nm lattice fringe spacing is clearly shown in Fig. 1b. When 0.5 wt% manganese carbonate is coated, the TEM image shows a negligible morphology change (Fig. 1c). Interestingly, some island-like well-crystalized substances are formed on the particle surface (Fig. 1d), as indicated by the black arrows. The interplanar spacings of the island-like substances are calibrated to be 0.247 and 0.472 nm (see the inset in Fig. 1d), which are consistent with the (311) and (111) planes of cubic spinel. With the coating amount increased to 1 wt%, the HRTEM image indicates that a uniform coating layer is formed on the primary particle surface of the lithium-rich layered oxide (Fig. 1f). The coating layer of about 2 nm thickness clearly presents fine lattice fringes. The interplanar distance is about 0.471 nm, which is well indexed to the (111) plane of cubic spinel. When the coating amount further increases to 3 wt%, some small particles (marked by the white arrows in Fig. 1g) adhere to the surface of the primary particle. It should be pointed out that the coating layer consists of crystal particles and amorphous materials (Fig. 1h). The former is ascribed to the spinel material according to the information provided by the lattice fringes; the latter may be amorphous manganese oxides. Hence, the surface of the 3 wt% sample consists of three components, namely, lithium rich layered oxides (LLOs) as the inner core, spinel material as the intermediate layer, and amorphous manganese oxide as the outer layer.The results shown in Fig. 1 illustrate that different coating amounts result in different shell structures under the present experimental conditions. It is worth briefly discussing the formation of the different shell structures. Firstly, the precursor amount of the coating layer plays an important role. Initially, the surface of a particle is partially covered by the precursor while its concentration is very dilute. By increasing the precursor concentration gradually, the surface is wholly covered, and the thick two-phase separation layer can be formed. Secondly, the reaction temperature and time are crucial. The Li4Mn5O12 spinel layer should result from lithium ions diffusing from the lithium-rich material to the manganese oxides (the intermediate products of the spinel layer). The identification of the Li4Mn5O12 spinel will be highlighted in the following section. Since the experimental temperature is lower, the distance for the lithium ion diffusion is short, so the coating layer formed on the particles is very thin. This may be the reason why amorphous material exists in the coating layer in the 3 wt% sample. Amorphous material may originate from the decomposition of the precursor (MnCO3) at 400 °C.
On the basis of the above discussion, another question is raised now. The departure of partial lithium ions from the lithium-rich oxide should have an influence on the lattice parameters of the lithium-rich oxide. The experimental results demonstrate this point. The XRD patterns, including the Rietveld refinement of the different samples, are shown in Fig. 2a. All peaks can be indexed as the α-NaFeO2 structure with the space group R![[3 with combining macron]](https://www.rsc.org/images/entities/char_0033_0304.gif) m, and the superlattice peak between 20° and 23° is a characteristic of the Li2MnO3-type integrated phase.32–34 To investigate the crystal structure changes of the different samples, Rietveld refinement was carried out using JADE software. Fig. 2b shows the changes in the cell volume V and lattice parameter c values with coating amount. The shrinking variation of the V and c values is roughly linear while the coating amount is up to 1 wt%. After that, the lattice parameters are basically unchanged. This result is in agreement with the observations from the HRTEM (Fig. 1f and h). Thus, the reachable conclusion is that the concentration of lithium ions in the lithium-rich oxide has an influence on its lattice parameters.
m, and the superlattice peak between 20° and 23° is a characteristic of the Li2MnO3-type integrated phase.32–34 To investigate the crystal structure changes of the different samples, Rietveld refinement was carried out using JADE software. Fig. 2b shows the changes in the cell volume V and lattice parameter c values with coating amount. The shrinking variation of the V and c values is roughly linear while the coating amount is up to 1 wt%. After that, the lattice parameters are basically unchanged. This result is in agreement with the observations from the HRTEM (Fig. 1f and h). Thus, the reachable conclusion is that the concentration of lithium ions in the lithium-rich oxide has an influence on its lattice parameters.
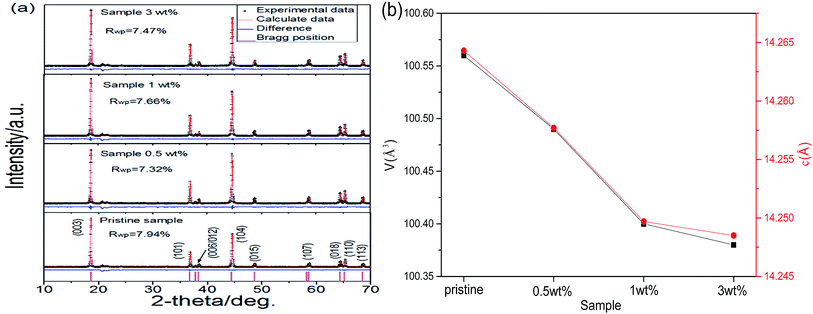 | ||
| Fig. 2 (a) XRD patterns including the Rietveld refinement of different samples. (b) The variations in the volume and c axis. | ||
In order to further understand the origin of the change in the lattice parameters after coating, theoretical calculations were conducted based on DFT. The required lithium ions in the spinel layer (Li4Mn5O12) must be derived from the lithium-rich material by diffusion. Hence, the inner core lithium-rich oxide will certainly suffer from a loss of lithium after the coating treatment. In view of this change in the lithium amount, two models of a 2 × 2 × 1 supercell were constructed (Fig. 3). Since Mn is the main element of the transition metal layer, Mn is used instead of the other metal elements for the simplified calculation. The bulk LiMnO2, which has a normal stoichiometry without a lithium deficiency, is displayed in Fig. 3a. The lithium deficiency model, in which a single lithium atom (red arrow) is removed, is shown in Fig. 3b. DFT optimization gave rise to lattice parameter c values of 14.2745 Å for the normal structure and 14.2037 Å for the lithium deficient structure. This reflects the fact that the decrease in the lithium concentration in the primitive cell tends to reduce the c value of the lattice, which is consistent with the XRD experiment.
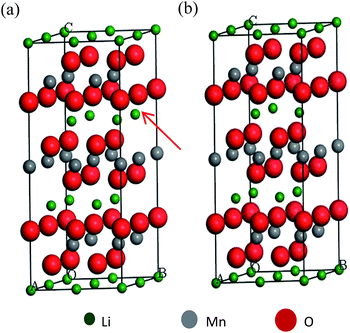 | ||
| Fig. 3 The optimized structure model of a LiMnO2 2 × 2 × 1 supercell, (a) a primitive cell; (b) a lithium atom removed cell. | ||
Based on the analysis of XRD and DFT, it can be concluded that the lattice shrinkage of the coated samples is due to the departure of the lithium atom from the lithium-rich material. Simultaneously, the lithium ion diffusion amount is sensitive to the heating-treatment environment, which results in little change in the lattice parameters between the 3 wt% sample and the 1 wt% sample. Therefore, 1 wt% may be the best coating amount for the formation of a uniform spinel material layer. According to the above assumption, it is necessary to calculate the thickness of the Li4Mn5O12 spinel coated layer in the 1 wt% sample. The thickness of the spinel layer (Li4Mn5O12) can be calculated as well using the following equation:
In this section, surface techniques and electrochemical methods were used to study the spinel material. Fig. 4a shows the X-ray photoelectron spectra of the 1 wt% sample and pristine sample in the Mn 2p region, from which it can be found that both spectra are almost identical to each other. This result indicates that the manganese valence in both samples is the same. The Mn 2p3/2 binding energy is 642.4 eV, which matches well with that of Mn4+, reported in the literature.35 In the O 1s spectra, two peaks are observed in the pristine sample, but only one peak is observed in the 1 wt% sample (Fig. S2†). The small peak located at 531.3 eV is generated from the adsorbed oxygen species (LiOH, LiHCO3, etc.) remaining in the synthesis process of the lithium-rich oxide.36 The spectrum of the 1 wt% sample does not have this peak, indicating that the adsorbed oxygen species have been perfectly covered by the surface spinel material.
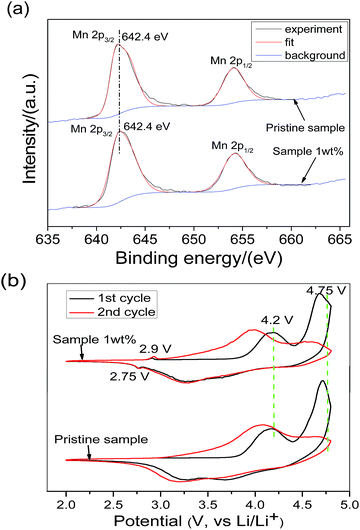 | ||
| Fig. 4 (a) X-ray photoelectron spectra of Mn 2p and (b) the first two cyclic voltammetric curves of the pristine sample and 1 wt% sample. | ||
Fig. 4b shows the initial two cyclic voltammograms of two samples in the voltage range of 2.0–4.8 V and at a scan rate of 0.1 mV s−1. The two samples are basically represented by the characteristic CV curves of the lithium-rich layered oxide, except for the fact that the 1 wt% sample has an extra spinel redox feature peak near 2.75 V/2.9 V.37,38 The oxidation peak at 2.9 V appeared in the first-cycle cyclic voltammetry curve of the 1 wt% sample, suggesting that the coated substance is a lithium intercalated cathode material. At the same time, the redox peaks of the spinels LiMn2O4 and LiNi0.5Mn1.5O4 are not observed in the 1 wt% sample around 4.2 V and 4.75 V. According to the results of the XPS and CV, it can be concluded that the surface coating crystal material is the spinel Li4Mn5O12.
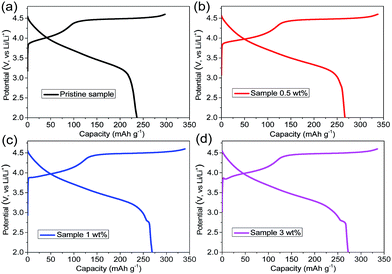
The initial charge/discharge curves of the four samples were recorded under a current density of 20 mA g−1 (0.1C) in a voltage range of 2.0–4.6 V (Fig. 5). The pristine sample exhibits the typical charge/discharge curves of lithium-rich layered oxides, which consist of an uphill sloping curve below 4.4 V, a potential platform between 4.4 V and 4.6 V during charging, and a continuous downhill sloping curve during discharging.39–41 In addition to the typical charge–discharge curves of the lithium-rich material, the 1 wt% and 3 wt% samples also possess small discharge platforms near 2.8 V in the discharge curve, agreeing with the observations made from Fig. 4b. However, this small discharge plateau does not appear for the 0.5 wt% sample. It is indeed observed in the curve of the differential capacity versus voltage plot (Fig. S3†). Therefore, the disappearance of this small platform in the discharge curve may be due to the amount of spinel being too little and the insensitivity of the electrochemical discharge curve. Furthermore, compared with the initial discharge capacity of the pristine sample (236.4 mA h g−1), the higher initial discharge capacities of the three coated samples are 266.7 mA h g−1 (0.5 wt% sample), 269.1 mA h g−1 (1 wt% sample), and 272.4 mA h g−1 (3 wt% sample), respectively. Interestingly, the initial discharge capacity rises along with the increase in the coating amount. It is well known that the discharge capacity of lithium-rich cathode materials is closely related to their chemical composition. The chemical compositions of the four samples were quantitatively analyzed by ICP. As shown in Table 1, the ICP results show that the manganese content in the lithium-rich oxides increases with increasing coating amount. Hence, the increased capacity should be ascribed to the reduction of more Mn4+. In particular, the coating layer maintains a lot of lithium vacancies, resulting in the higher capacity of the coated samples.11,42 Meanwhile, lithium-rich materials also produce some lithium vacancies in the formation of the spinel layer. These lithium vacancies will provide more sites for Li ion intercalation in the discharge process, which also results in the increase of the initial discharge capacity of the coated samples.
| Metal element content | Chemical composition | ||||
|---|---|---|---|---|---|
| Samples | Li | Ni | Co | Mn | |
| Pristine sample | 1.237 | 0.124 | 0.125 | 0.514 | Li1.237Ni0.124Co0.125Mn0.514O2 |
| 0.5 wt% sample | 1.220 | 0.124 | 0.127 | 0.529 | Li1.220Ni0.124Co0.127Mn0.529O2 |
| 1 wt% sample | 1.213 | 0.125 | 0.127 | 0.535 | Li1.213Ni0.125Co0.127Mn0.535O2 |
| 3 wt% sample | 1.210 | 0.121 | 0.124 | 0.545 | Li1.210Ni0.121Co0.124Mn0.545O2 |
Fig. 6a shows the discharge capacities of the different samples measured at different current densities. It is found that the 1 wt% sample has the most superior rate performance, and maintains the maximum discharge capacities of 254 mA h g−1, 233.7 mA h g−1, 209.9 mA h g−1, and 166.8 mA h g−1 at 0.5C, 1C, 2C, and 5C, respectively. In particular, the high rate performances of the 0.5 wt% and 1 wt% samples are significantly better than those of the 3 wt% sample and pristine sample. This is due to the fact that the spinel structure has a three-dimensional channel for the transportation of lithium ions, which leads to the 0.5 wt% and 1 wt% samples having elevated rate discharge capacities. Even at a rate of 10C, the discharge capacity of the 1 wt% sample can still reach 86.6 mA h g−1 (Fig. S4†). Simultaneously, the diffusion of lithium ions is seriously hindered by the outer layer of the amorphous manganese oxide in the 3 wt% sample, resulting in the poor rate performance. The rate discharge capacity of the 1 wt% sample is higher than that of the 0.5 wt% sample, which can be attributed to the fact that the 1 wt% sample possesses a more uniform spinel coating and more channels for the transmission of lithium ions. After a certain cycle back to 0.1C, the discharge capacity of the 1 wt% sample can reach as high as 267.3 mA h g−1, showing its excellent electrochemical reversibility.
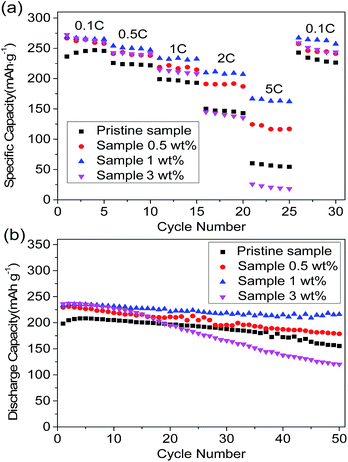 | ||
| Fig. 6 (a) Rate performance of different samples at various discharge rates. (b) Cyclic performance of different samples at a 1C discharge rate. | ||
The cycling performance of the different samples was studied at a discharge current density of 200 mA g−1 in a voltage range of 2.0–4.6 V (Fig. 6b). The initial discharge capacity of the 1 wt% sample can reach 233.2 mA h g−1 and, after 50 cycles, the discharge capacity can be maintained at 216 mA h g−1 (capacity retention of 92.6%). The initial discharge capacities of the pristine sample, 0.5 wt% sample, and 3 wt% sample are 198.2 mA h g−1, 229.4 mA h g−1, and 236.1 mA h g−1, and the capacity retention rate could be respectively maintained at 78.4%, 77.9%, and 50.9% after 50 cycles. It can be suggested that the cycling performance of the 1 wt% sample is far more advanced than that of the other samples. The improvement in the cycle performance is attributed to the uniform spinel coating layer that protects the lithium-rich cathode material from corrosion by the electrolyte. Meanwhile, the surfaces of the pristine and “island-type coated” samples are attacked by the HF in the electrolyte.
The thermal stability of the electrode material is of great concern in terms of the safety of lithium ion batteries. DSC is a useful instrument for recording the thermal reaction between the electrode material and the electrolyte.43 Fig. 7 shows the DSC curves of the pristine sample and 1 wt% sample during the initial charge to 4.6 V. The main exothermic peak is near 315.9 °C for the pristine sample, but this peak shifts to 334.4 °C for the 1 wt% sample. On the other hand, the amount of heat produced by the 1 wt% sample is obviously less than that of the pristine sample if we compare the area of the main exothermic peak. These results suggest that the uniform spinel coating layer can effectively improve the thermal stability of the lithium-rich cathode material.
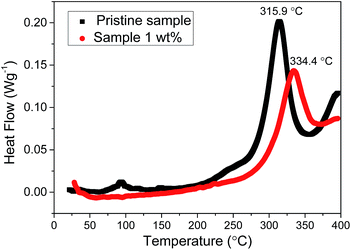 | ||
| Fig. 7 DSC curves of the pristine sample and 1 wt% sample at a charge of 4.6 V and a heating rate of 10 °C min−1. | ||
4. Conclusions
In summary, with a variation in the coating amount, the shell structures of the coated samples differ greatly. Through analysis using HRTEM, XRD, and DFT theory calculation, the different shell structures may originate from (1) the limited diffusion of lithium ions from the lithium-rich layered oxide to the coating layer under certain heat-treatment conditions, and (2) the coating amount. The Li4Mn5O12 spinel is formed in the coating layer. The sample with the uniform Li4Mn5O12 spinel coating layer shows the most excellent electrochemical performance. The initial discharge specific capacity of the 1 wt% sample is as high as 269.1 mA h g−1 in the voltage range of 2.0–4.6 V. Even at a rate of 1C, its discharge capacity can still reach up to 233.2 mA h g−1, and the capacity retention rate is 92.6% after 50 cycles. Meanwhile, the uniform spinel crystal coated layer can greatly improve the thermal stability of the lithium-rich layered oxide. In addition, it is worth further studying how a thin coating layer can affect the lattice parameters of micro/nano core materials for other material systems.Conflicts of interest
There are no conflicts to declare.Acknowledgements
This work was supported by the Science and Technology Foundation of Jiangsu (BK20151237), the special nano-technology of Suzhou (ZXG2013004), USTC-NSRL Association funding, and the Collaborative Innovation Centre of Suzhou Nano Science and Technology.Notes and references
- M. Armand and J. M. Tarascon, Nature, 2008, 451, 652–657 CrossRef PubMed.
- A. S. Arico, P. Bruce, B. Scrosati, J. M. Tarascon and W. Van Schalkwijk, Nat. Mater., 2005, 4, 366–377 CrossRef PubMed.
- H. J. Yu, R. Ishikawa, Y. G. So, N. Shibata, T. Kudo, H. S. Zhou and Y. Ikuhara, Angew. Chem., Int. Ed., 2013, 52, 5969–5973 CrossRef PubMed.
- M. Gu, A. Genc, I. Belharouak, D. Wang, K. Amine, S. Thevuthasan, D. R. Baer, J. G. Zhang, N. D. Browning, J. Liu and C. Wang, Chem. Mater., 2013, 25, 2319–2326 CrossRef.
- N.-S. Choi, J.-G. Han, S.-Y. Ha, I. Park and C.-K. Back, RSC Adv., 2015, 5, 2732–2748 RSC.
- M. Sathiya, G. Rousse, K. Ramesha, C. P. Laisa, H. Vezin, M. T. Sougrati, M. L. Doublet, D. Foix, D. Gonbeau, W. Walker, A. S. Prakash, M. Ben Hassine, L. Dupont and J. M. Tarascon, Nat. Mater., 2013, 12, 827–835 CrossRef PubMed.
- B. Xu, C. R. Fell, M. Chi and Y. S. Meng, Energy Environ. Sci., 2011, 4, 2223–2233 Search PubMed.
- H. Yu and H. Zhou, J. Phys. Chem. Lett., 2013, 4, 1268–1280 CrossRef PubMed.
- C. Yang, Q. Zhang, W. X. Ding, J. Zang, M. Lei, M. S. Zheng and Q. F. Dong, J. Mater. Chem. A, 2015, 3, 7554–7559 Search PubMed.
- W. Yuan, H. Z. Zhang, Q. Liu, G. R. Li and X. P. Gao, Electrochim. Acta, 2014, 135, 199–207 CrossRef.
- F. Wu, N. Li, Y. Su, H. Lu, L. Zhang, R. An, Z. Wang, L. Bao and S. Chen, J. Mater. Chem., 2012, 22, 1489–1497 RSC.
- Y.-K. Sun, M.-J. Lee, C. S. Yoon, J. Hassoun, K. Amine and B. Scrosati, Adv. Mater., 2012, 24, 1192–1196 CrossRef PubMed.
- H. P. Guo, L. Hu, X. Yi, B. W. Ju, H. Hu, D. Wang and R. Z. Yu, J. Solid State Electrochem., 2014, 18, 1789–1797 CrossRef.
- B. Li, H. Yan, J. Ma, P. Yu, D. Xia, W. Huang, W. Chu and Z. Wu, Adv. Funct. Mater., 2014, 24, 5112–5118 CrossRef.
- C. W. Wang, X. L. Ma, J. G. Cheng, L. Q. Zhou, J. T. Sun and Y. H. Zhou, Solid State Ionics, 2016, 177, 1027–1031 CrossRef.
- P. G. Bruce, B. Scrosati and J.-M. Tarascon, Angew. Chem., Int. Ed., 2008, 47, 2930–2946 CrossRef PubMed.
- M. G. Kim, M. Jo, Y. S. Hong and J. Cho, Chem. Commun., 2009, 45, 218–220 RSC.
- S. H. Kang, C. S. Johnson, J. T. Vaughey, K. Amine and M. M. Thackeray, J. Electrochem. Soc., 2006, 153, A1186–A1192 CrossRef.
- J. Gao and A. Manthiram, J. Power Sources, 2009, 191, 644–647 CrossRef.
- Y. Wu and A. Manthiram, Solid State Ionics, 2009, 180, 50–56 CrossRef.
- P. K. Nayak, J. Grinblat, M. Levi and D. Aurbach, Electrochim. Acta, 2014, 137, 546–556 CrossRef.
- B. H. Song, C. F. Zhou, Y. Chen, Z. W. Liu, M. O. Lai, J. M. Xue and L. Lu, RSC Adv., 2014, 4, 44244–44252 RSC.
- M. M. Thackeray, Nat. Mater., 2002, 1, 81–82 CrossRef PubMed.
- A. Kraytsberg and Y. Ein-Eli, Adv. Energy Mater., 2012, 2, 922–939 CrossRef.
- F. Wu, N. Li, Y. F. Su, L. J. Zhang, L. Y. Bao, J. Wang, L. Chen, Y. Zheng, L. Q. Dai, J. Y. Peng and S. Chen, Nano Lett., 2014, 14, 3550–3555 CrossRef PubMed.
- F. Wu, N. Li, Y. F. Su, H. F. Shou, L. Y. Bao, W. Yang, L. J. Zhang, R. An and S. Chen, Adv. Mater., 2013, 25, 3722–3726 CrossRef PubMed.
- Z. Q. Xie, S. Ellis, W. W. Xu, D. Dye, J. Q. Zhao and Y. Wang, Chem. Commun., 2015, 51, 15000–15003 RSC.
- T. Takata, H. Hayakawa, T. Kumagai and E. Akiba, J. Solid State Chem., 1996, 121, 79–86 CrossRef.
- S. L. Dudarev, G. A. Botton, S. Y. Savrasov, C. J. Humphreys and A. P. Sutton, Phys. Rev. B: Condens. Matter Mater. Phys., 1998, 57, 1505–1509 CrossRef.
- Z. Huang, F. Du, C. Wang, D. Wang and G. Chen, Phys. Rev. B: Condens. Matter Mater. Phys., 2007, 75, 054411–054417 CrossRef.
- N. N. Shukla and R. Prasad, J. Phys. Chem. Solids, 2006, 67, 1731–1740 CrossRef.
- J. S. Kim, C. S. Johnson, J. T. Vaughey, M. M. Thackeray, S. A. Hackney, W. Yoon and C. P. Grey, Chem. Mater., 2004, 16, 1996–2006 CrossRef.
- W. S. Yoon, S. Iannopollo, C. P. Grey, D. Carlier, J. Gorman, J. Reed and G. Ceder, Electrochem. Solid-State Lett., 2004, 7, A167–A171 CrossRef.
- X. Yang, D. Wang, R. Yu, Y. Bai, H. Shu, L. Ge, H. Guo, Q. Wei, L. Liu and X. Wang, J. Mater. Chem. A, 2014, 2, 3899–3911 Search PubMed.
- E. Regan, T. Groutso, J. B. Metson, R. Steiner, B. Ammundsen, D. Hassell and P. Picking, Surf. Interface Anal., 1999, 27, 1064–1068 CrossRef.
- H. Liu, Y. Yang and J. Zhang, J. Power Sources, 2006, 162, 644–650 CrossRef.
- M. M. Thackeray, A. Kock, M. H. Rossouw, D. Liles, R. Bittihn and D. Hoge, J. Electrochem. Soc., 1992, 139, 363–366 CrossRef.
- Y.-K. Sun, Y.-S. Jeon and H. J. Lee, Electrochem. Solid-State Lett., 2000, 3, 7–9 CrossRef.
- Q. Y. Wang, J. Liu, A. V. Murugan and A. Manthiram, J. Mater. Chem., 2009, 19, 4965–4972 RSC.
- A. R. Armstrong, M. Holzapfel, P. Novak, C. S. Johnson, S. H. Kang, M. M. Thackeray and P. G. Bruce, J. Am. Chem. Soc., 2006, 128, 8694–8698 CrossRef PubMed.
- S. J. Shi, J. P. Tu, Y. Y. Tang, X. Y. Liu, Y. Q. Zhang, X. L. Wang and C. D. Gu, Electrochim. Acta, 2013, 88, 671–679 CrossRef.
- S. Lee, Y. Cho, H.-K. Song, K. T. Lee and J. Cho, Angew. Chem., Int. Ed., 2012, 51, 8748–8752 CrossRef PubMed.
- H. F. Xiang, B. Yin, H. Wang, H. W. Lin, X. W. Ge, S. Xie and C. H. Chen, Electrochim. Acta, 2010, 55, 5204–5209 CrossRef.
Footnote |
| † Electronic supplementary information (ESI) available. See DOI: 10.1039/c8ra03038c |
| This journal is © The Royal Society of Chemistry 2018 |

