DOI:
10.1039/C8RA03062F
(Paper)
RSC Adv., 2018,
8, 18597-18603
A study on LiFePO4/graphite cells with built-in Li4Ti5O12 reference electrodes†
Received
10th April 2018
, Accepted 8th May 2018
First published on 22nd May 2018
Abstract
In this work, based on the superior electrochemical stability of Li4Ti5O12 (LTO) electrodes, LiFePO4 (LFP)/graphite cells with built-in LTO electrodes as reference electrodes were designed and fabricated. The characteristics of the LTO reference electrodes in the fabricated lithium-ion cells were measured and discussed. The experimental data demonstrated that the LTO built-in reference electrodes were simple to prepare and were feasible options for long-term in situ monitoring of the development of potentials and other electrochemical parameters, such as the Li+ diffusion coefficient (DLi) and electrochemical impedance spectroscopy (EIS) information, for both anodes and cathodes. Moreover, it is believed that the adoption of LTO as a reference electrode could be of great significance for long-term monitoring of the charge and discharge behavior of individual electrodes in other kinds of lithium-ion cells.
Introduction
In order to study the performance and aging behavior of individual electrodes in lithium-ion cells, a reference electrode is a necessity. A coin type half cell is the simplest design for these studies, and Swagelok cells are popular types of two-electrode cells.1 However, they are only useful for single electrode studies with either a positive or a negative electrode. Three-electrode systems of various designs are used to study positive and negative electrodes at the same time. Metal lithium is widely used for counter and/or reference electrodes in half-cell studies and measurements. There are two main drawbacks or disadvantages of using metal lithium as a reference electrode. First, metal lithium is very active in air; the handling of it and the assembly of the half cells must be conducted in a dry room or a glove box filled with an inert gas such as argon. Second, when metal lithium is used as a reference electrode, unstable performance data such as impedance data may be recorded during long-term measurements and especially when the temperature is very low. D. P. Abraham et al. used lithium-preloaded Li4/3Ti5/3O4 for counter and reference electrodes2 to overcome the drawbacks of metal lithium during temperature changes. A. N. Jansen et al. used in situ LiySn alloy reference electrodes to study the charge performance of lithium cells at low temperatures.3,4 Li4Ti5O12 (LTO) is considered as a reliable substitute for metal lithium for reference electrodes, as it avoids the adverse effects of metal lithium during measurement.5–8 M. C. Smart et al. used three-cell O-ring sealed glass cells to study the effects of electrolyte composition on lithium plating.9 H. M. Cho et al. used LTO as a reference electrode. They considered that two-electrode cells which used metal lithium as both counter and reference electrodes are not reliable for impedance measurements, especially at low temperatures and after aging.5
The main drawbacks of metal lithium as a reference electrode can be summarized as follows:10 (a) impedance increases with aging and it takes time to stabilize; (b) the impedance of lithium electrodes changes with temperature and cycling, and is unstable or not reproducible; (c) metal lithium must be handled in a dry room with very low humidity or in a glove-box filled with an inert gas such as argon. On the other hand, the main drawbacks of two-electrode contained metal lithium reference electrodes can be summarized as follows: (a) the impedance of metal lithium interferes with the accurate measurement of the study electrodes; (b) the cell being used for the study must be disassembled in order to study the individual electrodes in the cell and in situ measurement is not possible.
In the above-mentioned situations, the cells have to be disassembled and the positive and negative electrodes must be taken out and re-assembled into half cells or new cells for further research. This is a destructive approach which is neither convenient nor effective if it is necessary to monitor the behavior of electrodes or record in situ measurements long-term. For in situ studies, several special designs for cells were proposed. J. Zhou et al. applied an electrochemical deposition method to develop a metal lithium micro-reference electrode on insulation-coated copper wire, which was put in between positive and negative electrodes.10 The process and controlling parameters are complex in order to achieve a uniform layer of metal lithium. Furthermore, metal lithium will be consumed during the measurement process; it has to be re-deposited repeatedly. Moreover, P. Liu et al. described a complex but useful setup to monitor in situ the potential change in individual electrodes during charging and discharging.11 A similar tool is also presented by Y. Zhang et al.12 However, this is a destructive approach as the cell cap and end cover need to be removed to expose the cell elements, and all of the setting-up must be conducted in a dry room or an inert-gas glove box.
The purpose of this paper is to introduce a cell design which incorporates an LTO reference electrode. This electrode can be easily constructed and recharged for monitoring the electrochemical behavior of lithium-ion cells in situ. The feasibility was confirmed through various electrochemical tests and measurements in LiFePO4 (LFP)/graphite cells. A comparison of the LTO reference electrode used in this work with others reported in previous studies is summarized in Table S1.†
Experimental
Fabrication of half cells and LFP/graphite cells with built-in LTO reference electrodes
a. Fabrication of LFP positive electrodes. Commercial LiFePO4 powder (BTR, China) and a conducting carbon material (SP![[thin space (1/6-em)]](https://www.rsc.org/images/entities/char_2009.gif) :
:![[thin space (1/6-em)]](https://www.rsc.org/images/entities/char_2009.gif) KS-6 = 1
KS-6 = 1![[thin space (1/6-em)]](https://www.rsc.org/images/entities/char_2009.gif) :
:![[thin space (1/6-em)]](https://www.rsc.org/images/entities/char_2009.gif) 1) were mixed with polyvinylidene fluoride (PVDF) as an adhesive to make a positive slurry in a weight ratio of 8
1) were mixed with polyvinylidene fluoride (PVDF) as an adhesive to make a positive slurry in a weight ratio of 8![[thin space (1/6-em)]](https://www.rsc.org/images/entities/char_2009.gif) :
:![[thin space (1/6-em)]](https://www.rsc.org/images/entities/char_2009.gif) 1
1![[thin space (1/6-em)]](https://www.rsc.org/images/entities/char_2009.gif) :
:![[thin space (1/6-em)]](https://www.rsc.org/images/entities/char_2009.gif) 1 using N-methylpyrrolidone (NMP) as the solvent. The positive slurry was coated on aluminum foil sheets (with thicknesses of 10 μm). Then, the sheets were dried and rolled to make LFP positive electrodes.
1 using N-methylpyrrolidone (NMP) as the solvent. The positive slurry was coated on aluminum foil sheets (with thicknesses of 10 μm). Then, the sheets were dried and rolled to make LFP positive electrodes.
b. Fabrication of graphite negative electrodes (AG). Commercial artificial graphite (Shanshan Tech, China CAG-3) and a conducting carbon material (SP) were mixed with an adhesive (carboxymethyl cellulose![[thin space (1/6-em)]](https://www.rsc.org/images/entities/char_2009.gif) :
:![[thin space (1/6-em)]](https://www.rsc.org/images/entities/char_2009.gif) styrene-butadiene rubber = 1.5
styrene-butadiene rubber = 1.5![[thin space (1/6-em)]](https://www.rsc.org/images/entities/char_2009.gif) :
:![[thin space (1/6-em)]](https://www.rsc.org/images/entities/char_2009.gif) 1.2) to make a negative slurry in a weight ratio of 95
1.2) to make a negative slurry in a weight ratio of 95![[thin space (1/6-em)]](https://www.rsc.org/images/entities/char_2009.gif) :
:![[thin space (1/6-em)]](https://www.rsc.org/images/entities/char_2009.gif) 2.3
2.3![[thin space (1/6-em)]](https://www.rsc.org/images/entities/char_2009.gif) :
:![[thin space (1/6-em)]](https://www.rsc.org/images/entities/char_2009.gif) 2.7 using water as the solvent. The negative slurry was coated on copper foil sheets. Then, the sheets were dried and rolled to make AG negative electrodes.
2.7 using water as the solvent. The negative slurry was coated on copper foil sheets. Then, the sheets were dried and rolled to make AG negative electrodes.
c. Fabrication of LTO negative electrodes (as the reference electrode). Commercial LTO powder (BTR, China) and a conducting carbon material (SP![[thin space (1/6-em)]](https://www.rsc.org/images/entities/char_2009.gif) :
:![[thin space (1/6-em)]](https://www.rsc.org/images/entities/char_2009.gif) KS-6 = 2.5
KS-6 = 2.5![[thin space (1/6-em)]](https://www.rsc.org/images/entities/char_2009.gif) :
:![[thin space (1/6-em)]](https://www.rsc.org/images/entities/char_2009.gif) 1.2) were mixed with PVDF (Solef 5130) as an adhesive to make a negative slurry in a weight ratio of 92.5
1.2) were mixed with PVDF (Solef 5130) as an adhesive to make a negative slurry in a weight ratio of 92.5![[thin space (1/6-em)]](https://www.rsc.org/images/entities/char_2009.gif) :
:![[thin space (1/6-em)]](https://www.rsc.org/images/entities/char_2009.gif) 3.7
3.7![[thin space (1/6-em)]](https://www.rsc.org/images/entities/char_2009.gif) :
:![[thin space (1/6-em)]](https://www.rsc.org/images/entities/char_2009.gif) 3.8 using NMP as the solvent. The negative slurry was coated on copper foil sheets. Then, the sheets were dried and rolled to make LTO negative electrodes.
3.8 using NMP as the solvent. The negative slurry was coated on copper foil sheets. Then, the sheets were dried and rolled to make LTO negative electrodes.
d. Fabrication of half cells. CR2032 coin cells were assembled with the above prepared electrodes as the working electrodes, metal lithium as the counter electrodes, Celgard 2400 (polypropylene) as a separator, and an EC/DMC/DEC-based (1![[thin space (1/6-em)]](https://www.rsc.org/images/entities/char_2009.gif) :
:![[thin space (1/6-em)]](https://www.rsc.org/images/entities/char_2009.gif) 1
1![[thin space (1/6-em)]](https://www.rsc.org/images/entities/char_2009.gif) :
:![[thin space (1/6-em)]](https://www.rsc.org/images/entities/char_2009.gif) 1 by volume) electrolyte with 1 M of dissolved LiPF6. The design capacity at 0.2C is 1.5 mA h for the LFP positive electrodes, and 2.2 mA h for graphite and the LTO negative electrodes.
1 by volume) electrolyte with 1 M of dissolved LiPF6. The design capacity at 0.2C is 1.5 mA h for the LFP positive electrodes, and 2.2 mA h for graphite and the LTO negative electrodes.
e. Fabrication of full cells. Soft package full cells were assembled with the above prepared LFP electrodes as the cathodes, the graphite electrodes as the anodes and the LTO electrodes as the reference electrodes using the same separator and electrolyte as the half cells, as illustrated in Fig. 1. The sizes of the assembled soft package full cells were 65 mm for length, 60 mm for width and 8 mm for thickness. The design capacity of the LFP/graphite inner cells at 0.2C is 1000 mA h, and the design capacity of the LFP/LTO inner cells at 0.2C is 700 mA h.
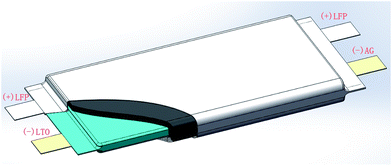 |
| | Fig. 1 Schematic of a LFP/graphite full cell with a built-in LTO reference electrode. | |
Measurements and tests of the half cells and full cells
The electrochemical performance and behavior of the fabricated half cells and full cells were measured and tested using a Battery Testing System (LAND, CT2001A, China) and an electrochemical workstation (CHI760E, Shanghai Chenhua Instrument Co., Ltd, China).
a. Initial charge/discharge performance of the half cells. The fabricated half cells were charged and discharged at 25 °C with a current of 0.015 mA. The potential ranges were 2.5–4.2 V (vs. Li+/Li) and 0.01–2.0 V (vs. Li+/Li) for the positive electrodes and the negative electrodes, respectively.
b. Initial charge/discharge performance of the full cells. The fabricated full cells with LTO as the reference electrodes were charged and discharged at 25 °C in a charge current range of 0.2C to 3.65 V (vs. Li+/Li) and a discharge current range of 0.1C to 2.0 V (vs. Li+/Li).
c. Potential information of the LTO half cells at different temperatures. The potential information of the fabricated LTO half cells was measured and collected at −20 °C, −10 °C, 0 °C, 10 °C, 25 °C, 35 °C, 45 °C, 55 °C and 65 °C. For each temperature, the LTO half cells were kept for 4 h at a preset temperature to obtain an internal temperature balance.
d. Open circuit voltage (OCV) of the LTO half cells. The potential decline of the LTO half cells was measured and recorded for 30 days at 25 °C and 45 °C, respectively. The OCV of the LTO half cells was recorded every day.
e. Open circuit voltage (OCV) of the LFP/graphite and the LFP/LTO cells. The potential decline of the LFP/graphite and the LFP/LTO cells was measured and recorded for 90 days at 25 °C and 45 °C, respectively. The OCV of the LFP/graphite and the LFP/LTO cells was recorded every day.
f. Charge/discharge curves of the fabricated full cells. The full cells were charged at different current rates (0.2C, 0.8C and 1.6C) with voltages up to 3.85 V (vs. Li+/Li), and further charged until the charge current declined to 0.05C. The cells were then discharged to 2.0 V (vs. Li+/Li).
g. Li+ diffusion coefficient (DLi) measured by galvanostatic intermittent titration technique (GITT). The fully charged cells were discharged at a current of 0.1C to an end voltage of 2.0 V (vs. Li+/Li). Then, the cells were kept under 20 °C, 0 °C, −10 °C and −20 °C for 5 h. The OCV of the cells and the potential of the LFP positive and graphite negative electrodes against the LTO reference electrodes were measured. The cells were charged with a current rate of 0.2C for 1.5 h at 20 °C and 0 °C; the cells were charged with a current rate of 0.1C for 1.5 h at −10 °C; the cells were charged with a current rate of 0.05C for 1.5 h at −20 °C, respectively. The cells were kept on standby for 4 h after charging, then the cell voltage (Vt), and the positive potential (Et+) and negative potential (Et−) against the LTO reference electrodes were measured. Under open-circuit conditions, the cells were kept on standby for 5 h, then the OCV of the cells (OCVt) and the positive potential (OCVt+) and negative potential (OCVt−) were measured. The above steps were repeated until the charging voltage of the cells reached 3.85 V (vs. Li+/Li).
h. Electrochemical impedance spectroscopy (EIS) of the cells. EIS measurements were performed over a frequency range of 100 kHz to 10 mHz with an applied amplitude of 5 mV under temperatures of 20 °C, 0 °C, −10 °C and −20 °C at states of charge (SOC) of 00%, 50% and 0% (the fully charged cells were discharged at a current of 0.25C for 2 h to get 50% SOC and for 4 h to get 0% SOC).
Results and discussion
Potential and potential stability of LTO electrodes
Fig. 2a shows the OCV of the fabricated LTO half cells at different temperatures. It can been seen that the OCV of the LTO half cells at different temperatures ranging from −20 °C to 65 °C was quite stable. Fig. 2b shows the OCV of the LTO half cells at 25 °C and 45 °C for 30 days. It can be seen that the OCV of the LTO half cells was stable over a long period of time, and over a wide range of temperatures. The observed difference was less than 2%. Actually, the electrochemical potential of LTO is around 1.55 V (vs. Li+/Li), much higher than that of graphite in the electrolyte; there are no side reactions such as solid electrolyte interphase (SEI) film formation on its surface, so the potential would be maintained as stable. This means the LTO electrode could be used as a reference electrode for the long-term monitoring of voltage and the potential of the individual target electrode, with accuracy that could be accepted in most cases. Fig. 2c and d show the OCV of the LFP/graphite cells and the LFP/LTO cells at 25 °C and 45 °C for 90 days, respectively. It can be seen that the open circuit voltage of the LFP/graphite cell obviously fluctuated with time because of the graphite electrode, mostly arising from the change of SEI film on its surface. By comparing Fig. 2c and d, the stability of the LTO electrode potential was also verified in the LFP/LTO cell. For practical applications, when the potential of the LTO electrode declines to some given point, it’s easy to recharge it and recover its potential platform.
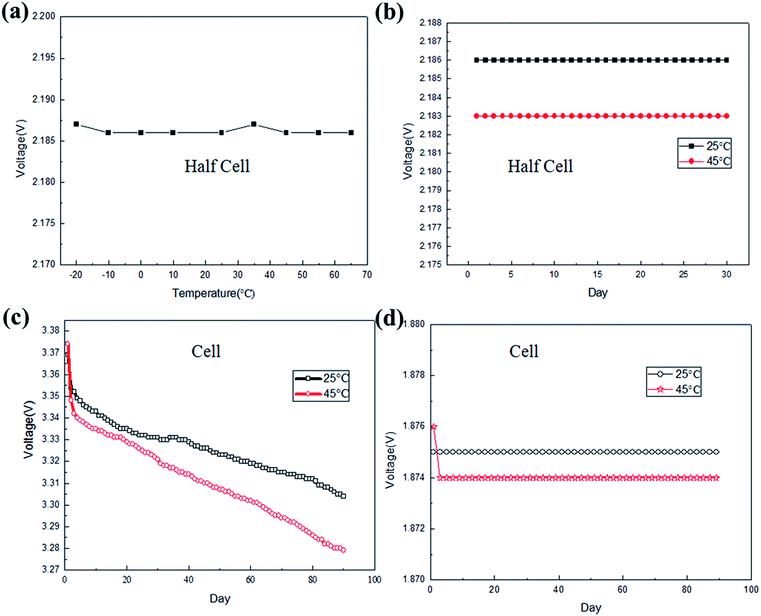 |
| | Fig. 2 Potential information of the fabricated half cells and full cells at different temperatures: (a) the OCV of the fabricated LTO half cells at different temperatures; (b) the OCV of the LTO half cells at 25 °C and 45 °C for 30 days; (c) the OCV of the LFP/graphite cells at 25 °C and 45 °C for 90 days; (d) the OCV of the LFP/LTO cells at 25 °C and 45 °C for 90 days. | |
Charging voltage curves of the LFP/graphite cells
Fig. 3 shows the charging voltage curves of the LFP/graphite cells with charge current rates of 0.2C, 0.8C and 1.6C. Fig. 4 shows the discharge voltage curves of the LFP/graphite cells with charge current rates of 0.2C, 0.8C and 1.6C and a discharge current rate of 0.1C. Fig. 5 shows the potential curves of the individual electrodes during charging and discharging with charge current rates of 0.2C, 0.8C and 1.6C and a discharge current rate of 0.1C, measured against the LTO electrode. Comparing Fig. 5 with Fig. 3 and 4, it can be seen that the individual potentials of the positive and negative electrodes coincide well with the cell voltage. Thus, the effectiveness of LTO as a reference electrode was confirmed. The voltage of the cell could be arithmetically calculated from the potentials of the positive electrode and the negative electrode. The changes in the individual electrode potentials could be effectively monitored and compared during the cell charge and discharge process.
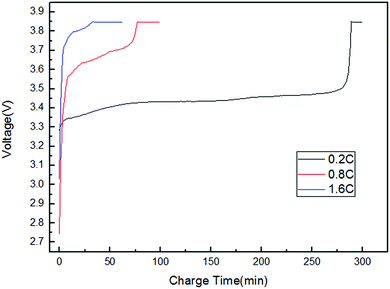 |
| | Fig. 3 The charging voltage curves of the LFP/graphite cells with charge current rates of 0.2C, 0.8C and 1.6C. | |
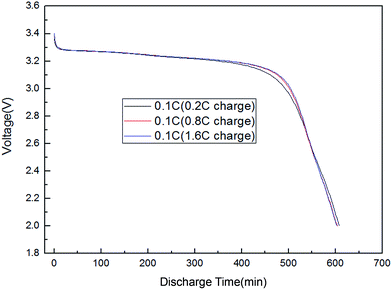 |
| | Fig. 4 The discharge voltage curves of the LFP/graphite cells with charge current rates of 0.2C, 0.8C and 1.6C and a discharge current rate of 0.1C. | |
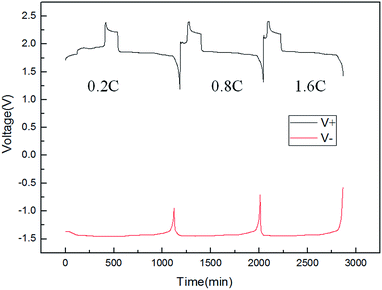 |
| | Fig. 5 The potential curves of the individual electrodes during charging and discharging with charge current rates of 0.2C, 0.8C and 1.6C and a discharge current rate of 0.1C, measured against the LTO electrode. | |
Li+ diffusion coefficient (DLi) measured by GITT
The principle of measurement for the Li+ diffusion coefficient (DLi) by GITT was previously discussed in the literature12 and is shown in Fig. 6. Accordingly, DLi could be calculated by the equation shown in Fig. 6b.
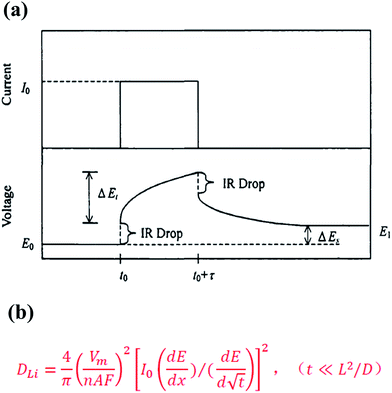 |
| | Fig. 6 (a) The principle of measurement for DLi by GITT as previously discussed in the literature;12 (b) the equation for calculating DLi. | |
The tested curves of potential generated using GITT measurements at different temperatures (20 °C, 0 °C, −10 °C and −20 °C) are shown in Fig. 7. Fig. 8 shows the calculated DLi at different temperatures in the LFP electrode and the graphite electrode. The measured values of DLi were lower than the reported ones.13–21 This was because the influence of an adhesive on the actual electrode makes the active surface area of the active material in the fabricated electrode much smaller than that without an adhesive. An adhesive in the electrode material would stick to the surface of the active material and greatly reduce the real surface area. Thus, the calculated DLi was smaller. However, it should be noted that the obtained DLi values were the real ones for the practical electrodes in full cell system. Also, the calculated DLi could be used to estimate the charging acceptance current at low temperatures. The charging current must be lower than the charging acceptance to prevent the deposition of metal lithium during charging, especially under low temperatures.
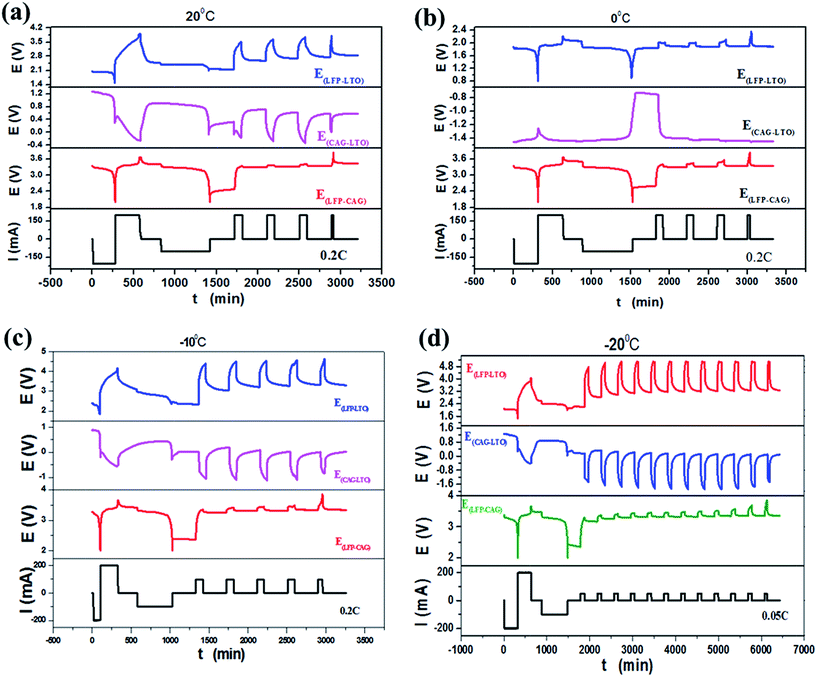 |
| | Fig. 7 The tested curves of potential generated using GITT measurements at different temperatures: (a) 20 °C, (b) 0 °C, (c) −10 °C and (d) −20 °C. | |
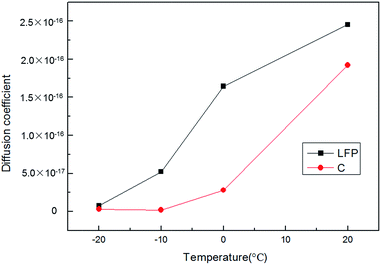 |
| | Fig. 8 The calculated DLi at different temperatures in the LFP electrode and the graphite electrode. | |
The results, as shown in Fig. 8, confirmed that the calculated DLi in the LFP electrode and the graphite electrode increased with an increase in temperature, which was because the electrodes had better activity at higher temperatures. Also, it can be demonstrated that the values of DLi for the LFP electrodes were larger than the values of DLi for the graphite electrodes, especially under lower temperatures. In addition, by using a built-in LTO reference electrode, the DLi values in both the positive and negative materials could be measured for the same amount of time. Furthermore, the DLi values obtained using this method are the real values in the cell, not theoretical ones.
EIS measurement at different temperatures
The total internal resistance of the fabricated cell at different temperatures (20 °C, 0 °C, −10 °C and −20 °C) and different SOCs (0%, 50% and 100%) is shown in Fig. 9 and Table 1. The total resistance (Rtotal) is the summation of the ohmic resistance (R0), the resistance resulting from the SEI film (RSEI) and the charge transfer resistance (Rct). The results showed that the reaction resistance decreased with an increase in temperature, indicating an increased temperature is beneficial to the internal electrochemical reaction. At the same time, it should be mentioned that the SOC of the cell also has an obvious effect on the internal resistance. A higher charge state corresponds to a smaller internal resistance, indicative of a higher conductivity. For example, at 0 °C, the total internal resistance of the fabricated cell at 100% SOC was 117.84 Ω, which was lower than the internal resistance at 50% SOC (131.74 Ω) and at 0% SOC (155.78 Ω). More information on the representative Nyquist plots and the simplified equivalent circuit can be found in Fig. S1.†
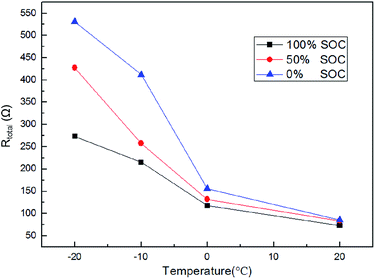 |
| | Fig. 9 The total internal resistance of the fabricated cell at different temperatures (20 °C, 0 °C, −10 °C and −20 °C) and different SOCs (0%, 50% and 100%). | |
Table 1 The cell internal resistance under different temperatures (20 °C, 0 °C, −10 °C and −20 °C) and different SOCs (0%, 50% and 100%)
| SOC |
100% |
50% |
0% |
| Temperature |
20 °C |
0 °C |
−10 °C |
−20 °C |
20 °C |
0 °C |
−10 °C |
−20 °C |
20 °C |
0 °C |
−10 °C |
−20 °C |
| R0/Ω |
20.74 |
23.51 |
23.43 |
24.74 |
20.97 |
21.39 |
25.07 |
25.22 |
21.22 |
23.10 |
23.14 |
23.94 |
| RSEI/Ω |
5.70 |
44.23 |
142.18 |
187.10 |
11.35 |
50.74 |
150.50 |
251.30 |
10.86 |
70.24 |
295.46 |
307.00 |
| Rct/Ω |
46.49 |
50.10 |
49.27 |
61.17 |
51.33 |
59.61 |
82.08 |
150.75 |
53.55 |
62.44 |
93.47 |
200.07 |
| Rtotal/Ω |
72.93 |
117.84 |
214.88 |
273.01 |
83.65 |
131.74 |
257.65 |
427.27 |
85.63 |
155.78 |
412.07 |
531.01 |
Fig. 10 and Table 2 show the impedance value of the LFP positive and graphite negative electrodes measured with the LTO reference electrode as well as the total impedance of the cell at 50% SOC. By comparing the data listed in Tables 1 and 2, the compliance relationship between the total impedance of the cell and those of the individual LFP positive electrode and the graphite negative electrode was found, which further confirmed the effectiveness of using LTO as a reference electrode for monitoring the EIS information of individual electrodes in a cell at any time.
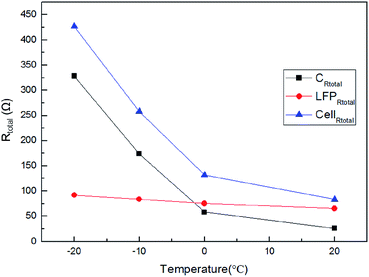 |
| | Fig. 10 The impedance value of the LFP positive and graphite negative electrodes measured with the LTO reference electrode as well as the total impedance of the cell at 50% SOC. | |
Table 2 The impedance value of the LFP positive and graphite negative electrodes measured with the LTO reference electrode as well as the total impedance of the cell at 50% SOC
| Electrode |
Graphite |
LFP |
Full cell |
| Temperature |
20 °C |
0 °C |
−10 °C |
−20 °C |
20 °C |
0 °C |
−10 °C |
−20 °C |
20 °C |
0 °C |
−10 °C |
−20 °C |
| R0/Ω |
9.66 |
11.30 |
13.88 |
14.55 |
10.24 |
9.96 |
11.15 |
10.87 |
20.97 |
21.39 |
25.07 |
25.22 |
| RSEI/Ω |
14.58 |
43.56 |
136.30 |
232.70 |
7.39 |
7.94 |
10.92 |
15.77 |
11.35 |
50.74 |
150.50 |
251.30 |
| Rct/Ω |
1.82 |
3.62 |
23.58 |
81.09 |
47.85 |
57.63 |
61.85 |
65.29 |
51.33 |
59.61 |
82.08 |
150.75 |
| Rtotal/Ω |
26.06 |
58.48 |
173.76 |
328.34 |
65.48 |
75.52 |
83.92 |
91.93 |
83.65 |
131.74 |
257.65 |
427.27 |
Conclusions
In summary, it is very facile to fabricate a kind of lithium-ion cell with built-in LTO electrodes as reference electrodes. The potential of LTO electrodes is quite stable over a wide range of temperatures and a long period of time. These electrodes could be chosen as reference electrodes for monitoring the electrochemical behavior of individual electrodes in cells. The test data demonstrated that the built-in LTO reference electrode was very effective in the measurement of the potential, DLi and EIS of individual electrodes. It is believed that adopting LTO as a reference electrode could be of great significance for long-term monitoring of the charge and discharge behavior of individual electrodes in lithium-ion cells.
Conflicts of interest
There are no conflicts to declare.
Acknowledgements
Financial support from the National Natural Science Foundation of China (No. 51604089 and No. 50974045), the Fundamental Research Funds for the Central Universities (Grant No. HIT.NSRIF.2017024), the China Postdoctoral Science Foundation (Grant No. 2016M601431), and the Heilongjiang Province Postdoctoral Science Foundation (Grant No. LBH-Z16056) is gratefully acknowledged.
Notes and references
- N. Dupre, J. F. Martin, J. Degryse, V. Fernandez, P. Soudan and D. Guyomard, J. Power Sources, 2010, 195, 7415 CrossRef.
- D. P. Abraham, J. R. Heaton, S. H. Kang, D. W. Dees and A. N. Jasen, J. Electrochem. Soc., 2008, 155, A41 CrossRef.
- J. Zhou and P. H. L. Notten, J. Electrochem. Soc., 2004, 151, A2173 CrossRef.
- D. P. Abraham, S. D. Poppen, A. N. Jansen, J. Liu and D. W. Dees, Electrochim. Acta, 2004, 49, 4763 CrossRef.
- H.-M. Cho, Y. Park, J.-W. Yeon and H. C. Shin, Electron. Mater. Lett., 2009, 5, 169 CrossRef.
- Y. Li, Z. Wang, D. Zhao and L. Zhang, Electrochim. Acta, 2015, 182, 368 CrossRef.
- M. Odziomek, F. Chaput, A. Rutkowska, K. Świerczek, D. Olszewska, M. Sitarz, F. Lerouge and P. Stephane, Nat. Commun., 2017, 8, 15636 CrossRef PubMed.
- Y. Li, Z. Wang, D. Zhao and L. Zhang, Electrochim. Acta, 2015, 182, 368 CrossRef.
- M. C. Smart and B. V. Ratnakumar, J. Electrochem. Soc., 2011, 158, A379 CrossRef.
- J. Zhou and P. H. L. Notten, J. Electrochem. Soc., 2004, 151, A2173 CrossRef.
- P. Liu and J. Wang, J. Electrochem. Soc., 2010, 157, A499 CrossRef.
- Y. Zhang and C.-Y. Wang, J. Electrochem. Soc., 2009, 156, A527 CrossRef.
- K. M. Shaju, G. V. S. Rao and B. V. R. Chowdari, Electrochim. Acta, 2003, 48, 2691 CrossRef.
- C. K. Park, S. B. Park, S. H. Oh, H. Jang and W. Cho, Bull. Korean Chem. Soc., 2011, 32, 3 Search PubMed.
- P. Yu, B. N. Popov, J. A. Ritter and R. E. White, J. Electrochem. Soc., 1999, 146, 8 CrossRef.
- B. Wang, Q. Wang, B. Xu, T. Liu, D. Wang and G. Zhao, RSC Adv., 2013, 3, 20024–20033 RSC.
- B. Wang, W. Al Abdulla, D. Wang and X. S. Zhao, Energy Environ. Sci., 2015, 8, 869–875 Search PubMed.
- Q. Chen, H. Li, C. Cai, S. Yang, K. Huang, X. Wei and J. Zhong, RSC Adv., 2013, 3, 22922 RSC.
- B. Wang, T. Liu, A. Liu, G. Liu, L. Wang, T. Gao, D. Wang and X. S. Zhao, Adv. Energy Mater., 2016, 6, 1600426 CrossRef.
- B. Wang, Y. Xie, T. Liu, H. Luo, B. Wang, C. Wang, L. Wang, D. Wang, S. Dou and Y. Zhou, Nano Energy, 2017, 42, 363 CrossRef.
- S. Praneetha and A. Vadivel Murugan, RSC Adv., 2013, 3, 25403 RSC.
Footnote |
| † Electronic supplementary information (ESI) available. See DOI: 10.1039/c8ra03062f |
|
| This journal is © The Royal Society of Chemistry 2018 |
Click here to see how this site uses Cookies. View our privacy policy here.  Open Access Article
 a,
Ziang Chena,
Rui Wang
 *a and
Dianlong Wang
 *a
*a
![[thin space (1/6-em)]](https://www.rsc.org/images/entities/char_2009.gif) :
:![[thin space (1/6-em)]](https://www.rsc.org/images/entities/char_2009.gif) KS-6 = 1
KS-6 = 1![[thin space (1/6-em)]](https://www.rsc.org/images/entities/char_2009.gif) :
:![[thin space (1/6-em)]](https://www.rsc.org/images/entities/char_2009.gif) 1) were mixed with polyvinylidene fluoride (PVDF) as an adhesive to make a positive slurry in a weight ratio of 8
1) were mixed with polyvinylidene fluoride (PVDF) as an adhesive to make a positive slurry in a weight ratio of 8![[thin space (1/6-em)]](https://www.rsc.org/images/entities/char_2009.gif) :
:![[thin space (1/6-em)]](https://www.rsc.org/images/entities/char_2009.gif) 1
1![[thin space (1/6-em)]](https://www.rsc.org/images/entities/char_2009.gif) :
:![[thin space (1/6-em)]](https://www.rsc.org/images/entities/char_2009.gif) 1 using N-methylpyrrolidone (NMP) as the solvent. The positive slurry was coated on aluminum foil sheets (with thicknesses of 10 μm). Then, the sheets were dried and rolled to make LFP positive electrodes.
1 using N-methylpyrrolidone (NMP) as the solvent. The positive slurry was coated on aluminum foil sheets (with thicknesses of 10 μm). Then, the sheets were dried and rolled to make LFP positive electrodes.![[thin space (1/6-em)]](https://www.rsc.org/images/entities/char_2009.gif) :
:![[thin space (1/6-em)]](https://www.rsc.org/images/entities/char_2009.gif) styrene-butadiene rubber = 1.5
styrene-butadiene rubber = 1.5![[thin space (1/6-em)]](https://www.rsc.org/images/entities/char_2009.gif) :
:![[thin space (1/6-em)]](https://www.rsc.org/images/entities/char_2009.gif) 1.2) to make a negative slurry in a weight ratio of 95
1.2) to make a negative slurry in a weight ratio of 95![[thin space (1/6-em)]](https://www.rsc.org/images/entities/char_2009.gif) :
:![[thin space (1/6-em)]](https://www.rsc.org/images/entities/char_2009.gif) 2.3
2.3![[thin space (1/6-em)]](https://www.rsc.org/images/entities/char_2009.gif) :
:![[thin space (1/6-em)]](https://www.rsc.org/images/entities/char_2009.gif) 2.7 using water as the solvent. The negative slurry was coated on copper foil sheets. Then, the sheets were dried and rolled to make AG negative electrodes.
2.7 using water as the solvent. The negative slurry was coated on copper foil sheets. Then, the sheets were dried and rolled to make AG negative electrodes.![[thin space (1/6-em)]](https://www.rsc.org/images/entities/char_2009.gif) :
:![[thin space (1/6-em)]](https://www.rsc.org/images/entities/char_2009.gif) KS-6 = 2.5
KS-6 = 2.5![[thin space (1/6-em)]](https://www.rsc.org/images/entities/char_2009.gif) :
:![[thin space (1/6-em)]](https://www.rsc.org/images/entities/char_2009.gif) 1.2) were mixed with PVDF (Solef 5130) as an adhesive to make a negative slurry in a weight ratio of 92.5
1.2) were mixed with PVDF (Solef 5130) as an adhesive to make a negative slurry in a weight ratio of 92.5![[thin space (1/6-em)]](https://www.rsc.org/images/entities/char_2009.gif) :
:![[thin space (1/6-em)]](https://www.rsc.org/images/entities/char_2009.gif) 3.7
3.7![[thin space (1/6-em)]](https://www.rsc.org/images/entities/char_2009.gif) :
:![[thin space (1/6-em)]](https://www.rsc.org/images/entities/char_2009.gif) 3.8 using NMP as the solvent. The negative slurry was coated on copper foil sheets. Then, the sheets were dried and rolled to make LTO negative electrodes.
3.8 using NMP as the solvent. The negative slurry was coated on copper foil sheets. Then, the sheets were dried and rolled to make LTO negative electrodes.![[thin space (1/6-em)]](https://www.rsc.org/images/entities/char_2009.gif) :
:![[thin space (1/6-em)]](https://www.rsc.org/images/entities/char_2009.gif) 1
1![[thin space (1/6-em)]](https://www.rsc.org/images/entities/char_2009.gif) :
:![[thin space (1/6-em)]](https://www.rsc.org/images/entities/char_2009.gif) 1 by volume) electrolyte with 1 M of dissolved LiPF6. The design capacity at 0.2C is 1.5 mA h for the LFP positive electrodes, and 2.2 mA h for graphite and the LTO negative electrodes.
1 by volume) electrolyte with 1 M of dissolved LiPF6. The design capacity at 0.2C is 1.5 mA h for the LFP positive electrodes, and 2.2 mA h for graphite and the LTO negative electrodes.


