 Open Access Article
Comparative studies on the interaction of anticancer drug irinotecan with dsDNA and ssDNA†
Yassien Temerk *a,
Mohamed Ibrahim
 b,
Hossieny Ibrahim
 a and
Wolfgang Schuhmann
 c
c
aChemistry Department, Faculty of Science, Assiut University, Assiut, Egypt. E-mail: Temerk44@yahoo.com; Fax: +20 (88) 2342708; Tel: +20 (88) 2360770
bDepartment of Clinical Pharmacy Research, Institute for Research and Medical Consultation, Imam Abdulrahman Bin Faisal University, P.O. Box 1982, Dammam 31441, Saudi Arabia
cAnal. Chem. – Elektroanalytik & Sensorik, Ruhr-Universitat Bochum, D-44780 Bochum, Germany
First published on 16th July 2018
Abstract
A systematic comparative study on the binding of anticancer drug irinotecan (Irino) with dsDNA and ssDNA was investigated in phosphate buffer solutions using voltammetric and spectroscopic methods. The voltammetric results show that the Irino molecule, acting as an intercalator, is inserted into the base stacking domain of the DNA double helix and the strength of interaction is independent of the ionic strength. The hyperchromic effect observed in the UV-visible spectra of Irino in the presence of dsDNA provided the evidence for the intercalation of the drug chromophore with dsDNA base. The interaction mode of Irino molecules with ssDNA is electrostatic attraction via negative phosphate on the exterior of the ssDNA with Irino. The binding constants, stoichiometric coefficients and thermodynamic parameters of Irino–dsDNA and Irino–ssDNA complexes were evaluated. The magnitude of changes in ΔGo, ΔHo and ΔSo indicated that the binding process of Irino with ssDNA was more affected than that with dsDNA. The decrease of the peak current of Irino was proportional to DNA concentration, which was applied for determination of dsDNA and ssDNA concentration. The achieved limits of detection of dsDNA and ssDNA were 5.49 × 10⁻⁷ and 1.87 × 10⁻⁷ M, respectively.
1. Introduction
Transcription and replication are vital to cell survival and proliferation as well as for smooth functioning of all body processes. DNA starts transcribing or replicating only when it receives a signal, which is often in the form of a regulatory protein binding to a particular region of the DNA.1 Thus, if the binding specificity and strength of this regulatory protein can be mimicked by a small molecule, then DNA function can be artificially modulated, inhibited or activated by binding this molecule instead of the protein. Thus, synthetic/natural small molecules can act as a drug when activation or inhibition of DNA function is required to cure or control a disease. In recent years increased attention has been focused on the ways in which anticancer drugs interact with biological systems, with the goal of understanding the toxic as well as chemotherapeutic effects of those small molecules.2 In this context there are primarily three different ways by which anticancer drugs interact with DNA: (i) through control of transcription factors and polymerases. Here, the drugs interact with proteins that bind to DNA; (ii) through RNA binding to the DNA double helix to form nucleic triple helix structures or RNA hybridization to exposed DNA single strand forming DNA–RNA hybrids that may interfere with transcriptional activity; and (iii) through binding of small aromatic ligand molecules to DNA double helical structures. The binding of small molecules to DNA involves electrostatic interaction, intercalation between base pairs and minor and major DNA grooves binding interaction. The interaction of some anticancer drugs with DNA has been studied by a variety of techniques including electrophoresis,3,4 X-ray crystallography,5 structural modeling,6 luminescence,7 NMR,8 resonance Rayleigh light scattering,9 fluorescence,10–13 dynamic viscosity measurements,14 high-performance liquid chromatography,15 and UV-visible absorption spectroscopy.16–23 In recent years, there has been a growing interest in electrochemical investigation of interactions between anticancer drugs and other DNA-target molecules and DNA.24–36 The use of electrochemical techniques to increase the knowledge of drug molecules and their mechanism of action is one of the most important phases of drug discovery.37 On the other hand, the electrochemical DNA-biosensors form a useful model for simulating nucleic acid interactions with cell membranes, potential environmental carcinogenic compounds and clarifying the mechanism of interaction with drugs and chemotherapeutics.38–40 However electrochemistry coupled with spectroscopy techniques could provide a relatively easy way to obtain useful insights into the molecular mechanism of drug–DNA interaction, which could be an important step in the development of a new anticancer drug. Among anticancer drugs, Irino has shown activity against colorectal, esophageal, gastric, non-small-cell and small-cell lung cancers, leukemia and lymphomas, as well as central nervous system malignant gliomas.41 Irino interacts specifically with DNA topoisomerase 1 (Topo 1). The formation of a cleavable drug–Topo1–DNA complex results in lethal double-stranded DNA breakage and cell death.42 To the best our knowledge, no attention has been paid to a comparative study on the interaction of anticancer drug Irino with dsDNA and ssDNA. This investigation offers an opportunity to understand how the kind of DNA affects its binding and affinity of binding to the anticancer drug Irino.In the present work, comparison of the mode interaction of Irino with dsDNA and ssDNA was investigated using voltammetric and spectroscopic methods. The formed anticancer Irino–dsDNA and Irino–ssDNA adducts at different temperatures leads to change in the thermodynamic and structural properties of DNA. The thermodynamic characterization of the drug binding might be used, together with structural studies, in development of new strategies to interface with gene expression in living cells. The present investigation offers also an opportunity to use Irino drug as a new electrochemical probe for determination of dsDNA and ssDNA concentrations.
2. Experimental
2.1. Instrumentation
Cyclic voltammetry (CV) and square wave voltammetry (SWV) were performed using an EG&G PAR 384 B (Princeton Applied Research, Oak Ridge, TN, USA) polarographic analyzer controlled by 394 software in conjunction with a PAR Model 303A HMDE (Hanging Mercury Drop Electrode). The three electrode system was completed by an Ag/AgCl (saturated KCl) reference electrode and a Pt wire auxiliary electrode. A PAR Model 305 stirrer was used for the SWV. The ultraviolet and visible absorption spectra measurements were obtained using PerkinElmer (Lambda) spectrophotometer.2.2. Chemicals and reagents
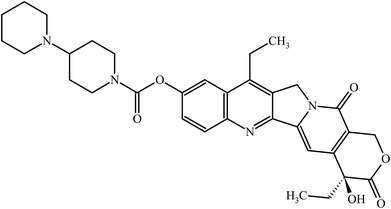
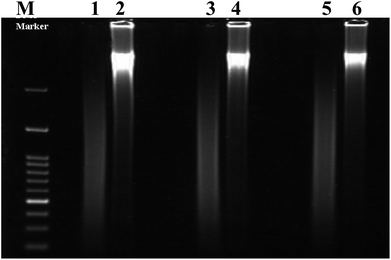
Calf thymus double stranded deoxyribonucleic acid (dsDNA) and irinotecan (Irino, for chemical structure see Scheme 1) were purchased from Sigma-Aldrich chemicals (St. Louis, Mo, USA) and were used as received without further purification. A stock standard solution of dsDNA was prepared by dissolving 0.1 g of dsDNA in 100 ml autoclaved deionized water and stored at 4 °C and discarded after no more than four days. The concentration of the stock solution of dsDNA (1.86 × 10⁻³ M in nucleotide phosphate, NP) was determined by UV absorbance at 260 nm using the molar extinction coefficient (ε) at 6600 M−1 cm−1. Denatured single-stranded DNA was prepared by heating native double-stranded DNA in water bath at a 100 °C for 30 min, followed by promptly cooling in ice bath.43 The formation of ssDNA from dsDNA is checked by gel electrophoresis measurements. Images gel electrophoresis of ssDNA and dsDNA were provided in Fig. 1. A stock solution of Irino (1 × 10⁻³ M) was prepared by dissolving an appropriate amount of the drug in deionized water and storing the solution in the dark at 4 °C. The supporting electrolyte was phosphate buffer prepared by mixing stock solution of 0.2 M NaH2PO4 and 0.2 M Na2HPO4 and adjusting the pH with H3PO4 or NaOH to obtain buffers in pH range 2–12. All chemicals were of reagent grade (Merck, Darmstadt, Germany). Double-distilled deionized water was used to prepare the solutions.2.3. Voltammetric measurements
For voltammetric measurements, the test solution was placed in a polarographic cell of volume 10 ml and deoxygenated by bubbling nitrogen for 15 min. During measurements a steam of nitrogen was passed over the solution. SWV was performed using a pulse amplitude of 50 mVpp; a frequency of 120 Hz; a scan increment of 6 mV; an adsorption time of 60 s and equilibrium time of 15 s. CVs were recorded at a scan rate of 100 mV s−1 (unless otherwise stated). The peak potentials were reproducible to at least ±5 mV in the CVs and ±2 mV in the SWV. Concentrations of Irino and the total volume solution constant (5 ml) were kept constant while the concentrations of dsDNA and ssDNA were varied. The equilibrium binding constants and thermodynamic parameters for dsDNA–Irino and ssDNA–Irino complexes were determined at different temperatures. All experiments were carried out at 25 ± 0.05 °C.3. Results and discussion
3.1. Interaction of Irino with dsDNA
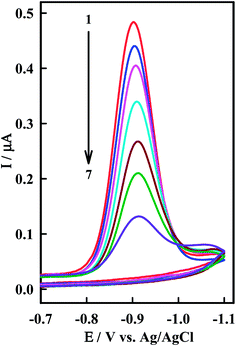
Cyclic voltammetric studies of Irino at a HMDE in phosphate buffer solutions showed only one cathodic peak corresponding to direct reduction of the lactone moiety of camptothecin to a lactol ring.30 No anodic peaks were observed at any scan rate, indicating that the reduced form of Irino is electrochemically irreversible. The irreversible nature of the reduction process was confirmed by the shift of the peak potential (EP) to a more negative value with the increase of the scan rate. The height of the reduction peak reached a maximum and the shape of the curve is better in PBS at pH 5.2. In this context the cathodic peak current of 38.5 μM Irino decreased at pH 5.2 more than at pH 7.2 upon the addition of 3.06 μM dsDNA (Fig. S1†). Therefore pH 5.2 was selected to study the interaction between Irino and ds-DNA. Under these conditions the dramatic changes of CV behavior of Irino in the presence of dsDNA should be occurred (Fig. 2). When dsDNA is added to a solution of Irino, the peak current height decreases and peak potential shifts from −900 mV to more negative values −918 mV are observed. The peak potential of CV shifts to more positive or negative values indicating that the action of Irino with dsDNA may be intercalation.34,36 Accordingly to these observations it seems that the decrease of peak current of Irino after an addition of excess of dsDNA is caused by the intercalation of Irino to the bulk, slowly diffusing dsDNA, which results in considerable decrease in the apparent diffusion coefficient. This is emphasized from the decrease in the slope of linear iP − ν1/2 plots (R ≥ 0.994), where the slope values are 0.075 and 0.035 μA mV−1/2 s1/2 in absence and presence of dsDNA respectively. From these values, the diffusion coefficient (Df) of the free Irino was found to 1.16 × 10⁻⁵ cm2 s−1, whereas Db = 2.6 × 10⁻⁶ cm2 s−1 for the bound Irino (in presence of 7.72 × 10⁻⁶ M dsDNA, NP). The changes in current upon addition of dsDNA can be explained in terms of diffusion of an equilibrium mixture free and bound Irino to the electrode and which can be used to quantify the binding of Irino to dsDNA. In this context, current titrations were performed by keeping the concentration of Irino constant while varying the concentration of dsDNA using SWV at pH 5.2. The current titration was described by the following eqn (1).28
log(1/[DNA]) = log![[thin space (1/6-em)]](https://www.rsc.org/images/entities/char_2009.gif) K + log(IH–G/IG − IH–G) K + log(IH–G/IG − IH–G)
| (1) |
![[thin space (1/6-em)]](https://www.rsc.org/images/entities/char_2009.gif) :
:![[thin space (1/6-em)]](https://www.rsc.org/images/entities/char_2009.gif) 1 association complex between the drug and dsDNA (in nucleotide phosphate), then the plot of log(1/[DNA]) versus log(IH–G/IG − IH–G) becomes linear with the intercept of log
1 association complex between the drug and dsDNA (in nucleotide phosphate), then the plot of log(1/[DNA]) versus log(IH–G/IG − IH–G) becomes linear with the intercept of log![[thin space (1/6-em)]](https://www.rsc.org/images/entities/char_2009.gif) K. The binding constant of this complex was evaluated according to eqn (1) and the result is cited in Table 1. The value of K demonstrated that Irino binds to dsDNA with a high association constant.
K. The binding constant of this complex was evaluated according to eqn (1) and the result is cited in Table 1. The value of K demonstrated that Irino binds to dsDNA with a high association constant.
| T (K) | K × 105 (M−1) | −ΔGo (kJ mol−1) | ΔHo (kJ mol−1) | ΔSo (J K−1 mol−1) |
|---|---|---|---|---|
| Irino–dsDNA | ||||
| 278.00 ± 0.05 | 1.32 | 27.25 | 17.93 | 162.12 |
| 288.00 ± 0.05 | 1.69 | 28.82 | ||
| 298.00 ± 0.05 | 2.10 | 30.36 | ||
| 308.00 ± 0.05 | 2.80 | 32.12 | ||
![[thin space (1/6-em)]](https://www.rsc.org/images/entities/char_2009.gif) |
||||
| Irino–ssDNA | ||||
| 278.00 ± 0.05 | 3.30 | 29.37 | 27.21 | 203.59 |
| 288.00 ± 0.05 | 4.89 | 31.37 | ||
| 298.00 ± 0.05 | 6.96 | 33.33 | ||
| 308.00 ± 0.05 | 10.23 | 35.43 | ||
The change in Gibbs free energy for the Irino–dsDNA adduct was calculated from the well known relationship:
ΔGo = −RT![[thin space (1/6-em)]](https://www.rsc.org/images/entities/char_2009.gif) ln ln![[thin space (1/6-em)]](https://www.rsc.org/images/entities/char_2009.gif) K K
| (2) |
Ionic strength dependence of the interaction between Irino and dsDNA was also studied. When the ionic strength of the solution increased after a salt was added, charge compensation of the nucleotide phosphates caused by cations would hinder the electrostatic binding effect. Consequently, complex formation through electrostatic binding would decrease, where the binding based on an intercalation mechanism should virtually unaffected.44 The ionic strength of reaction medium was varied by changing the concentration of NaCl from 0.05 to 0.3 M. Square wave signals in those solutions with different ionic strength were recorded. No significant change in square wave signals was observed when ionic strength increased. The obtained result indicates that the interaction process of Irino with dsDNA is independent on salt concentration and was mainly intercalation mode. The interaction might be attributed to Irino that intercalates into the DNA double helix between stacked base pairs of dsDNA.
3.2. Spectral profile of the Irino–dsDNA complex
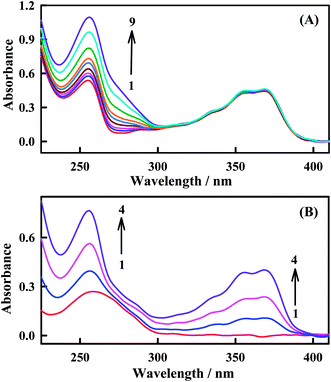
In order to validate the interaction between Irino and dsDNA, the UV-absorption spectra of Irino in the absence and presence of different concentrations of dsDNA were investigated. In the absence of dsDNA Irino has a sharp absorption peak at 255 nm and a broad absorption peak at 368 nm. When Irino and dsDNA are mixed, the spectrum is significantly different from that of Irino or dsDNA (Fig. 3). The absorption band at 255 nm showed increase in the peak intensity (hyperchromic effect) whereas the broad absorption band of Irino at 368 nm decreased slightly with successive additions of dsDNA. The hyperchromic effect may be due to intercalation of the Irino between the dsDNA base pairs. Intercalational phenomena of the Irino with dsDNA could be explained by the presence of two different electronic transitions, π–π* and n–π* of Irino spectra. The increase in the concentration of added dsDNA enhanced the absorption peak height i.e. hyperchromic effect (π–π* region) that could be related with enhanced intercalation of Irino into dsDNA and the complex formed accordingly may become more compact.45 To confirm the mode of intercalation between the anticancer Irino and dsDNA, absorption spectra of Irino at a constant concentration (2 × 10⁻⁵ M) in the absence and presence of dsDNA are taken (Fig. 3A). Absorbance maximum of dsDNA is located at 260 nm due to a consequence of the chromophoric groups in purine and pyrimidine moieties responsible for the electronic transitions. When the Irino interacts with dsDNA, it causes hyperchromic effect with increasing concentration of Irino in solution (Fig. 3B). This increase in intensity of absorption maxima (hyperchromic effect) of drug or dsDNA binding molecules is a typical characteristic of dsDNA intercalation.46 The increase in the absorbance intensity of dsDNA is attributed also to stacking interaction of drug chromophore with dsDNA bases. This was consistent with the result obtained by the electrochemical method.3.3. Interaction of Irino with ssDNA
The interaction of the anticancer drug Irino with ssDNA was investigated by means of CV as shown in Fig. 4. When ssDNA is added to a solution of Irino, marked decreases in the peak current heights are observed. The cathodic peak current of Irino decreased by ca. 71.1% in presence of 2.08 × 10⁻⁶ M ssDNA and the peak potential shifted to more negative potential. Accordingly to these observations it seems that the decrease of peak current of Irino after an addition of excess ssDNA is cased by the electrostatic attraction of Irino to the bulk, slowly dispersion ssDNA, which results in considerable decrease in the apparent diffusion coefficient. This is emphasized from the decrease in the slope of the linear ip − ν1/2 plots (R ≥ 0.995), where the slope values are 0.075 and 0.052 μA mV−1/2 s1/2 in absence and presence of ssDNA respectively. From these values, the diffusion coefficient (Df) of the free Irino was found to 1.16 × 10⁻⁵ cm2 s−1, whereas Db = 5.74 × 10⁻⁶ cm2 s−1 for the bound Irino (in presence of 6.67 × 10⁻⁷ M ssDNA). The binding constant of the Irino with ssDNA was determined from the current titration as shown above (eqn (1)). The plot of log(1/[ssDNA]) versus log(IH–G/IG − IH–G) is linear with the intercept of log![[thin space (1/6-em)]](https://www.rsc.org/images/entities/char_2009.gif) K. The values of K and ΔGo demonstrated that Irino binds to ssDNA with a high association constant (Table 1). The interaction mode of Irino molecules with ssDNA is electrostatic attraction via negative phosphate on the exterior of the ssDNA with Irino. In addition, no intercalative interactions are expected if the bind is with single stranded DNA.
K. The values of K and ΔGo demonstrated that Irino binds to ssDNA with a high association constant (Table 1). The interaction mode of Irino molecules with ssDNA is electrostatic attraction via negative phosphate on the exterior of the ssDNA with Irino. In addition, no intercalative interactions are expected if the bind is with single stranded DNA.
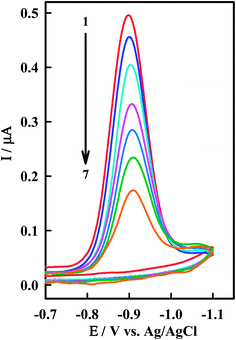 | ||
| Fig. 4 CV of 38.5 μM Irino at HMDE in phosphate buffer solution (pH = 5.2) in absence (1) and presence of (2) 0.33, (3) 0.66, (4) 0.98, (5) 1.14, (6) 1.61 and (7) 2.08 μM ssDNA. Other conditions as in Fig. 2. | ||
Comparison of the interaction of Irino upon the addition of dsDNA and ssDNA at pH 5.2 indicated that the decrease in peak current (ΔI) decreases more sharply with the addition of ssDNA than in the presence of dsDNA as shown in Fig. 5. In this context the apparent diffusion coefficient of the Irino–dsDNA adduct is smaller than that of the Irino–ssDNA complex. Furthermore, the binding constant of Irino–dsDNA adduct is lower than of the Irino–ssDNA adduct (Table 1). As the same the calculated ΔGo values for the binding process of Irino with ssDNA is more negative than of the interaction of Irino with dsDNA. This result indicates a different interaction mechanism of Irino with ssDNA than with dsDNA. The interaction of Irino with dsDNA might be attributed to its intercalation into base stacking domain of DNA double helix. The interaction of Irino with ssDNA indicated that the backbone of ssDNA is negatively charged and can easily attract to the investigated drug via electrostatic attraction. The results offer an opportunity to understand how the kind of DNA affects its binding and affinity of binding to anticancer drug Irino.
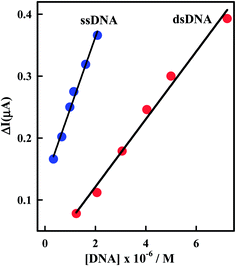 | ||
| Fig. 5 Plot of ΔI (μA) versus [DNA] using CV. Other conditions as in Fig. 2. | ||
3.4. Thermodynamic parameters of Irino–dsDNA and Irino–ssDNA complexes
To have a better understanding of thermodynamics of the reaction between Irino and dsDNA, it is useful to determine the contributions of enthalpy and entropy of the reaction. In this context the integrated form of van't Hoff eqn (3) permits to calculate the values of enthalpy (ΔHo) and entropy (ΔSo) depending on variation of the stability constant with temperature.47
ln![[thin space (1/6-em)]](https://www.rsc.org/images/entities/char_2009.gif) K = −ΔHo/RT + ΔSo/R K = −ΔHo/RT + ΔSo/R
| (3) |
The van't Hoff plots (Fig. 6) for the Irino–dsDNA adduct shows a linear behavior and allows to derive the thermodynamic parameters (Table 1). The positive value of enthalpy change indicates that the interaction process of Irino with dsDNA is endothermic. Also the entropy associated with the complexation process is positive which indicates an increase in transitional and rotational degrees of freedom of the complexed molecular.28
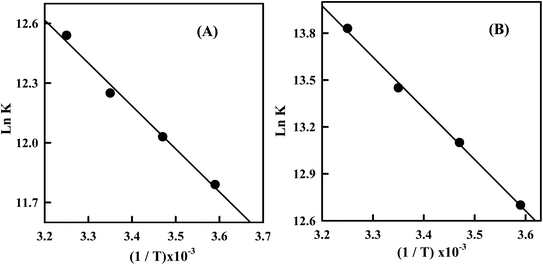 | ||
Fig. 6 (A) Plot of ln![[thin space (1/6-em)]](https://www.rsc.org/images/entities/char_2009.gif) K versus 1/T for the Irino–dsDNA complex (B) plot of ln K versus 1/T for the Irino–dsDNA complex (B) plot of ln![[thin space (1/6-em)]](https://www.rsc.org/images/entities/char_2009.gif) K versus 1/T for the Irino–ssDNA complex. K versus 1/T for the Irino–ssDNA complex. | ||
Accordingly to the thermodynamic data, interpreted as follows, the model of interaction between a drug and biomolecule can be:48 (1) when ΔHo < 0 or ΔHo ≈ 0 and ΔSo > 0, the electrostatic force demoniates the interaction; (2) when ΔHo < 0 and ΔSo < 0, van der Waals interactions or hydrogen bonds demoniate the reaction; (3) when ΔHo > 0 and ΔSo> 0, hydrophobic interactions demoniate the binding process. By applying this analysis to the binding system of Irino–dsDNA, we determine that non-bonded (hydrophobic) interaction was the most important factor contributing to the observed positive ΔHo and ΔSo and hence to the stability of dsDNA association complex.
The temperature dependence of the binding constant for the interaction of Irino with ssDNA was studied. The interaction of Irino with ssDNA exhibits a positive ΔHo value and also a positive ΔSo value (Table 1). Comparing the thermodynamic parameters for the interaction of anticancer Irino with dsDNA and ssDNA it is obvious that the interaction of Irino with ssDNA displaced high affinity in solution than that with dsDNA. The magnitude of changes in ΔGo, ΔHo and ΔSo indicated that the binding process of Irino with ssDNA is more favorable and spontaneous than that with dsDNA. The obtained results indicate a different interaction mechanism of the investigated drug with ssDNA than with dsDNA. The interaction of Irino with dsDNA is attributed to its intercalating into base stacking domain of DNA double helix whereas the interaction of Irino with ssDNA is due to electrostatic attraction.
3.5. Determination of stoichiometric coefficient
As no new electrochemical signals appeared after dsDNA Irino interaction, it would be possible to assume that only one complex is formed [dsDNA (Irino)n], according to.49
dsDNA + n(Irino) ![[left over right harpoons]](https://www.rsc.org/images/entities/char_21cb.gif) dsDNA(Irino)n dsDNA(Irino)n
| (4) |
Thus, the binding constant is as follows:
| βsn = [dsDNA(Irino)n]/[dsDNA][Irino]n | (5) |
log[ΔI/(ΔImax − ΔI)] = n![[thin space (1/6-em)]](https://www.rsc.org/images/entities/char_2009.gif) log(βs/M−1) + n log(βs/M−1) + n![[thin space (1/6-em)]](https://www.rsc.org/images/entities/char_2009.gif) log[Irino] log[Irino]
| (6) |
The plot of log[ΔI/(ΔImax − ΔI)] vs. log[Irino] becomes linear with the slope of “n” and the intercept of “n![[thin space (1/6-em)]](https://www.rsc.org/images/entities/char_2009.gif) log
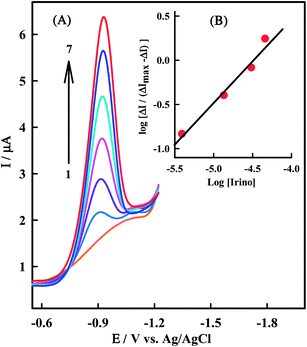
log![[thin space (1/6-em)]](https://www.rsc.org/images/entities/char_2009.gif) βs”. Fig. 7A shows the effect of a constant dsDNA concentration on the electrochemical response of a series of Irino concentration solutions and Fig. 7B shows a linear logarithmic relation. The fact that there is one slope in plot represented in Fig. 7B confirms the single complex formation, thus the molar value of “n” and binding constant for dsDNA–Irino complex are determined. There is good agreement between K values of Irino–dsDNA obtained from eqn (1) and (6) which are 2.1 × 10⁵ M−1 and 2.29 × 10⁵ M−1 respectively. The value obtained for “n” is 1.34 and smaller than those obtained for bigger molecules such as metallic complexes with reported values up to 25.50 This is probably due to the smaller size of Irino compared with metallic complexes.
βs”. Fig. 7A shows the effect of a constant dsDNA concentration on the electrochemical response of a series of Irino concentration solutions and Fig. 7B shows a linear logarithmic relation. The fact that there is one slope in plot represented in Fig. 7B confirms the single complex formation, thus the molar value of “n” and binding constant for dsDNA–Irino complex are determined. There is good agreement between K values of Irino–dsDNA obtained from eqn (1) and (6) which are 2.1 × 10⁵ M−1 and 2.29 × 10⁵ M−1 respectively. The value obtained for “n” is 1.34 and smaller than those obtained for bigger molecules such as metallic complexes with reported values up to 25.50 This is probably due to the smaller size of Irino compared with metallic complexes.
The effect of a constant ssDNA concentration on the SWV response of a series of concentration of Irino was also studied. In this context the plot of log[ΔI/(ΔImax − ΔI)] versus log[Irino] is linear and confirms the single complex formation. The value obtained for “β” and “n” are 5.3 × 10⁵ M−1 and 1.25 respectively.
3.6. Analytical aspects of dsDNA–Irino and ssDNA–Irino interactions
The dependence of the peak current of Irino upon successive additions of dsDNA or ssDNA can be employed to determine the concentration of dsDNA and ssDNA. So Irino can be used as a new indicator measuring DNA concentration. Under the optimum experimental conditions the decreases in peak current of Irino were linearly related to dsDNA or ssDNA concentrations in the range of 1.24 × 10⁻⁶ M to 3.33 × 10⁻⁷ M when the Irino concentration fixed as at 3.85 × 10⁻⁵ M (Fig. 8).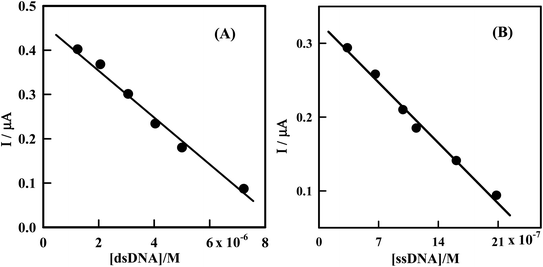 | ||
| Fig. 8 (A) Plot of IP (μA) as a function of [dsDNA] from the voltammograms in Fig. 2. (B) Plot of IP (μA) as a function of [ssDNA] from the voltammograms in Fig. 4. | ||
The variation of decrease in peak current versus the dsDNA or ssDNA concentration was represented by a straight line followed the equations IP (μA) = 0.46–5.46 × 10⁴ C (M) (dsDNA) and IP (μA) = 0.33–1.6 × 10⁵ C (M) (ssDNA), with regression coefficients of 0.994 and 0.990 respectively. The limits of detection (LOD) and quantitation (LOQ) were computed and the following results obtained: LOD (dsDNA) = 5.49 × 10⁻⁷ M, LOQ (dsDNA) = 1.83 × 10⁻⁶ M, LOD (ssDNA) = 1.87 × 10⁻⁷ M, LOQ (ssDNA) = 6.25 × 10⁻⁷ M. The proposed method is simple, sensitive and rapid, and hence can be applied for determination of many kinds of DNA.
4. Conclusion
In this paper a systematic comparative study of the binding of anticancer Irino with dsDNA and ssDNA has been investigated. Based on our investigation, although the anticancer Irino can bind to dsDNA and ssDNA, the nature of binding was found to be different from each them. Irino molecule, acting as intercalator, is inserted into the base stacking domain of the DNA double helix. The thermodynamic parameters (ΔHo > 0 and ΔSo > 0) indicate that the complexation between the anticancer Irino and dsDNA is stabilized by hydrophobic forces. The interaction mode of Irino molecules with ssDNA is electrostatic attraction via negative phosphate on the exterior of the ssDNA with Irino. The binding constants and thermodynamic parameters of the binding of Irino with ssDNA indicated a higher affinity of Irino to ssDNA than that with dsDNA. The results also offer an opportunity to use Irino drug as a new electrochemical probe for determination of dsDNA and ssDNA concentrations.Conflicts of interest
There are no conflicts to declare.Acknowledgements
The authors express their gratitude to the Alexander von Humboldt Stiftung, Germany for a financial support of this investigation.References
- M. Sirajuddin, S. Ali and A. Badshah, Drug–DNA interactions and their study by UV–Visible, fluorescence spectroscopies and cyclic voltammetry, J. Photochem. Photobiol., B, 2013, 124, 1–19 CrossRef PubMed.
- S. Rauf, J. J. Gooding, K. Akhtar, M. A. Ghauri, M. Rahman, M. A. Anwar and A. M. Khalid, Electrochemical approach of anticancer drugs–DNA interaction, J. Pharm. Biomed. Anal., 2005, 37, 205–217 CrossRef PubMed.
- F. Araya, G. Huchet, I. McGroarty, G. G. Skellern and R. D. Waigh, Capillary electrophoresis for studying drug–DNA interactions, Methods, 2007, 42, 141–149 CrossRef PubMed.
- N. Shi and V. M. Ugaz, Using microchip gel electrophoresis to probe DNA-drug binding interactions, Methods Mol. Biol., 2014, 1094, 13–24 CrossRef PubMed.
- D. Maciejewska, I. Szpakowska, I. Wolska, M. Niemyjska, M. Mascini and M. M. Zurawska, DNA-based electrochemical biosensors for monitoring of bis-indoles as potential antitumoral agents, chemistry, X-ray crystallography, Bioelectrochemistry, 2006, 69, 1–9 CrossRef PubMed.
- R. Rohs, H. Sklenar, R. Lavery and B. Roder, Methylene blue binding to DNA with alternating GC base sequence: A modeling study, J. Am. Chem. Soc., 2000, 122, 2860–2866 CrossRef.
- J. Yuan, W. Guo, X. Yang and E. Wang, Anticancer drug–DNA interactions measured using a photoinduced electron-transfer mechanism based on luminescent quantum dots, Anal. Chem., 2009, 81, 362–368 CrossRef PubMed.
- K. Sandström, S. Wärmländer, M. Leijon and A. Gräslund, 1H NMR studies of selec-tive interactions of norfloxacin with double-stranded DNA, Biochem. Biophys. Res. Commun., 2003, 304, 55–59 CrossRef.
- S. Bi, Y. Wang, T. Wang, B. Pang and T. Zhao, The analytical application and spectral investigation of DNA–CPB–emodin and sensitive determination of DNA by resonance Rayleigh light scattering technique, Spectrochim. Acta, Part A, 2013, 101, 233–238 CrossRef PubMed.
- H. P. Xie, J. H. Jiang, X. Chu, H. Cui, H. L. Wu, G. L. Shen and R. Q. Yu, Competitive interaction of the antitumor drug daunorubicin and the fluorescence probe ethidium bromide with DNA as studied by resolving trilinear fluorescence data: the use of PARAFAC and its modification, Anal. Bioanal. Chem., 2002, 373, 159–162 CrossRef PubMed.
- Y. Ni, D. Lin and S. Kokot, Synchronous fluorescence and UV–vis spectrometric study of the competitive interaction of chlorpromazine hydrochloride and neutral red with DNA using chemometrics approaches, Talanta, 2005, 65, 1295–1302 CrossRef PubMed.
- S. Bi, C. Qiao, D. Song, Y. Tian, D. Gao, Y. Sun and H. Zhang, Study of interactions of flavonoids with DNA using acridine orange as a fluorescence probe, Sens. Actuators, B, 2006, 119, 199–208 CrossRef.
- Y. Ni, D. Lin and S. Kokot, Synchronous fluorescence, UV–visible spectrophotometric, and voltammetric studies of the competitive interaction of bis(1,10-phenanthroline)copper(II) complex and neutral red with DNA, Anal. Biochem., 2006, 352, 231–242 CrossRef PubMed.
- V. G. Vaidyanathan and B. U. Nair, Oxidative cleavage of DNA by tridentate copper (II) complex, J. Inorg. Biochem., 2003, 93, 271–276 CrossRef PubMed.
- A. R. Bahrami, M. J. Dickman, M. M. Matin, R. J. Ashby, P. E. Brown, M. J. Conroy, G. J. S. Fowler, J. P. Rose, O. I. Sheikh, A. T. Yeung and D. P. Hornby, Use of fluorescent DNA-intercalating dyes in the analysis of DNA via ion-pair reversed-phase denaturing high-performance liquid chromatography, Anal. Biochem., 2002, 309, 248–252 CrossRef PubMed.
- N. K. Janjua, A. Siddiqa, A. Yaqub, S. Sabahat, R. Qureshi and S. Haque, Spectrophotometric analysis of flavonoid–DNA binding interactions at physiological conditions, Spectrochim. Acta, Part A, 2009, 74, 1135–1137 CrossRef PubMed.
- S. T. Saito, G. Silva, C. Pungartnik and M. Brendel, Study of DNA–emodin interaction by FTIR and UV–vis spectroscopy, J. Photochem. Photobiol., B, 2012, 111, 59–63 CrossRef PubMed.
- G. Tyagi, S. Charak and R. Mehrotra, Binding of an indole alkaloid, vinblastine to double stranded DNA: A spectroscopic insight in to nature and strength of interaction, J. Photochem. Photobiol., B, 2012, 108, 48–52 CrossRef PubMed.
- A. H. Hegde, S. N. Prashanth and J. Seetharamappa, Interaction of antioxidant flavonoids with calf thymus DNA analyzed by spectroscopic and electrochemical methods, J. Pharm. Biomed. Anal., 2012, 63, 40–46 CrossRef PubMed.
- S. Agarwal, D. Kumar Jangir and R. Mehrotra, Spectroscopic studies of the effects of anticancer drug mitoxantrone interaction with calf-thymus DNA, J. Photochem. Photobiol., B, 2013, 120, 177–182 CrossRef PubMed.
- S. Charak and R. Mehrotra, Structural investigation of idarubicin–DNA interaction: Spectroscopic and molecular docking study, Int. J. Biol. Macromol., 2013, 60, 213–218 CrossRef PubMed.
- S. Kashanian, M. M. Khodaei, H. Roshanfekr and G. Mansouri, Interaction of two new mixed ligand copper(II) complexes with DNA probed by thermodynamic and spectroscopic studies, Mol. Biol. Rep., 2014, 41, 25–37 CrossRef PubMed.
- R. Hajian and T. G. Huat, Spectrophotometric studies on the thermodynamics of the ds-DNA interaction with irinotecan for a better understanding of anticancer drug-DNA interactions, J. Spectrosc., 2012, 2013, 1–8 Search PubMed.
- E. Palecek, Past, present and future of nucleic acids electrochemistry, Talanta, 2002, 56, 809–819 CrossRef PubMed.
- L. Wang, L. Lin and B. Ye, Electrochemical studies of the interaction of the anticancer herbal drug emodin with DNA, J. Pharm. Biomed. Anal., 2006, 42, 625–629 CrossRef PubMed.
- F. Wang, Y. Xu, J. Zhao and S. Hu, Electrochemical oxidation of morin and interaction with DNA, Bioelectrochemistry, 2007, 70, 356–362 CrossRef PubMed.
- X. Tian, F. Li, L. Zhu and B. Ye, Study on the electrochemical behavior of anticancer herbal drug rutin and its interaction with DNA, J. Electroanal. Chem., 2008, 621, 1–6 CrossRef.
- Y. M. Temerk, M. S. Ibrahim and M. Kotb, Voltammetric and spectroscopic studies on binding of antitumor morin, morin–Cu complex and morin-β-cyclodextrin with DNA, Spectrochim. Acta, Part A, 2009, 71, 1830–1836 CrossRef PubMed.
- M. Catalán, A. Álvarez-Lueje and S. Bollo, Electrochemistry of interaction of 2-(2-nitrophenyl)-benzimidazole derivatives with DNA, Bioelectrochemistry, 2010, 79, 162–167 CrossRef PubMed.
- A. Shah, V. C. Diculescu, R. Qureshi and A. M. Oliveira-Brett, Electrochemical reduction mechanism of camptothecin at glassy carbon electrode, Bioelectrochemistry, 2010, 79, 173–178 CrossRef PubMed.
- B. Chun-Li, Z. Qing-Xiang, Y. Li-Jun, X. Hua-Yu, Z. Xiu-Hua and W. Sheng-Fu, Voltammetric studies of the interaction of rutin with DNA and its analytical applications on the MWNTs–COOH/Fe3O4 modified electrode, Sens. Actuators, B, 2011, 156, 615–620 CrossRef.
- M. L. Yola and N. Ozaltın, Electrochemical studies on the interaction of an antibacterial drug nitrofurantoin with DNA, J. Electroanal. Chem., 2011, 653, 56–60 CrossRef.
- R. Hajian and T. G. Huat, Electrochemical Study on the Interaction of Irinotecan with Calf Thymus Double Stranded DNA, Chin. J. Chem., 2012, 30, 738–742 CrossRef.
- Y. M. Temerk, M. S. Ibrahim, M. Kotb and W. Schuhmann, Interaction of antitumor flavonoids with dsDNA in the absence and presence of Cu(II), Anal. Bioanal. Chem., 2013, 405, 3839–3846 CrossRef PubMed.
- B. Dogan-Topal, B. Bozal-Palabiyik, S. A. Ozkan and B. Uslu, Investigation of anticancer drug lapatinib and its interaction with dsDNA by electrochemical and spectroscopic techniques, Sens. Actuators, B, 2014, 194, 185–194 CrossRef.
- Y. Temerk and H. Ibrahim, Binding mode and thermodynamic studies on the interaction of the anticancer drug dacarbazine and dacarbazine–Cu(II) complex with single and double stranded DNA, J. Pharm. Biomed. Anal., 2014, 95, 26–33 CrossRef PubMed.
- S. A. Ozkan, Electroanalytical Methods in Pharmaceutical Analysis and their Validation, HNB Pub, New York, 1st edn, 2012 Search PubMed.
- S. N. Topkaya, S. Aydinlik, N. Aladag, M. Ozsoz and D. Ozkan-Ariksoysal, Different DNA immobilization strategies for the interaction of anticancer drug irinotecan with DNA based on electrochemical DNA biosensors, Comb. Chem. High Throughput Screening, 2010, 13, 582–589 CrossRef PubMed.
- B. D. -Topal and S. A. Ozkan, A novel sensitive electrochemical DNA biosensor for assaying of anticancer drug leuprolide and its adsorptive stripping voltammetric determination, Talanta, 2011, 83, 780–788 CrossRef PubMed.
- N. Karadas, S. Sanli, B. Akmese, B. D. -Topal, A. Can and S. A. Ozkan, Analytical application of polymethylene blue-multiwalled carbon nanotubes modified glassy carbon electrode on anticancer drug irinotecan and determination of its ionization constant value, Talanta, 2013, 115, 911–919 CrossRef PubMed.
- M. L. Rothenberg, Irinotecan (CPT-11): recent developments and future directions—colorectal cancer and beyond, Oncologist, 2001, 6, 66–80 CrossRef PubMed.
- Y. Xu and M. A. Villalona-Calero, Irinotecan: mechanisms of tumor resistance and novel strategies for modulating its activity, Ann. Oncol., 2002, 13, 1841–1851 CrossRef PubMed.
- A. H. Hegde, S. N. Prashanth and J. Seetharamappa, Interaction of antioxidant flavonoids with calf thymus DNA analyzed by spectroscopic and electrochemical methods, J. Pharm. Biomed. Anal., 2012, 63, 40–46 CrossRef PubMed.
- M. V. Pozo, C. Alonso, F. Pariente and E. Lorenzo, DNA biosensor for detection of helicobacter pylori using phendione as the electrochemically active ligand in osmium complexes, Anal. Chem., 2005, 77, 2550–2557 CrossRef PubMed.
- B. Rafique, A. M. Khalid, K. Akhtar and A. Jabbar, Interaction of anticancer drug methotrexate with DNA analyzed by electrochemical and spectroscopic methods, Biosens. Bioelectron., 2013, 44, 21–26 CrossRef PubMed.
- R. Hajian and M. Tavokol, Interaction of anticancer drug methotrexate with ds-DNA analyzed by spectroscopic and electrochemical methods, J. Chem., 2012, 9, 471–480 Search PubMed.
- S. Tommasini, D. Raneri, R. Ficarra, M. L. Calabrò, R. Stancanelli and P. Ficarra, Improvement in solubility and dissolution rate of flavonoids by complexation with β-cyclodextrin, J. Pharm. Biomed. Anal., 2004, 35, 379–387 CrossRef PubMed.
- P. D. Ross and S. Subramanian, Thermodynamics of protein association reactions; forces contributing to stability, Biochemistry, 1981, 20, 3096–3102 CrossRef PubMed.
- X. Tian, Y. Song, H. Dong and B. Ye, Interaction of anticancer herbal drug berberine with DNA immobilized on the glassy carbon electrode, Bioelectrochemistry, 2008, 73, 18–22 CrossRef PubMed.
- D. W. Pang and H. D. Abruna, Micromethod for the investigation of the interactions between DNA and redox-active molecules, Anal. Chem., 1998, 70, 3162–3169 CrossRef PubMed.
Footnote |
| † Electronic supplementary information (ESI) available. See DOI: 10.1039/c8ra03231a |
| This journal is © The Royal Society of Chemistry 2018 |

