 Open Access Article
Creative Commons Attribution 3.0 Unported Licence
Effect of VIPS fabrication parameters on the removal of acetic acid by supported liquid membrane using a PES–graphene membrane support
Norlisa Harruddina,
Syed M. Saufi *a,
Che Ku M. Faizalb and
Abdul Wahab Mohammadc
aFaculty of Chemical and Natural Resources Engineering, Universiti Malaysia Pahang, Lebuhraya Tun Razak, 26300 Gambang, Pahang, Malaysia. E-mail: smsaufi@ump.edu.my
bFaculty of Engineering Technology, Universiti Malaysia Pahang, Lebuhraya Tun Razak, 26300 Gambang, Pahang, Malaysia
cDepartment of Chemical and Process Engineering, Faculty of Engineering and Built Environment, Universiti Kebangsaan Malaysia, 43600 Bangi, Selangor Darul Ehsan, Malaysia
First published on 16th July 2018
Abstract
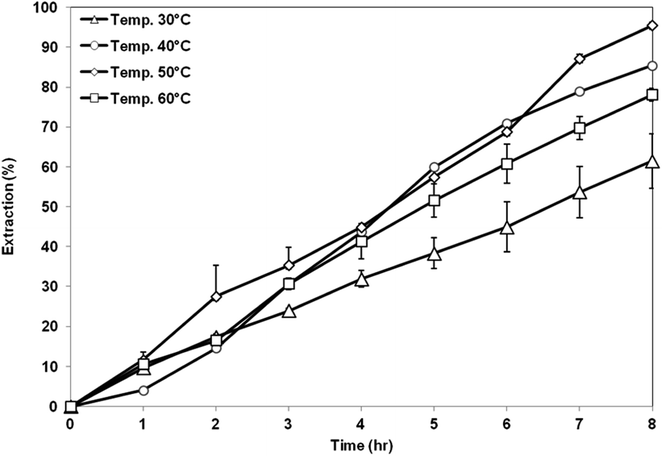
In this study, the removal of acetic acid by supported liquid membrane (SLM) using hybrid polyethersulfone (PES)–graphene membrane prepared by vapor induced phase separation (VIPS) was investigated. The effects of graphene loading, coagulation bath temperature, air exposure time, and air humidity on the morphology, mechanical strength, porosity, and contact angle of the membrane were analyzed. The performance and stability of the hybrid membrane as a SLM support for acetic acid removal were studied. The best PES–graphene membrane support was produced at a coagulation bath temperature of 50 °C, an air exposure time of 30 s and air humidity of 80%. The fabricated membrane has a symmetrical micropore cellular structure, high porosity and high contact angle. Under specific SLM conditions, almost 95% of acetic acid was successfully removed from 10 g L−1 aqueous acetic acid solution. The hybrid membrane remains stable for more than 116 h without suffering any membrane breakage during the continuous SLM process.
1 Introduction
Lignocellulosic biomass is an abundant organic material that can be used for sustainable production of biofuels, bioenergy and value added fine chemicals.1,2 Lignocellulosic biomass has to be hydrolyzed into fermented sugars before converting them to high value products through the fermentation process. The most common methods used to hydrolyze lignocellulosic biomass are by using acid hydrolysis. Sulphuric, hydrochloric or phosphoric acid are typically used in the hydrolysis at a moderate temperature around 100–150 °C and at an acid concentration of 1–10%.3 However, other byproducts such as furfural, hydroxymethylfurfural and acetic acids are also produced along with the sugars during the biomass hydrolysis. The formation of these compounds can inhibit the microorganism used in the fermentation process later. Acetic acid (AA) is found in large amounts in lignocellulosic biomass hydrolysate and considered as a serious inhibitor.4 Therefore, it must be removed from the biomass hydrolysate before the fermentation process.Various methods including nanofiltration,3,5 reverse osmosis,5,6 and reactive extraction7,8 have been proposed to remove acetic acid. However, each of these methods has their own restrictions such as high operating pressure, membrane fouling, low selectivity, and high energy consumption.9 The SLM process shows a great potential in removal and recovery of a desired solute. The removal and recovery processes in SLM occur in one single step, thus providing maximum driving force for the separation of desired solutes with high recovery rates. Nowadays, very few researchers had focused on the removal of AA from an aqueous phase using the SLM process.10
In SLM process, the polymeric membrane support plays an important role in the transport and performance of the process. For an efficient immersion of the organic liquid membrane phase inside the support, the microporous polymeric membrane with small pore size, high porosity, high tensile strength, high hydrophobicity and highly resistant to chemical should be used.11,12 Membrane support with high hydrophobicity is required to retain and keep an organic liquid membrane phase stable within the membrane pores by capillary action force.11 Hence, a development of microporous membrane support with suitable characteristic is critical in order to achieve excellent separation efficiency using SLM process. Previous studies had showed that incorporation of graphene into polymer matrix can enhance the hydrophobicity, chemical stability and tensile strength of the membrane.13–15 Therefore, graphene was selected as a filler to prepare hybrid PES membrane support in the current study to remove AA using SLM process.
The most common method to fabricate microporous membrane support is through phase inversion process. VIPS is one of the approaches that is used in the phase inversion process. In VIPS process, the membrane gel is exposed to a humid air at certain period before immersion into a coagulation bath. Phase separation occurs when the water associated with the humid air transfer to the membrane gel film.16 VIPS is widely applied in membrane manufacturing and offers several advantages such simplicity, low cost method and highly efficient technique to produce porous membrane.17 Chen et al.18 had produced microporous PES hollow fiber membrane with sponge like structure by using VIPS technique for filtering bovine serum albumin (BSA). Adjusting air humidity, air gap distance and CBT during VIPS process had significantly affected the permeation flux and BSA rejection. Hence, this method is suitable for the fabrication of membrane support for SLM application.
To date, most studies on the removal of acetic acid using SLM process were based on the commercial membrane support. Therefore, this study focused on the removal of acetic acid using a custom-made membrane prepared through VIPS process. In order to increase the membrane hydrophobicity, graphene nanofiller was blend into the membrane solution to make hybrid PES–graphene membrane support. The incorporation of graphene in polymer solution was challenged because graphene sheets are difficult to disperse due to strong van Der Waals between the fillers.19 To the best of our knowledge, no work has been reported on fabrication PES membrane incorporation with graphene using VIPS technique. The main parameters influenced the morphology and physical characteristic of the membrane such as concentration of graphene, coagulation bath temperature (CBT), exposure time and air humidity were studied.
2 Experimental procedure
2.1 Materials
PES (Radel A300) supplied by Amoco Chemicals, was used as a membrane material. The polymer was dried for 24 h at 60 °C. Dimethylacetamide (DMAc) purchased from Merck (Darmstadt, Germany) and polyethylene glycol (PEG 200) purchased from Sigma (St. Louis, MO) were used as solvent and nonsolvent, respectively, in dope polymer solution. Tap water was used as a coagulation medium in VIPS process. Meanwhile, graphene nanopowder was used as an inorganic filler in dope polymer solution where it was kindly supplied by the Low Dimensional Materials Research Centre, Universiti Malaya, Malaysia. In organic liquid membrane phase, tri-n-octylamine (TOA) and 2-ethyl-1-hexanol were used as a carrier and diluent, respectively. Both chemicals were supplied by Sigma Aldrich. Acetic acid and sodium hydroxide were used in the feed phase and as a stripping agent, respectively, in the SLM experiment. Both chemicals were obtained from Merck (Darmstadt, Germany).2.2 Membrane fabrication
The hybrid PES/graphene membrane was prepared by VIPS method. At first, the graphene nanoparticles were dispersed in DMAc by sonicating the mixture for 1 h. Sonication process can create shear stress and cavitation of graphene in the solvent. Then, under continuous stirring condition, PEG 200 and PES pellets were added to the mixture. This mixture was stirred for 48 h at room temperature to obtain a homogenous dope solution. Finally, the homogenous casting solution was degassed by putting it into the ultrasonic water bath for 24 h. The composition of the base polymer solution was 15 wt% of PES, 42.5% of DMAc and 42.5% of PEG 200. Different concentration of graphene from 0.1 to 1.0 wt% relative to the weight of PES were added into dope solution.The dope solution was cast onto a glass plate to form a membrane gel film with 380 μm thickness using semi-automatic casting machine. The membrane film was then exposed in the controlled air environment with relative humidity (RH) in the range of 70 to 100%. The exposure time in the humid air varied between 10 and 70 s. Then, the cast film was immersed into water coagulation bath at different temperatures, from 30 to 60 °C to induce solidification process. The membrane was finally dried at room temperature for 48 h.
2.3 Characterization of membrane
 | (1) |
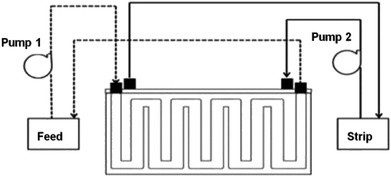
2.4 Supported liquid membrane process
 | (2) |
3 Results and discussion
3.1 Incorporation of graphene in the membrane support
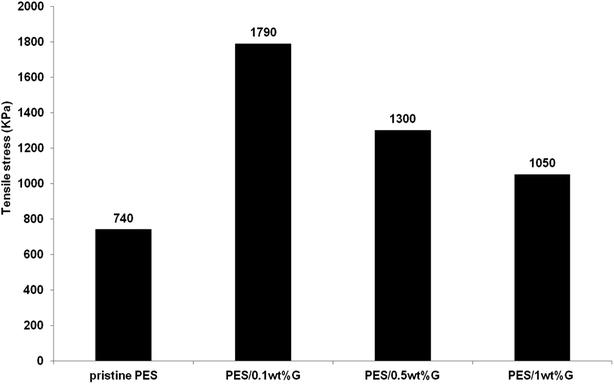
Graphene was selected as an inorganic filler in this study to improve the morphology, hydrophobicity and mechanical strength of the membrane support for SLM process. Different concentrations of graphene from 0.1 to 1.0 wt% were blended into dope solution to find the best graphene loading. The membranes were casted at CBT of 40 °C, air exposure time of 30 s and air humidity of 80%.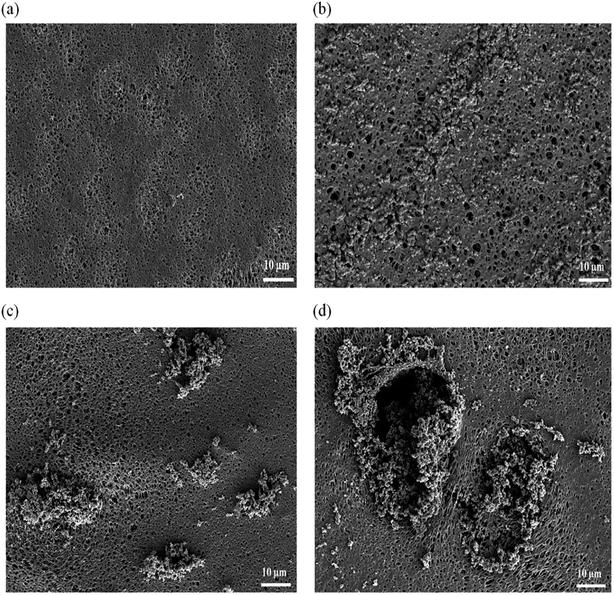 | ||
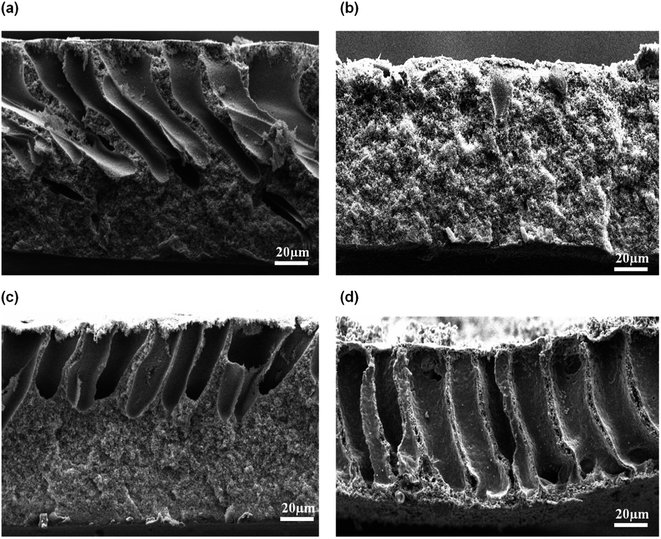
| Fig. 2 FESEM images of top surface membrane, (a) pristine PES, (b) PES/0.1 wt% graphene, (c) PES/0.5 wt% graphene, (d) PES/1.0 wt% graphene. | ||
However, further increase on the graphene content to 0.5 and 1.0 wt% resulted in small agglomeration of graphene at the membrane surface as shown in Fig. 2(c) and (d). This phenomenon occur due to van der Walls force among the neighboring particles of graphene.22,23 In previous study,20 graphene agglomeration occurred on the surface of PDMS–graphene/PES membrane when the concentration of filler increased up to 0.6 wt%. Agglomeration and random dispersion of the graphene on the membrane surface can interrupt the ability of graphene to exert its full potential in the membrane performance.
The cross sectional of the pristine PES membrane and PES–graphene membrane was showed in Fig. 3. Pristine PES membrane had an asymmetric structure composed of spongy like pores near the top skin followed by long cylindrical microvoids that uniformly distributed throughout the cross section of the membrane. Apparently, addition of low content of graphene filler (0.1 wt%) had significantly changed the overall membrane structure into a symmetric structure with a bicontinuous micropores (Fig. 3(b)). This pore structure is favorable as a support for the SLM system. However, the increment of the graphene loading to 0.5 and 1.0 wt% had induced the formation of spongy top skin layer and finger like macrovoids at the bottom layer of membranes as shown in Fig. 3(c) and (d).
| Membrane support | Contact angle (°) |
|---|---|
| Pristine PES | 81.92 ± 1.22 |
| PES/0.1 wt% graphene | 122.35 ± 2.14 |
| PES/0.5 wt% graphene | 108.61 ± 7.38 |
| PES/1.0 wt% graphene | 100.92 ± 0.37 |
3.2 Membrane morphological at different VIPS parameters
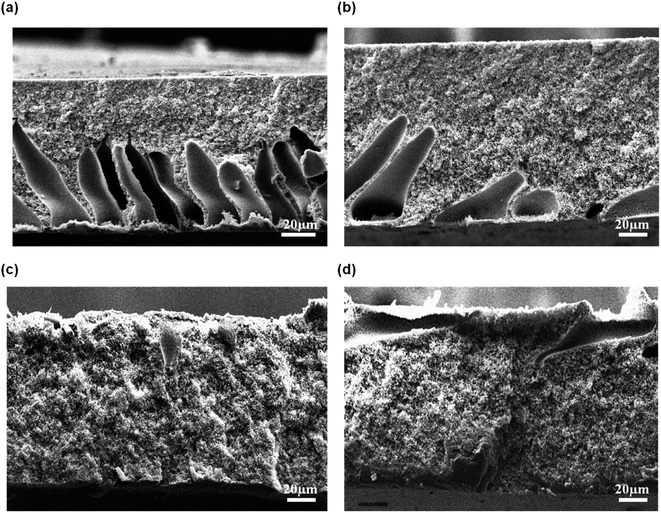 | ||
| Fig. 5 Cross-sectional of flat sheet membrane prepared at different CBT: (a) 30 °C, (b) 40 °C, (c) 50 °C, and (d) 60 °C. | ||
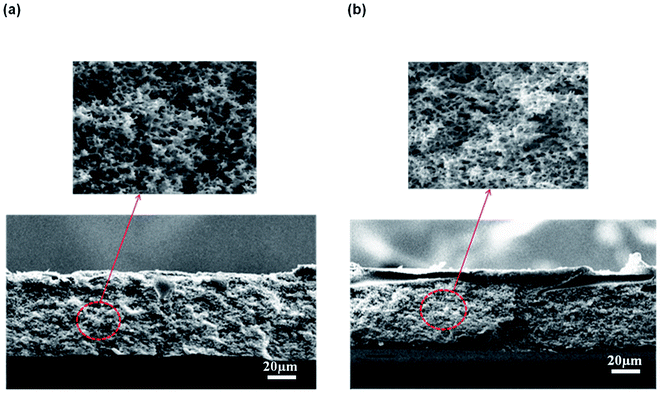 | ||
| Fig. 6 Micropores structure of the membrane support prepared at a CBT: (a) 50 °C and (b) 60 °C at 3000× magnification. | ||
The formation of the macrovoids and microporous structure can be explained by the phase inversion of the kinetics theory. Immersion process of the membrane solution into the coagulation bath is a demixing process. The demixing process occurs when the nuclei of polymer lean phase continue to grow with the continuation of the non-solvent and solvent exchange until the polymer concentration reaches a high level and solidification occurs. At this stage, the demixing process is completed.27 The level of the demixing process affects the membrane structures significantly. Low CBT causes instantaneous demixing process, which leads to the formation of macrovoids in the membrane structure, as shown in Fig. 5(a and b). Meanwhile, high CBT can delay the demixing process after a certain period of time, to which it can lead to the bicontinuous cellular structure formation.29 At this stage, large number of nuclei are created and distributed throughout the membrane cross-section and meanwhile, free growths of nuclei on the bottom layer are prevented.7 Besides, it can also enhance the micropores formation on membrane surface. This structure can be considered as symmetric membrane structure since it has uniform pore structure throughout the membrane cross-section.
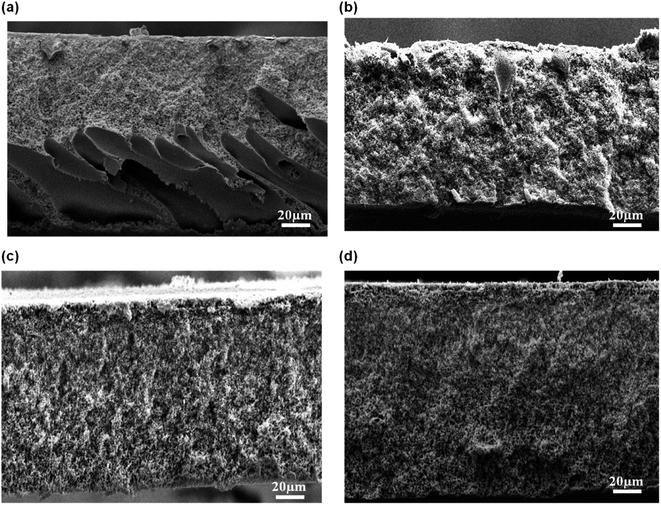 | ||
| Fig. 7 Cross-sectional of flat sheet membrane prepared at different exposure times: (a) 10 s, (b) 30 s, (c) 50 s, and (d) 70 s. | ||
At short exposure time, a delayed liquid–liquid demixing dominated. Hence, the formation of nuclei had occurred in a short time before the immersion into coagulation bath, thus leading to the development of open cell macrovoids. Liquid–liquid demixing had accelerated as the exposure time was increased and that had caused the polymer film to become cloudy due to the interaction with water vapor in the air. Liquid–liquid demixing occurred on top of the cast polymer through nucleation and growth, resulting in the formation cellular pores with interconnected structure. As a result, porous structure with symmetric membrane was obtained at higher exposure time.30
3.3 Membrane porosity
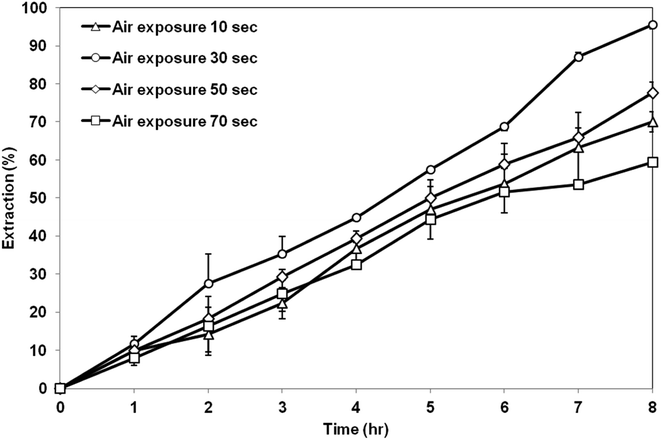
The porosity of the membrane is influenced by several factors such as the number of pores, pore size, tortuosity, and polarity.32 Generally, large pore size indicates that the membrane contains a lot of empty spaces inside and around the pores, hence resulting in high membrane porosity.33 The effect of CBT, air exposure time and air humidity on the membrane porosity is shown in Fig. 9. The porosity of the membrane was increased along with the CBT and exposure time, as clearly seen in Fig. 9(a) and (b). Previously, based on the SEM images in Fig. 5 and 7, it shows that the interconnection between the cellular pores and number of pores increased with increasing CBT and air exposure time, thus leading to high porosity value. Beside, large macrovoids form from top to bottom membrane at high humidity also lead to increasing porosity value as shown in Fig. 8. This trend can be related to the porous morphology of resultant membrane. High CBT had delayed the demixing process and reduced the polymer precipitation rate. Thus, it had led to the formation of porous cellular structure.29,34 Meanwhile, increasing the air exposure time to more than 30 s had provided sufficient time for water absorption to cause phase separation in the entire film. At exposure time more than 30 s, the mass transfer was slow in exposure stage, with the water intake from air, PES had sufficient time to crystallize and produce porous membrane.16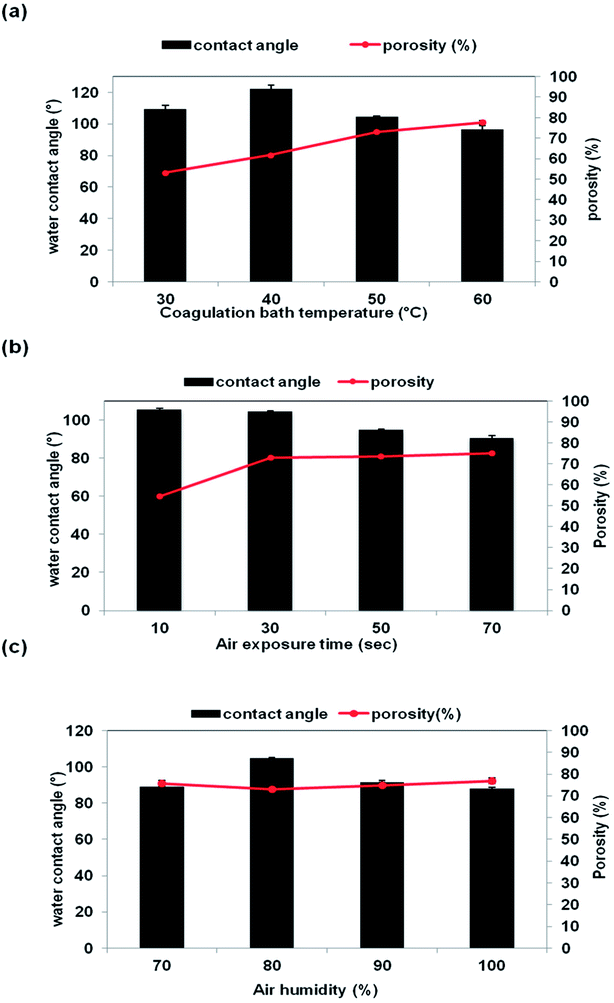 | ||
| Fig. 9 Porosity (%) and contact angle (°) of the membrane support prepared at different VIPS parameters: (a) CBT (b) air exposure time (c) air humidity. | ||
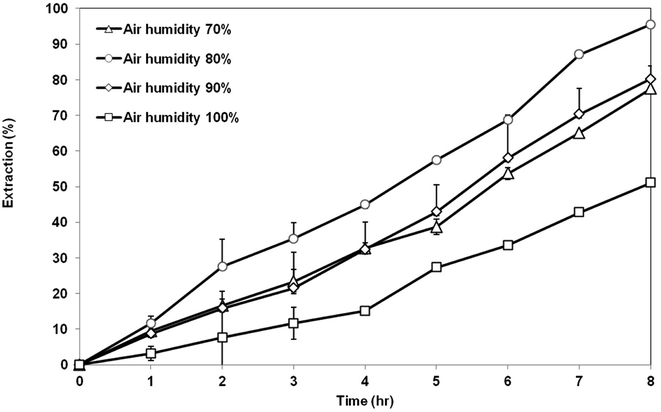
The membrane porosity is not related linearly with the air humidity, as shown in Fig. 9(c). The membrane porosity initially increased from 70% air humidity up to 80%. At 90% air humidity, the porosity decreased, but then increased back to 100% air humidity. The changes of porosity value of the membrane prepared at different air humidities have correlated well with the membrane morphology shown and explained previously in Fig. 8. Large macrovoids appeared at 70% air humidity and disappeared at 80% but the number of interconnected micropores was increased. Then, macrovoids reappeared at air humidity from 90% to 100%.
3.4 Contact angle properties
Fig. 9(a)–(c) show the water contact angle value as a function of CBT, exposure time and air humidity, respectively. The contact angle of the membrane was decreased, which meant less hydrophobicity when the CBT exposure time and air humidity were increased. The contact angle was reduced from 122° to 97° as the CBT increased from 40 °C to 60 °C. When the air exposure time increased from 10 s to 70 s, the contact angle of the membrane reduced from 106° to 95°. The contact angle reduction can be related with the changes on the pores structure and porosity of the membrane. An increment of the CBT and exposure time increased the porosity of the membrane, as shown in Fig. 9(a) and (b). Porous membrane exhibited lower contact angle compared to a dense membrane.27 As for the air humidity, the contact angle value decreased from 105° to 88° when the air humidity increased from 70% to 100%. The drop in contact angle can be related to the existence of large macrovoids in the membrane structure, especially for the membrane prepared at 100% humidity.3.5 SLM performance for acetic acid removal
3.6 Membrane stability in SLM process
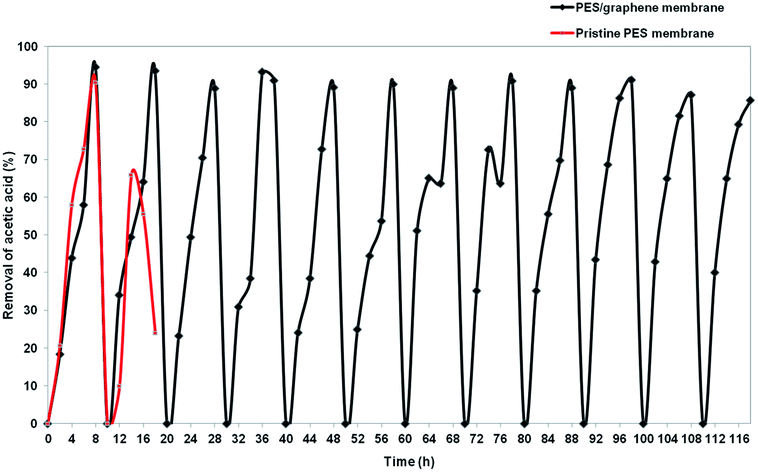
Insufficient stability of the membrane support is one of major problem that needs to be solved before applying SLM at industrial scale. Hybrid PES–graphene prepared at CBT 40 °C, 30 s of exposure time and 80% of air humidity was used in stability study to compare with pristine PES membrane. Fig. 13 exhibits the stability of pristine PES membrane and hybrid PES–graphene membrane during SLM process. The stability of the pristine PES membrane diminished after two SLM cycles (16 h). The removal percentage of AA drop from 90.4% to 56%. The breakage of pristine PES membrane had occurred which caused the fluctuation of the feed and strip phase solution. Pristine PES membrane had showed insufficient tensile strength and low chemical resistance. Corrosive chemicals can erode the surface of the membrane during SLM until breakage of the membrane support was occurred.37 As a result, the liquid membrane forced out from the membrane phase and progressive wetting of the membrane pores by aqueous solution take placed.12For hybrid PES–graphene membrane, it was observed that the membrane support remains stable during twelve SLM cycles (116 h). 94% of AA removal was achieved during first two SLM cycles and then the removal percentage was maintained at average value of 90%. Hybrid PES–graphene membrane had showed high stability for continuous run without required re-impregnation of the organic liquid membrane into the membrane support. The addition of graphene significantly improved the stability of SLM due to enhancement of tensile strength and hydrophobicity of the membrane. High hydrophobicity and high mechanical strength of the membrane support can extend the lifetime of SLM process by dramatically reduce the loss of liquid membrane and inhibit the water flooding in the membrane surface.38
4 Conclusion
Microporous hybrid PES–graphene membrane membranes have been successfully prepared by the VIPS method at different coagulation bath temperatures, air exposure times and air humidities. The membrane prepared at a coagulation bath temperature of 50 °C, air exposure time of 30 s and air humidity of 80% exhibited a symmetric structure with microporous cellular pores, high hydrophobicity, high porosity and high mechanical strength. Due to this suitable morphology and properties of this membrane, almost 95% of AA was successfully removed from an aqueous solution using the SLM process. The hybrid PES–graphene membrane remains stable for more than 116 h compared to the pristine PES membrane that only showed 16 h stability. Hence, the hybrid membrane has high potential to be applied in real industrial application.Conflicts of interest
There are no conflicts to declare.Acknowledgements
The authors would like to express their gratitude to the Ministry of Higher Education Malaysia for the financial support provided under the Fundamental Research Grant Scheme (FRGS – RDU170117). Special thanks to Dr Huang Nay Ming from Low Dimensional Materials Research Centre, Universiti Malaya, Malaysia for providing nano-graphene during this study.References
- Z. Anwar, M. Gulfraz and M. Irshad, J. Radiat. Res. Appl. Sci., 2014, 7, 163–173 CrossRef.
- J. Tae, J. F. Kim, H. Hyun, E. Drioli and Y. Moo, J. Membr. Sci., 2016, 514, 250–263 CrossRef.
- L. Ahsan, M. S. Jahan and Y. Ni, Bioresour. Technol., 2014, 155, 111–115 CrossRef PubMed.
- D. L. Grzenia, D. J. Schell and S. R. Wickramasinghe, J. Membr. Sci., 2008, 322, 189–195 CrossRef.
- A. Teella, G. W. Huber and D. M. Ford, J. Membr. Sci., 2011, 378, 495–502 CrossRef.
- F. Zhou, C. Wang and J. Wei, J. Membr. Sci., 2013, 429, 243–251 CrossRef.
- E. Saljoughi, M. Amirilargani and T. Mohammadi, Desalination, 2010, 262, 72–78 CrossRef.
- G. Yang, M. S. Jahan, L. Ahsan and Y. Ni, Sep. Purif. Technol., 2013, 120, 341–345 CrossRef.
- Y. Du, L. Xie, Y. Liu, S. Zhang and Y. Xu, Desalination, 2015, 365, 365–380 CrossRef.
- Y. Peng, H. Fan, Y. Dong, Y. Song and H. Han, Appl. Surf. Sci., 2012, 258, 7872–7881 CrossRef.
- P. K. Parhi, Journal of Chemistry, 2013, 2013, 11 CrossRef.
- P. Dżygiel and P. P. Wieczorek, in Liquid Membranes, ed. S. K. Vladimir, Elsevier, Amsterdam, 2010, pp. 73–140 Search PubMed.
- X. Yang, H. Duan, D. Shi, R. Yang, S. Wang and H. Guo, Chem. Eng. Process., 2015, 93, 79–86 CrossRef.
- D. Yang, S. Yang, Z. Jiang, S. Yu, J. Zhang, F. Pan, X. Cao, B. Wang and J. Yang, J. Membr. Sci., 2015, 487, 152–161 CrossRef.
- D. A. Zha, S. Mei, Z. Wang, H. Li, Z. Shi and Z. Jin, Carbon, 2011, 49, 5166–5172 CrossRef.
- S. P. Sun, T. A. Hatton, S. Y. Chan and T.-S. Chung, J. Membr. Sci., 2012, 401–402, 152–162 CrossRef.
- H. Caquineau, P. Menut, A. Deratan, C. Dupuy and P. E. Bataillon, Polym. Eng. Sci., 2003, 43, 798–808 CrossRef.
- G. Chen, J. Li, L. Han, Z. Xu and L. Yu, Iran. Polym. J., 2010, 19, 863–873 Search PubMed.
- Y. J. Noh, H. I. Joh, J. Yu, S. H. Hwang, S. Lee, C. H. Lee, S. Y. Kim and J. R. Youn, Sci. Rep., 2015, 5, 1–7 Search PubMed.
- A. K. Dizaji, H. R. Mortaheb, B. Mokhtarani and S. Rahmani, Chem. Eng. Res. Des., 2017, 124, 181–192 CrossRef.
- M. Liu, Y. Duan, Y. Wang and Y. Zhao, Mater. Des., 2014, 53, 466–474 CrossRef.
- W. Long, Nanomaterials, 2018, 8, 31 CrossRef PubMed.
- R. M. R. Shagor, PhD thesis, Wichita State University, 2015.
- O. Leenaerts, B. Partoens and F. M. Peeters, Phys. Rev. B, 2009, 79, 235440 CrossRef.
- R. Asmatulu, M. Ceylan and N. Nuraje, Langmuir, 2011, 27, 504–507 CrossRef PubMed.
- D. G. Papageorgiou, I. A. Kinloch and R. J. Young, Prog. Mater. Sci., 2017, 90, 75–127 CrossRef.
- J. Xu, Y. Tang, Y. Wang, B. Shan, L. Yu and C. Gao, J. Membr. Sci., 2014, 455, 121–130 CrossRef.
- E. Curcio, G. Di and E. Drioli, Chem. Eng. Trans., 2016, 47, 421–426 Search PubMed.
- C. H. Loh and R. Wang, Chin. J. Chem. Eng., 2011, 20, 71–79 CrossRef.
- R. Thomas, M. Bilad and H. Arafat, in Membrane Fabrication, Taylor & Francis Group, 2016, pp. 551–558 Search PubMed.
- H. A. Tsai, C. Y. Kuo, J. H. Lin, D. M. Wang, A. Deratani, C. Pochat-Bohatier, K. R. Lee and J. Y. Lai, J. Membr. Sci., 2006, 278, 390–400 CrossRef.
- J. Dai, X. Xu, J. Yang, N. Zhang, T. Huang, Y. Wang, Z. Zhou and C. Zhang, RSC Adv., 2015, 5, 20663–20673 RSC.
- A. Akbari and R. Yegani, J. Membr. Sci. Technol., 2012, 1, 100–107 Search PubMed.
- J.-S. Chen, S.-L. Tu and R.-Y. Tsay, J. Taiwan Inst. Chem. Eng., 2010, 41, 229–238 CrossRef.
- J. Lv, Q. Yang, J. Jiang and T.-S. Chung, Chem. Eng. Sci., 2007, 62, 6032–6039 CrossRef.
- N. M. Kocherginsky, Q. Yang and L. Seelam, Sep. Purif. Technol., 2007, 53, 171–177 CrossRef.
- S. Panja, P. K. Mohapatra, P. Kandwal, S. C. Tripathi and V. K. Manchanda, Desalination, 2010, 262, 57–63 CrossRef.
- H. Sun, J. Yao, H. Cong, Q. Li, D. Li and B. Liu, Chem. Eng. Res. Des., 2017, 126, 209–216 CrossRef.
| This journal is © The Royal Society of Chemistry 2018 |

