DOI:
10.1039/C8RA03271H
(Paper)
RSC Adv., 2018,
8, 21993-22003
Raw walnut shell modified by non-thermal plasma in ultrafine water mist for adsorptive removal of Cu(II) from aqueous solution
Received
17th April 2018
, Accepted 5th June 2018
First published on 14th June 2018
Abstract
Non-thermal plasma in ultrafine water mist (UWM) is proposed to increase the content of COOH groups on the surface of raw walnut shell in order to improve its performance in the removal of Cu(II) from wastewater. The modified walnut shell surface was characterized by various techniques (BET, SEM-EDX and XPS), and it was observed that more COOH groups were generated. Oxygen disassociated from water mist by plasma bonded with the walnut shell to form activated sites of COOH groups. After Cu(II) adsorption, the COOH group content in the walnut shell decreased because some groups were changed into C–O groups by Cu(II) chemisorption with COOH groups. The Cu(II) removal efficiency was 33.5% for raw walnut shell; however, the efficiency increased to 98% after plasma modification for 15 min under 3 g min−1 water mist. The maximum Cu(II) adsorption capacity of the UWM-plasma-modified WNS was 39.4 mg g−1 at pH 5.3 and 25 °C, around 8 times that of the raw WNS. This implies that UWM-plasma modification is a potential method for improving the Cu(II) adsorption performance of raw biomass.
1. Introduction
Copper ion (Cu(II)) is a wastewater contaminant that is mainly discharged from industrial procedures of metal cleaning, mining, metal-process picking, chemical manufacturing and plating.1 Cu(II) is one of the most toxic heavy metals; it can accumulate in living organisms via the food chain as a non-biodegradable pollutant, leading to serious damage to the human body.2 In order to remove Cu(II) from wastewater before inflowing into human water resources, many techniques, such as adsorption, chemical precipitation, ion exchange, biosorption, membrane separation and electrocoagulation, have been developed.3,4 Among these, adsorption is considered to be an effective and economic technology because various adsorbents can be produced from agricultural and forestry residues (usually biomass) with significance for “dealing with waste by waste”.5–7
Biomass has advantages of low cost and sustainable availability. Through pyrolysis and physical or chemical treatment of biomass, products such as biochar, activated carbon and synthesized adsorbents have been used for adsorption of Cu(II) and/or other heavy metal ions with favorable physical/chemical surface properties.8 Biochar is usually produced from incomplete pyrolysis of carbon-rich biomass at 300 °C to 900 °C for several hours.9 Biochar has good sorption ability for Cu(II) due to its abundance of oxygen-containing functional groups.1 Many researchers have modified biochar using chemical agents (such as FeCl3 and ZnCl2) to further improve its adsorption performance.10 Activated carbon with a highly developed porous texture for favorable adsorption performance was produced in high-temperature (500 °C to 900 °C) atmosphere involving activating agents, such as H2O (g) and CO2 for physical activation and ZnCl2, KOH, K2CO3 and H3PO4 for chemical activation.11–13 The synthesized adsorbent was produced with selected chemical agents to develop specific functional groups for target ion removal. This process is usually carried out at 40 °C to 60 °C and consumes a large number of chemical agents.14 The abovementioned processes for preparing biomass-derived adsorbents necessitate high energy consumption and chemical disposal. It is desirable to construct a simple, low-energy-consuming and environmentally friendly process for adsorbent production.
To achieve this objective, non-thermal plasma in ultrafine water mist (UWM) was employed to modify raw biomass; then, the modified biomass was directly used as an adsorbent for Cu(II) removal. It is known that non-thermal plasma can generate energetic electrons and highly active radicals that increase the active functional groups on the surface of adsorbents.15,16 The plasma modification equipment is simple and consumes low energy; neither high temperature pyrolysis nor chemical agents are involved. Moreover, H2O plasma media is clean, inexpensive and readily available. It has been reported that water vapor plasma can generate oxygen-containing functional groups,17 which have positive effects on the Cu(II) adsorption process.18 In the literature,17,19,20 an additional heat source (i.e. 60 °C to 100 °C) and/or vacuum conditions were required to change liquid water to vapor (gas-phase) in an experimental plasma system. However, this method requires a complex device system and is expensive. In this study, instead, a simple and effective method is proposed where ultrafine water mist is first introduced by atomization in ambient temperature for non-thermal plasma modification of raw biomass. The effects of modification time, UWM mass flow rate and different plasma atmospheres on Cu(II) removal efficiency were investigated. Brunauer–Emmett–Teller (BET), scanning electron microscopy, energy dispersive X-ray (SEM-EDX) and X-ray photoelectron spectroscopy (XPS) tests were also conducted to explore the UWM-plasma modification process and Cu(II) adsorption mechanisms on modified walnut shell.
2. Materials and methods
2.1. Sample pretreatment
The walnut shell (WNS) used in this study was collected from Tianjin, China. The raw walnut shell was ground and sieved to a particle size of 0.35 to 0.56 mm and then washed with distilled water to remove impurities. The moisture in the walnut shell particles was removed by drying for 12 h at 105 °C.
Fig. 1a shows the experimental setup of non-thermal UWM-plasma modification. The non-thermal plasma was generated using a dielectric barrier discharge (DBD) reactor (DBD-100A, CTP-2000K, Suman Corporation, China). Two quartz circular plates 70 mm in diameter and 3 mm thick were used as barrier materials, and two stainless steel plates 50 mm in diameter were used for electrodes. The barrier-to-barrier gap was 8 mm. 1.0 g of walnut shell particles were evenly spread in the DBD plasma reactor. An ultrasonic nebulizer was used to atomize the distilled water into an ultrafine mist 1 to 10 μm in diameter at room temperature (25 °C), as shown in Fig. 1b. Then, the ultrafine water mist and highly pure Ar (99.9%, vol. base) were mixed and introduced into the plasma reactor at room temperature. The gas flow rate of Ar was maintained as a constant of 100 ml min−1. The pressure of the reactor chamber was controlled at 95 kPa via a vacuum pump (BUCHI, Switzerland). Each flow rate was adjusted using a mass flow meter. The UWM mass flow rate was varied from 0.5 to 3 g min−1. The modified walnut shell was designated as WNS-WxTy according to different processing conditions. Wx denotes x g min−1 of UWM mass flow rate, and Ty denotes y minute of plasma modification time. For example, WNS-W3T15 indicates that the WNS was modified by plasma in 3 g min−1 UWM for 15 min. Additionally, samples of WNS-W3 (the WNS was placed in 3 g min−1 UWM atmosphere for 15 min without non-thermal plasma modification) and WNS-T15 (the WNS was modified with non-thermal plasma under Ar atmosphere without UWM) were compared to study the effects of UWM-plasma modification on the Cu(II) adsorption performance of walnut shell. The non-thermal plasma was produced in the DBD reactor via an alternating current with a 10 kHz audio frequency and 5 kV peak voltage. A digital oscilloscope was used to measure the input power via Lissajous diagrams. The discharge power for non-thermal plasma was 75 W.
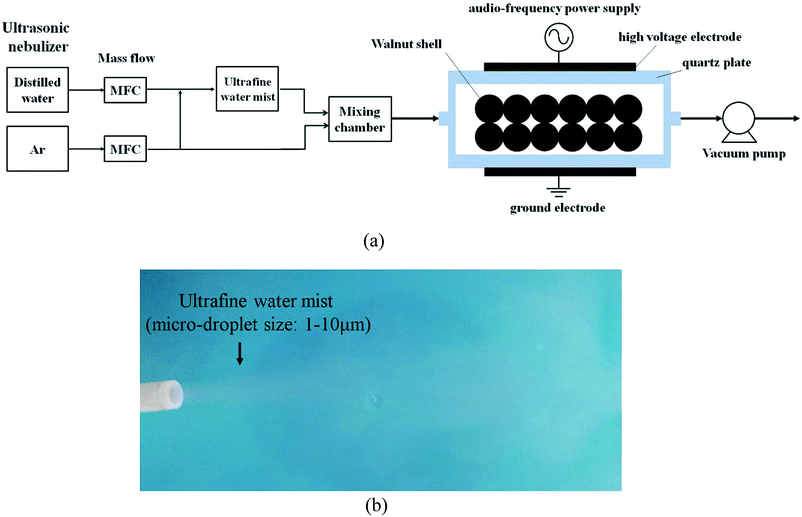 |
| | Fig. 1 (a) Schematic of the treatment system of non-thermal plasma in ultrafine water mist and (b) image of the ultrafine water mist. | |
2.2. Chemicals
The stock solutions of Cu(II) were prepared by dissolving CuSO4·5H2O in deionized water to a concentration of 1.0 g L−1 and then diluting this solution to the appropriate concentration for each test. All chemicals used in this study were of analytical grade.
2.3. Cu(II) adsorption
Batch adsorption experiments were conducted by mixing 0.5 g prepared walnut shell samples with 50 ml prepared Cu(II) solution at the natural solution pH (5.3). The Cu(II) adsorption experiments were performed in a thermostated rotary shaker (ZWY-103B, ZHICHENG Corporation, China) for a period of 2 h at 300 rpm using a 100 ml screw-cap conical flask with 50 ml prepared Cu(II) solution at room temperature (25 ± 0.5 °C). Before measuring the Cu(II) concentration in the solution for each case, the adsorbent was separated from the sample by filtering after adsorption at different time intervals. Then, the remaining concentration of Cu(II) in the filtrate was analyzed by a Cu(II) meter (S220 SevenCompact ion meter, Mettler-Toledo, Switzerland) with an accuracy of ±0.5%. In order to ensure good repeatability of the experimental data, each measurement was repeated at least three times. The error bars of the data were estimated based on the standard deviation of the measurements. The Cu(II) removal efficiency (ηt, %) was determined according to the following equation:| |
 | (1) |
where C0 (mg L−1) is the initial Cu(II) concentration and Ct (mg L−1) is the Cu(II) concentration at a contact time of t.
2.4. Regeneration tests
Adsorption–desorption regeneration cycle tests for Cu(II) removal were conducted to investigate the possibility of repeated use of the UWM-plasma modified WNS. The adsorption test was conducted at pH 5.3 with an initial Cu(II) concentration of 100 mg L−1, adsorbent dosage of 0.5 g/50 ml and agitation speed of 300 rpm. When the desorption test was conducted, the Cu(II)-loaded adsorbent was stirred with 0.1 mol L−1 HCl solution (pH 2) and was allowed 120 min of contact time at 25 °C (room temperature). The adsorption and desorption procedures were repeated for three cycles using the same activated carbon in different solutions.
2.5. Data analysis
The adsorption isotherms of Cu(II) on raw WNS and UWM-plasma modified WNS were fitted with the Langmuir model in this study.| |
 | (2) |
where Qmax (mg g−1) is the maximum capacity; b (L mg−1) is the Langmuir adsorption constant; Ce (mg L−1) is the equilibrium concentration of Cu(II); and qe (mg g−1) is the amount of Cu(II) adsorbed per unit mass of adsorbent at equilibrium.
The Pseudo-first-order model, Pseudo-second-order model and Weber–Morris model were implemented to analyze the adsorption kinetics of Cu(II) on raw WNS and UWM-plasma modified WNS:
| |
Pseudo-first-order model: ln(qe − qt) = ln![[thin space (1/6-em)]](https://www.rsc.org/images/entities/char_2009.gif) qe − k1t qe − k1t
| (3) |
| |
 | (4) |
| |
 | (5) |
where
k1 (min
−1) is the rate constant of the Pseudo-first-order equation;
k2 (g (mg
−1 min
−1)) is the rate constant of the Pseudo-second-order equation;
kint (mg (g
−1 min
1/2)) is the intraparticle diffusion rate constant; and
C (mg g
−1) is a constant related to the boundary layer effect of adsorption.
2.6. Sample characterization
The textural properties of the raw walnut shell and plasma modified walnut shell particles were determined by measuring N2 adsorption–desorption isotherms at 77 K (Belsorp-max, MicrotracBEL Corp., Japan). The morphological features of the samples were characterized by scanning electron microscopy (SEM, Nanosem 430, FEI, USA), and their elemental compositions (C/N/O/P/Cu) were analysed by energy dispersive X-ray (EDX). The surface bindings of the samples were characterized by X-ray photoelectron spectroscopy (XPS) with surface excitation at 1253 eV by an Mg X-ray source (PHI 5300 ESCA system, PerkinElmer, USA). The XPS spectra were calibrated by setting the binding energy of C1s at 285 eV.
3. Results and discussion
Fig. 2a shows the Cu(II) removal efficiencies of raw WNS, WNS-W8, WNS-T15 and WNS-W8T15. For each sample, the Cu(II) removal efficiency increased with adsorption contact time and reached an equilibrium value in about 90 min; it then maintained a constant value with further increase in contact time. Thus, the adsorption duration was fixed at 120 min to assure that equilibrium was reached. As shown in Fig. 2a, the Cu(II) removal ability of raw WNS was poor; its removal efficiency was only 33.5%. The Cu(II) removal performance of WNS-W3 and WNS-T15 was similar to that of raw WNS. This indicates that the process of placing the WNS in UWM atmosphere without non-thermal plasma modification had no effect on the WNS. Also, the process of modification with non-thermal plasma without UWM did not enhance the Cu(II) removal performance of WNS. In contrast, UWM-plasma modification showed a significant positive effect on the Cu(II) removal efficiency of WNS. The removal efficiency of WNS-W3T15 reached 98%, which is promising for the removal of Cu(II) from wastewater. This indicates that non-thermal UWM-plasma modification greatly increased the Cu(II) removal efficiency of WNS. Meanwhile, UWM and non-thermal plasma were both requisite factors for WNS modification.
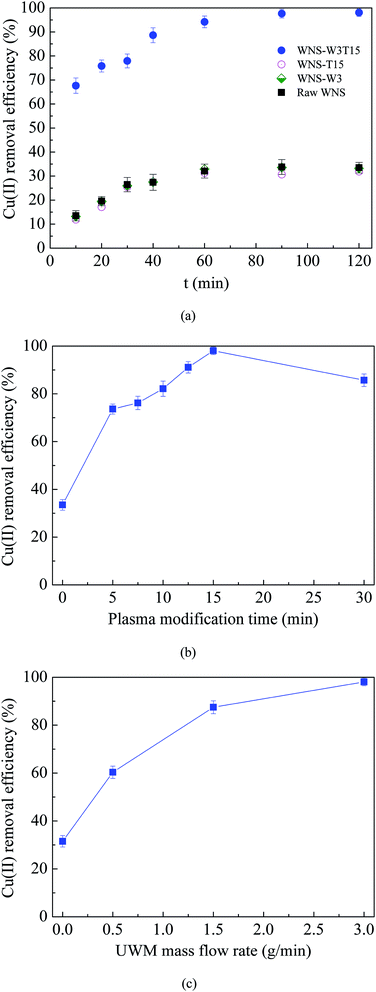 |
| | Fig. 2 (a) Cu(II) removal efficiency curves of raw WNS, WNS-W3 (placed in 3 g min−1 UWM for 15 min without plasma modification), WNS-T15 (modified by plasma in Ar without UWM for 15 min), and WNS-W3T15 (modified by plasma with 3 g min−1 UWM for 15 min); (b) effects of plasma modification time on Cu(II) removal efficiency; (c) effects of UWM mass flow rate on Cu(II) removal efficiency. (Conditions: T = 25 °C, pH 5.3, initial Cu(II) concentration: 100 mg L−1). | |
Fig. 2b shows the effects of plasma modification time (0 to 30 min) with 3 g min−1 UWM on the Cu(II) removal efficiency of WNS. The modification time of 0 min represents raw WNS without plasma modification. It can be seen that the Cu(II) removal efficiencies on the WNS modified with UWM-plasma were significantly higher than those on the raw WNS (modified for 0 min). The WNS modified for only 5 min by non-thermal plasma with 3 g min−1 UWM triggered a sharp increase in the removal efficiency from 33.5% to 74%. With increasing modification time from 5 to 15 min, the removal efficiency gradually increased from 74% to 98%. However, a further increase to 30 min modification time had a negative effect on the removal efficiency, where the efficiency decreased to 85.7%. This indicates that the use of UWM-plasma to modify WNS can effectively improve its removal efficiency for Cu(II). Moreover, the optimum plasma modification time should be considered because excess modification has a negative effect on Cu(II) removal. The use of UWM-plasma was proposed to modify the WNS by producing more O-containing groups on the WNS surface, which are important for Cu(II) adsorption. Thus, the UWM mass flow rate (i.e. the H2O content in the plasma system), which determines the amount of O-containing groups during the plasma modification process,17,21 affects the Cu(II) removal performance of modified WNS. The effects of the UWM mass flow rate on Cu(II) removal efficiency with 15 min plasma modification are shown in Fig. 2c. The results show that the UWM mass flow rate had a positive effect on the removal efficiency, where the Cu(II) removal efficiency generally increased with the UWM mass flow rate: WNS-W3T15 (98%) > WNS-W1.5T15 (87.5%) > WNS-W0.5T15 (60.3%) > WNS-T15 (31.5%). It can be inferred that the content of O-containing groups increased with increasing UWM mass flow rate during the plasma modification process, resulting in improvement of the Cu(II) adsorption performance.
Fig. 3a and b show the adsorption isotherms of Cu(II) on raw WNS and WNS-W3T15 and the regression plots of the Langmuir isotherm model, respectively. The kinetics parameters obtained from the Langmuir model are listed in Table 1. It can be observed that the adsorption data of Cu(II) by raw WNS and WNS-W3T15 were well fitted by the Langmuir model (R2 values in the range of 0.927 to 0.994), indicating that the Cu(II) adsorption by raw WNS and UWM-plasma modified WNS involved monolayer coverage. Importantly, the maximum Cu(II) adsorption capacity of WNS-W3T15 is 39.4 mg g−1, nearly 8 times that of the raw WNS (5.02 mg g−1). Table 2 lists some other adsorbents for Cu(II) adsorption as reported in the literature for comparison. It can be seen that the UWM-plasma modified WNS in this study had a much higher adsorption capacity than commercial activated carbon and other activated carbons derived from biomass.12,22–27 Fig. 4a shows the Cu(II) removal efficiencies for raw WNS and WNS-W3T15 under different pH conditions. Generally, the Cu(II) removal efficiency increased with increasing pH for both raw WNS and WNS-W3T15. Moreover, the Cu(II) removal efficiency of WNS-W3T15 was much higher than that of raw WNS for each pH value. Fig. 4b shows the Cu(II) adsorption–desorption regeneration results of WNS-W3T15. Although a decrease of the Cu(II) removal efficiency was observed, WNS-W3T15 still exhibited good adsorption performance after three cycles of regeneration, where the Cu(II) removal efficiency was approximately 82%. This demonstrates that UWM-plasma-modified WNS possesses excellent reusability for Cu(II) removal. In terms of practical use considerations, walnut shell can be readily obtained in large quantities, and the corresponding cost is much lower than that of activated carbon. Importantly, the UWM-plasma modified method used in this study is simple, inexpensive and non-chemical. Thus, UWM-plasma modification on walnut shell is a promising and feasible method for Cu(II) removal in environmental applications.
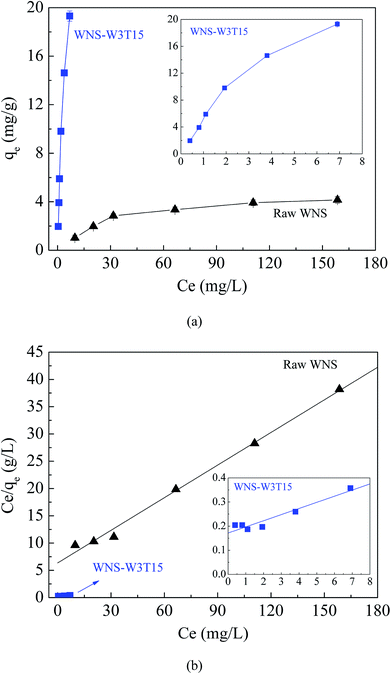 |
| | Fig. 3 (a) Adsorption isotherms of Cu(II) on raw WNS andWNS-W3T15; (b) the Langmuir isotherm model for Cu(II) adsorption on raw WNS and WNS-W3T15. (Conditions: T = 25 °C, pH 5.3). | |
Table 1 Isotherm parameters for Cu(II) adsorption onto raw WNS and WNS-W3T15
| Sample |
Langmuir model |
| Qmax (mg g−1) |
b (L mg−1) |
R2 |
| Raw WNS |
5.02 |
0.031 |
0.994 |
| WNS-W3T15 |
39.4 |
0.148 |
0.927 |
Table 2 Adsorption capacities of Cu(II) by various adsorbents
| Activated carbon source |
pH |
Temperature (°C) |
qe (mg g−1) |
Reference |
| Rice husk-based activated carbon |
5 |
40 |
15.8 |
12 |
| Poplar sawdust-based activated carbon |
5 |
20 |
13.5 |
22 |
| Olive waste cake-based activated carbon |
4.8 |
25 |
12.0 |
23 |
| Walnut shell-based activated carbon |
5 |
40 |
28.4 |
24 |
| Phaseolus aureus hull-based activated carbon |
7 |
30 |
19.5 |
25 |
| Apricot stone-based activated carbon |
6.5 |
25 |
22.8 |
26 |
| Activated carbon (Filtrasorb 200) |
4 |
25 |
24.1 |
27 |
| Commercial activated carbon (Hebei Province, China) |
5 |
40 |
12.6 |
24 |
| Raw walnut shell |
5.3 |
25 |
5.02 |
This study |
| UWM-plasma modified walnut shell |
5.3 |
25 |
39.4 |
This study |
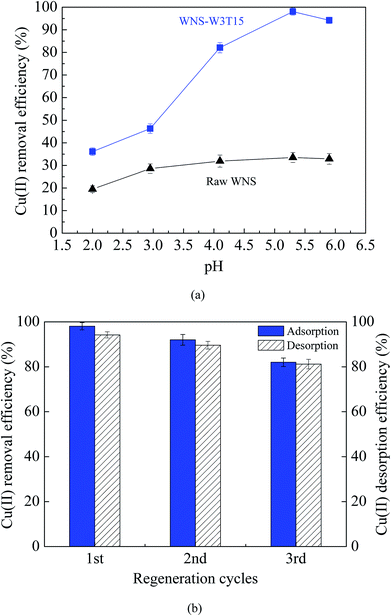 |
| | Fig. 4 (a) Effects of pH on the Cu(II) removal efficiency of raw WNS and WNS-W3T15 (conditions: T = 25 °C, initial Cu(II) concentration: 100 mg L−1); (b) the Cu(II) adsorption–desorption regeneration properties of WNS-W3T15. | |
The surface physical (porous structure) and chemistry (functional groups) properties of a carbon adsorbent determine its adsorption process of ionic species from solution. Porous structure is an important factor for physical adsorption, while surface functional groups play key roles in specific adsorption and surface reactions.28 The UWM-plasma modification increased the Cu(II) adsorption capacity of WNS, which implies that the porous structure and surface functional groups were changed during the plasma modification process. The surface morphologies and element analyses of raw WNS and UWM-plasma modified WNS from SEM-EDX analysis are shown in Fig. 5 and Table 3, respectively. Fig. 5 shows that the surface of raw WNS was rough and uneven and its structure was less porous. After the UWM-plasma modification, the surface of WNS presented an obviously porous structure with many craters and was covered with small particles. Moreover, the pore size increased after increasing the modification time. This can be ascribed to the plasma etching effect.29,30 Highly energetic electrons and active free radicals bombarded the external surface of WNS and produced the pore structure. Prolonged plasma modification time strengthened the etching effect and broadened the pore size. The specific surface areas of raw WNS and UWM-plasma modified WNS are shown in Table 3. After plasma modification, the specific surface area of WNS increased. This phenomenon is consistent with the results of the SEM analysis. However, the specific surface areas of plasma-modified WNS were very small (less than 1.2 m2 g−1). Importantly, as the UWM mass flow rate increased from 0.5 to 3 g min−1, the specific surface areas of the modified WNS decreased, whereas the Cu(II) removal efficiency increased. This indicated that physical adsorption was not a key factor in Cu(II) removal by modified WNS. The adsorption kinetics results of Cu(II) adsorption onto raw WNS and WNS-W3T15 are shown in Fig. 6 and Table 4. It can be seen that the Pseudo-second-order model satisfactorily fits the experimental data, with high correlation coefficients (R2 in the range of 0.9946 to 0.9985) compared to the Pseudo-first-order model (R2 in the range of 0.9314 to 0.9669) and the Weber–Morris model (R2 in the range of 0.8475 to 0.9029). Furthermore, the calculated values of qe according to the Pseudo-second-order model fitting were quite close to the experimental data. These results indicate that chemisorption dominates the Cu(II) adsorption process on raw WNS and UWM-plasma modified WNS.31
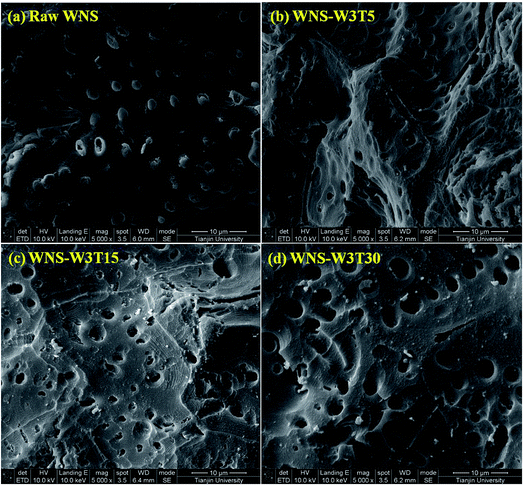 |
| | Fig. 5 SEM images of (a) raw WNS; (b) WNS-W3T5; (c) WNS-W3T15; (d) WNS-W3T30 (magnification: 5000×). | |
Table 3 Properties of raw and UWM-plasma modified walnut shell
| Sample |
Element analysis (wt%) |
SBET (m2 g−1) |
| C |
N |
O |
P |
Cu |
| Raw WNS |
50.4 |
4.06 |
44.33 |
1.21 |
0.0 |
0.56 |
| WNS-W3T5 |
45.72 |
5.7 |
47.52 |
1.06 |
0.0 |
0.71 |
| WNS-W0.5T15 |
47.48 |
5.84 |
45.41 |
1.28 |
0.0 |
1.11 |
| WNS-W1.5T15 |
48.06 |
4.36 |
46.72 |
0.86 |
0.0 |
0.95 |
| WNS-W3T15 |
44.09 |
5.11 |
50.01 |
0.8 |
0.0 |
0.88 |
| Used WNS-W3T15 |
42.8 |
6.31 |
46.8 |
1.34 |
2.75 |
— |
| WNS-W3T30 |
45.21 |
7.58 |
45.14 |
2.07 |
0.0 |
1.06 |
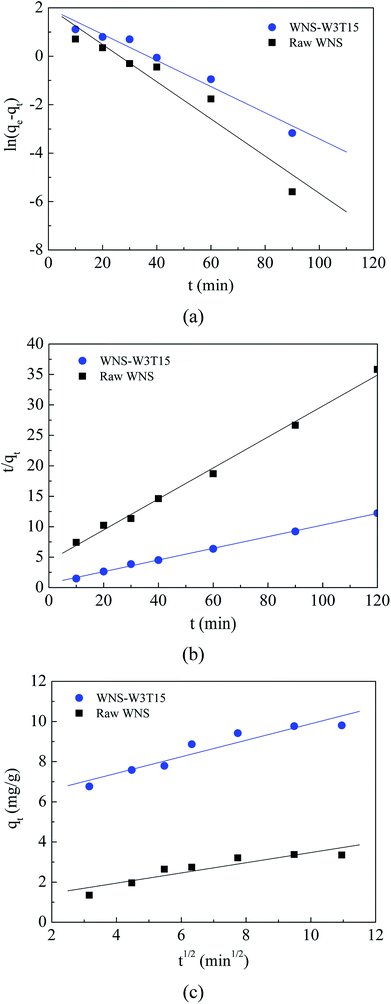 |
| | Fig. 6 Kinetics models for adsorption of Cu(II) on raw WNS and WNS-W3T15: (a) Pseudo-first-order model; (b) Pseudo-second-order model; (c) Weber–Morris model. | |
Table 4 Kinetics parameters of the Pseudo-first order, Pseudo-second order and Weber–Morris models for Cu(II) adsorption on raw WNS and WNS-W3T15
| Sample |
qe exp (mg g−1) |
Pseudo-first-order model |
Pseudo-second-order model |
Weber–Morris model |
| qe cal (mg g−1) |
k1 (min−1) |
R2 |
qe cal (mg g−1) |
k2 (g (mg−1 min−1)) |
R2 |
C |
kint (mg (g−1 min1/2)) |
R2 |
| Raw WNS |
3.35 |
7.56 |
0.077 |
0.9314 |
3.93 |
0.015 |
0.9946 |
0.9291 |
0.2545 |
0.8475 |
| WNS-W3T15 |
9.81 |
7.31 |
0.054 |
0.9669 |
10.4 |
0.013 |
0.9985 |
5.7735 |
0.4112 |
0.9029 |
To investigate the components of modified WNS, element analyses were performed. As shown in Table 3, the O contents of modified WNS were higher than that of raw WNS, indicating that UWM-plasma modification added O atoms to the WNS surface. Moreover, the O content increased with increasing UWM mass flow rate in the plasma system. When increasing modification time, the O content of WNS-W3T15 increased to a maximum and then decreased from 15 to 30 min. The O content of WNS-W3T15 was 50.01% (wt%); O was increased by about 5.5% compared to the raw WNS (44.33%). During the UWM-plasma modification process, the H2O mist dissociated into reactive radicals of O and OH, which are very powerful and nonselective oxidizing agents.21 The H2O dissociation in the plasma system can be given as follows:32,33 H2O + e → H + OH + e and OH + e → O + H + e. When the plasma modification time was longer than 15 min, over-etching may have occurred. At this time, the O radicals on the WNS surface would be transformed to O2 according to the reaction: O + O + e → O2 + e.32 Thus, the O content of WNS-W3T30 was lower than that of WNS-W3T15. In the UWM-plasma system, the presence of O and OH radicals can produce strong chemical oxidation effects and can generate O-containing functional groups on the WNS surface. It is known that O-containing functional groups (such as –COOH and –OH groups) are highly beneficial for the adsorption of Cu(II).18 On the other hand, the Cu content of freshly modified WNS (before Cu(II) adsorption) was 0%, whereas 2.75% Cu (wt base) was observed for the used WNS-W3T15 (after Cu(II) adsorption). This confirms that Cu(II) was adsorbed on the modified WNS surface.
Samples were analyzed by XPS to determine the chemical states present in UWM-plasma modified WNS. Fig. 7 shows the XPS survey spectra and C1s core level spectra for raw and plasma-modified WNS. As shown in Fig. 7a, carbon and oxygen are the main elements in raw WNS and UWM-plasma WNS; these peaks appear at 285 eV (C1s) and 531 eV (O1s), respectively. It is clear that the oxygen content significantly increased after UWM-plasma modification compared to the raw WNS. This result is consistent with the element analysis (as shown in Table 3), which confirms that the UWM-plasma modification process loaded oxygen element on the WNS surface. As shown in Fig. 7b, the C1s spectrum can be fitted by four characteristic peaks for each sample. The peak at 284.1 eV corresponds to C–C groups, the peak located at 285.5 eV is attributed to C–O groups, and the binding energy peaks at 286.6 eV and 288.1 eV correspond to C![[double bond, length as m-dash]](https://www.rsc.org/images/entities/char_e001.gif) O groups and COOH groups, respectively. The electron binding energies and relative intensities (calculated from the corresponding area of the small peak divided by the total area) of each peak are summarized in Table 5. It can be seen that the COOH group intensity of raw WNS was 3.5%. After UWM-plasma modification, the COOH group intensities of modified WNS were greatly increased. With increasing modification time from 5 to 15 min, the COOH group intensity of modified WNS increased from 11.4% (WNS-W3T5) to 22.1% (WNS-W3T15). A further increase in modification time resulted in a decrease in COOH group content. It can be seen that the COOH group intensity of WNS-W3T30 was 12.9%, which was less than that of WNS-W3T15. The COOH group content in WNS-W0.5T15 was 12.7%, indicating that the increase of H2O content in the plasma system enhanced the production of COOH groups on the WNS surface. The changes in the COOH groups are consistent with the O element analysis data in Table 3. This confirms that UWM-plasma generates COOH groups on the WNS surface. Based on the results of XPS analyses, the possible pathways for the formation and transformation of COOH groups during the UWM-plasma modification process can be described as follows:
O groups and COOH groups, respectively. The electron binding energies and relative intensities (calculated from the corresponding area of the small peak divided by the total area) of each peak are summarized in Table 5. It can be seen that the COOH group intensity of raw WNS was 3.5%. After UWM-plasma modification, the COOH group intensities of modified WNS were greatly increased. With increasing modification time from 5 to 15 min, the COOH group intensity of modified WNS increased from 11.4% (WNS-W3T5) to 22.1% (WNS-W3T15). A further increase in modification time resulted in a decrease in COOH group content. It can be seen that the COOH group intensity of WNS-W3T30 was 12.9%, which was less than that of WNS-W3T15. The COOH group content in WNS-W0.5T15 was 12.7%, indicating that the increase of H2O content in the plasma system enhanced the production of COOH groups on the WNS surface. The changes in the COOH groups are consistent with the O element analysis data in Table 3. This confirms that UWM-plasma generates COOH groups on the WNS surface. Based on the results of XPS analyses, the possible pathways for the formation and transformation of COOH groups during the UWM-plasma modification process can be described as follows:
| |
C + O → C![[double bond, length as m-dash]](https://www.rsc.org/images/entities/char_e001.gif) O O
| (8) |
| |
C![[double bond, length as m-dash]](https://www.rsc.org/images/entities/char_e001.gif) O + OH → O O + OH → O![[double bond, length as m-dash]](https://www.rsc.org/images/entities/char_e001.gif) C–OH C–OH
| (10) |
| |
C–OH + O → O![[double bond, length as m-dash]](https://www.rsc.org/images/entities/char_e001.gif) C–OH C–OH
| (11) |
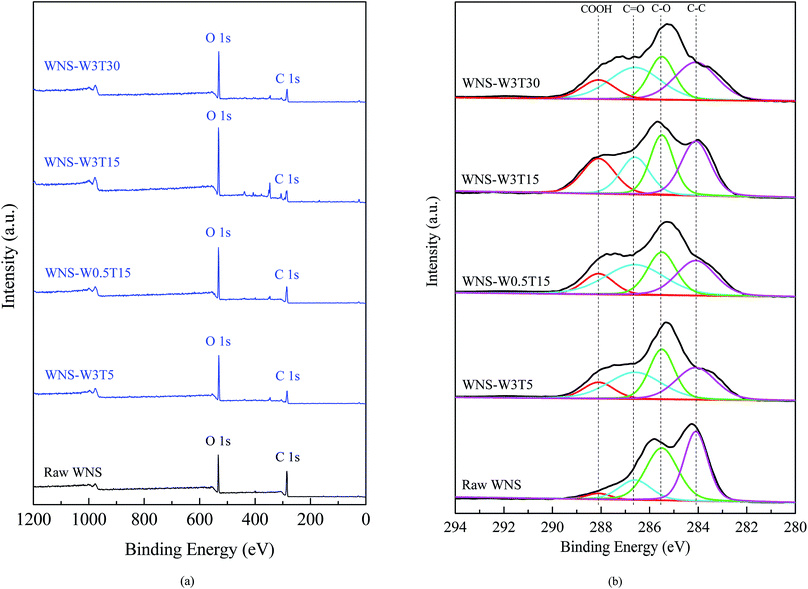 |
| | Fig. 7 XPS spectra of high-resolution scans for raw and UWM-plasma modified WNS: (a) total survey and (b) C1s core level spectra. | |
Table 5 Functional groups of raw and UWM-plasma modified walnut shell from the XPS spectra of C1s
| Functional group |
Electron binding energy (eV) |
Relative intensity (%) |
| WNS |
WNS-W3T5 |
WNS-W0.5T15 |
WNS-W1.5T15 |
WNS-W3T15 |
Used WNS-W3T15 |
WNS-W3T30 |
| C–C |
284.1 |
39.8 |
28.5 |
27.0 |
25.4 |
30.4 |
29.6 |
31.9 |
| C–O |
285.5 |
41.1 |
28.2 |
24.5 |
24.8 |
26.8 |
44.3 |
22.3 |
C![[double bond, length as m-dash]](https://www.rsc.org/images/entities/char_e001.gif) O O |
286.6 |
15.6 |
31.9 |
35.8 |
31.3 |
20.7 |
20.9 |
32.9 |
| COOH |
288.1 |
3.5 |
11.4 |
12.7 |
18.5 |
22.1 |
5.2 |
12.9 |
In the UWM-plasma system, high-energy active electrons collided with H2O molecules to form O and OH active radicals. The C and C–H species on the WNS surface can react with O radicals by forming C![[double bond, length as m-dash]](https://www.rsc.org/images/entities/char_e001.gif) O and C–OH groups. Thereafter, the C
O and C–OH groups. Thereafter, the C![[double bond, length as m-dash]](https://www.rsc.org/images/entities/char_e001.gif) O and C–OH species react with OH and O radicals, respectively, and can be converted into O
O and C–OH species react with OH and O radicals, respectively, and can be converted into O![[double bond, length as m-dash]](https://www.rsc.org/images/entities/char_e001.gif) C–OH groups. Consequently, the content of COOH groups on the WNS surface increased after UWM-plasma modification.
C–OH groups. Consequently, the content of COOH groups on the WNS surface increased after UWM-plasma modification.
To explore the mechanism of Cu(II) adsorption on modified WNS, the XPS spectra of Cu 2p and C1s for fresh WNS-W3T15 and used WNS-W3T15 (after Cu(II) adsorption) were investigated, as shown in Fig. 8a and b, respectively. From Fig. 8a, two new peaks appeared at 932.9 eV and 953.3 eV after Cu(II) adsorption; these are representative of the +2 oxidation state for Cu 2p3/2 and 2p1/2,34 respectively. This indicates that Cu(II) was successfully adsorbed on the modified WNS surface. As shown in Fig. 8b, after the Cu(II) adsorption process, the COOH group intensity in the used WNS-W3T15 decreased to 5.2%. The C–O group intensity in the used WNS-W3T15 increased to 44.3%. This implies that the COOH groups (O![[double bond, length as m-dash]](https://www.rsc.org/images/entities/char_e001.gif) C–OH) changed into C–O groups during the Cu(II) adsorption process. It is known that COOH groups are considered to be the decisive chemisorption sites in the Cu(II) adsorption process.14,18,35 In this study, UWM-plasma modification added new COOH active sites to the WNS surface and then enhanced Cu(II) adsorption by chemisorption, which occurred via ion exchange and/or complexation between positive charged Cu2+ and nonionized or ionized carboxylic groups (COOH). The possible Cu(II) adsorption mechanism for UWM-plasma-modified WNS can be described by the following equations:
C–OH) changed into C–O groups during the Cu(II) adsorption process. It is known that COOH groups are considered to be the decisive chemisorption sites in the Cu(II) adsorption process.14,18,35 In this study, UWM-plasma modification added new COOH active sites to the WNS surface and then enhanced Cu(II) adsorption by chemisorption, which occurred via ion exchange and/or complexation between positive charged Cu2+ and nonionized or ionized carboxylic groups (COOH). The possible Cu(II) adsorption mechanism for UWM-plasma-modified WNS can be described by the following equations:
| |
R–O![[double bond, length as m-dash]](https://www.rsc.org/images/entities/char_e001.gif) C–OH + Cu2+ → R–O C–OH + Cu2+ → R–O![[double bond, length as m-dash]](https://www.rsc.org/images/entities/char_e001.gif) C–OCu+ + H+ C–OCu+ + H+
| (12) |
| |
R–(O![[double bond, length as m-dash]](https://www.rsc.org/images/entities/char_e001.gif) C–OH)2 + Cu2+ → R–(O C–OH)2 + Cu2+ → R–(O![[double bond, length as m-dash]](https://www.rsc.org/images/entities/char_e001.gif) C–O)2Cu + 2H+ C–O)2Cu + 2H+
| (13) |
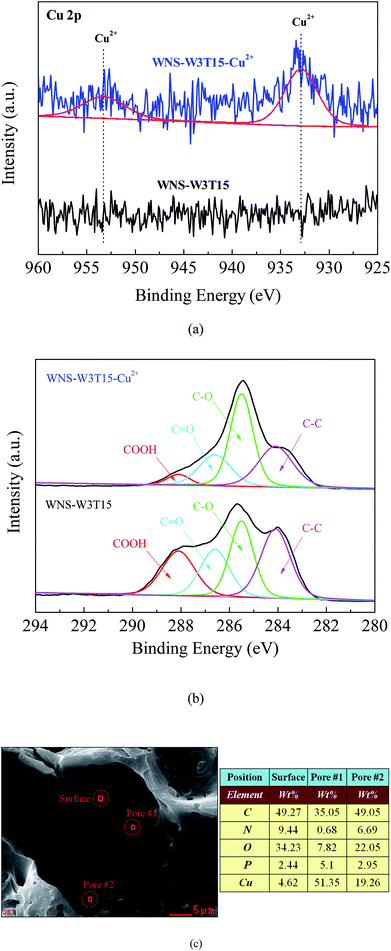 |
| | Fig. 8 (a) XPS spectra of Cu 2p for WNS-W3T15 (before Cu2+ adsorption) and WNS-W3T15-Cu2+ (after Cu2+ adsorption); (b) XPS spectra of C1s for WNS-W3T15 and WNS-W3T15-Cu2+; (c) SEM-EDX image of WNS-W3T15-Cu2+. | |
To better understand the Cu(II) adsorption process on the modified WNS surface, SEM-EDX was used to analyze the distribution of adsorbed Cu(II) on the surface of used WNS-W3T15. As shown in Fig. 8c, the adsorbed Cu(II) content on the external surface section was 4.62%, whereas much more Cu(II) was observed to be adsorbed in the pore section (51.35% Cu in pore #1 and 19.26% Cu in pore #2). This implies that when Cu(II) diffused into the external surface of modified WNS, only a tiny fraction of Cu(II) was adsorbed. Most of the Cu(II) diffused into the pores which were caused by the plasma etching effect and was adsorbed at the activated sites of COOH groups which were produced via the UWM-plasma system.
4. Conclusion
A novel modification method was proposed to improve the content of COOH active sites on the surface of walnut shell using non-thermal plasma in ultrafine water mist for Cu(II) removal. The Cu(II) removal efficiency of raw walnut shell was 33.5%; however, this efficiency increased to 98% after UWM-plasma modification. Specifically, the maximum Cu(II) adsorption capacity of UWM-plasma modified WNS (39.4 mg g−1) was 8 times that of the raw WNS (5.02 mg g−1) and is much higher than that of commercial activated carbon. Water mist was disassociated during plasma modification and O element was added to the WNS surface, which provided the requisite factor to generate activated sites of COOH groups. The relative intensity of the COOH groups was significantly enhanced by UWM-plasma modification, which can accordingly improve the Cu(II) removal performance of WNS.
Conflicts of interest
There are no conflicts to declare.
Acknowledgements
The authors gratefully acknowledge financial support from the International Joint Research and Development Project of Tianjin Talent Introduction and Science & Technology Cooperation Plan (14RCGFGX00850), National Key R&D Program of China (2017YFD0400900), Scientific Research Foundation for Talents, Tianjin University of Science & Technology (10286) and Innovation Fund for College student laboratory of Tianjin University of Science & Technology (1701A301).
References
- M. Li, Q. Liu, L. Guo, Y. Zhang, Z. Lou, Y. Wang and G. Qian, Bioresour. Technol., 2013, 141, 83 CrossRef PubMed.
- A. Ostermann, Y. He, J. Siemens, G. Welp, A. Heuser, F. Wombacher, Q. Xue, X. Lin and W. Amelung, Environ. Sci. Technol., 2015, 49, 4609–4617 CrossRef PubMed.
- B. Singha and S. K. Das, Colloids Surf., B, 2013, 107, 97–106 CrossRef PubMed.
- J. Liu, F. Wang, W. Wu, J. Wan, J. Yang, S. Xiang and Y. Wu, Bioresour. Technol., 2018, 248, 127–134 CrossRef PubMed.
- D. Mohan, A. Sarswat, Y. S. Ok and C. U. Pittman Jr, Bioresour. Technol., 2014, 160, 191–202 CrossRef PubMed.
- X. Gao, L. Wu, Z. Li, Q. Xu, W. Tian and R. Wang, J. Mater. Cycles Waste Manage., 2017, 1–12 Search PubMed.
- Z. Li, X. Gao, L. Wu, K. Wang and N. Kobayashi, J. Porous Mater., 2017, 24, 193–202 CrossRef.
- U. Farooq, J. A. Kozinski, M. A. Khan and M. Athar, Bioresour. Technol., 2010, 101, 5043–5053 CrossRef PubMed.
- F. R. Oliveira, A. K. Patel, D. P. Jaisi, S. Adhikari, H. Lu and S. K. Khanal, Bioresour. Technol., 2017, 246, 110–122 CrossRef PubMed.
- Y. Zhou, X. Liu, Y. Xiang, P. Wang, J. Zhang, F. Zhang, J. Wei, L. Luo, M. Lei and L. Tang, Bioresour. Technol., 2017, 245, 266–273 CrossRef PubMed.
- X. Gao, L. Wu, Q. Xu, W. Tian, Z. Li and N. Kobayashi, Environ. Sci. Pollut. Res. Int., 2018, 1–9 Search PubMed.
- J. H. Zhang, H. Fu, X. S. Lv, J. Tang and X. H. Xu, Biomass Bioenergy, 2011, 35, 464–472 CrossRef.
- M. Imamoglu and O. Tekir, Desalination, 2008, 228, 108–113 CrossRef.
- N. C. Feng, X. Y. Guo and S. Liang, J. Hazard. Mater., 2009, 164, 1286–1292 CrossRef PubMed.
- L. Wu, W. Wan, Z. Shang, X. Gao, N. Kobayashi, G. Luo and Z. Li, Sep. Purif. Technol., 2018, 197, 156–169 CrossRef.
- B. Zhang, P. Xu, Y. Qiu, Q. Yu, J. Ma, H. Wu, G. Luo, M. Xu and H. Yao, Chem. Eng. J., 2015, 263, 1–8 CrossRef.
- C. Chen, A. Ogino, X. Wang and M. Nagatsu, Diamond Relat. Mater., 2011, 20, 153–156 CrossRef.
- S. Biniak, M. Pakula, G. S. Szymanski and A. Swiatkowski, Langmuir, 1999, 15, 6117–6122 CrossRef.
- M. Vesali-Naseh, A. A. Khodadadi, Y. Mortazavi, A. A. Moosavi-Movahedi and K. Ostrikov, RSC Adv., 2016, 6, 31807–31815 RSC.
- L. Pranevicius, S. Tuckute, K. Gedvilas and D. Milcius, Thin Solid Films, 2012, 524, 133–136 CrossRef.
- Y. Du, G. Nayak, G. Oinuma, Z. Peng and P. J. Bruggeman, J. Phys. D: Appl. Phys., 2017, 50, 145–201 Search PubMed.
- F. N. Acar and Z. Eren, J. Hazard. Mater., 2006, 137, 909–914 CrossRef PubMed.
- R. Baccar, J. Bouzid, M. Feki and A. Montiel, J. Hazard. Mater., 2009, 162, 1522 CrossRef PubMed.
- L. Wu, Z. Shang, H. Wang, W. Wan, X. Gao, Z. Li and N. Kobayashi, J. Mater. Cycles Waste Manage., 2018, 1–13 CrossRef PubMed.
- M. M. Rao, D. K. Ramana, K. Seshaiah, M. C. Wang and S. W. Chien, J. Hazard. Mater., 2009, 166, 1006–1013 CrossRef PubMed.
- M. Kobya, E. Demirbas, E. Senturk and M. Ince, Bioresour. Technol., 2005, 96, 1518–1521 CrossRef PubMed.
- J. P. Chen and S. Wu, J. Colloid Interface Sci., 2004, 280, 334–342 CrossRef PubMed.
- A. M. Puziy, O. I. Poddubnaya, R. P. Socha, J. Gurgul and M. Wisniewski, Carbon, 2008, 46, 2113–2123 CrossRef.
- C.-M. Chan, T.-M. Ko and H. Hiraoka, Surf. Sci. Rep., 1996, 24, 1–54 CrossRef.
- S. Tang, N. Lu, J. K. Wang, S. K. Ryu and H. S. Choi, J. Phys. Chem. C, 2007, 111, 1820–1829 CrossRef.
- K. S. Tong, M. J. Kassim and A. Azraa, Chem. Eng. J., 2011, 170, 145–153 CrossRef.
- N. Médard, A. Jeanclaude Soutif and F. Poncinepaillard, Langmuir, 2002, 18, 2246–2253 CrossRef.
- Q. Niu, J. Luo, Y. Xia, S. Sun and Q. Chen, Fuel Process. Technol., 2017, 156, 310–316 CrossRef.
- M. V. Lombardo, M. Videla, A. Calvo, F. G. Requejo and G. J. A. A. Soler-Illia, J. Hazard. Mater., 2012, 223, 53–62 CrossRef PubMed.
- L. Monser and N. Adhoum, Sep. Purif. Technol., 2002, 26, 137–146 CrossRef.
|
| This journal is © The Royal Society of Chemistry 2018 |
Click here to see how this site uses Cookies. View our privacy policy here.  Open Access Article
 *ab
*ab


![[thin space (1/6-em)]](https://www.rsc.org/images/entities/char_2009.gif) qe − k1t
qe − k1t


![[double bond, length as m-dash]](https://www.rsc.org/images/entities/char_e001.gif) O groups and COOH groups, respectively. The electron binding energies and relative intensities (calculated from the corresponding area of the small peak divided by the total area) of each peak are summarized in Table 5. It can be seen that the COOH group intensity of raw WNS was 3.5%. After UWM-plasma modification, the COOH group intensities of modified WNS were greatly increased. With increasing modification time from 5 to 15 min, the COOH group intensity of modified WNS increased from 11.4% (WNS-W3T5) to 22.1% (WNS-W3T15). A further increase in modification time resulted in a decrease in COOH group content. It can be seen that the COOH group intensity of WNS-W3T30 was 12.9%, which was less than that of WNS-W3T15. The COOH group content in WNS-W0.5T15 was 12.7%, indicating that the increase of H2O content in the plasma system enhanced the production of COOH groups on the WNS surface. The changes in the COOH groups are consistent with the O element analysis data in Table 3. This confirms that UWM-plasma generates COOH groups on the WNS surface. Based on the results of XPS analyses, the possible pathways for the formation and transformation of COOH groups during the UWM-plasma modification process can be described as follows:
O groups and COOH groups, respectively. The electron binding energies and relative intensities (calculated from the corresponding area of the small peak divided by the total area) of each peak are summarized in Table 5. It can be seen that the COOH group intensity of raw WNS was 3.5%. After UWM-plasma modification, the COOH group intensities of modified WNS were greatly increased. With increasing modification time from 5 to 15 min, the COOH group intensity of modified WNS increased from 11.4% (WNS-W3T5) to 22.1% (WNS-W3T15). A further increase in modification time resulted in a decrease in COOH group content. It can be seen that the COOH group intensity of WNS-W3T30 was 12.9%, which was less than that of WNS-W3T15. The COOH group content in WNS-W0.5T15 was 12.7%, indicating that the increase of H2O content in the plasma system enhanced the production of COOH groups on the WNS surface. The changes in the COOH groups are consistent with the O element analysis data in Table 3. This confirms that UWM-plasma generates COOH groups on the WNS surface. Based on the results of XPS analyses, the possible pathways for the formation and transformation of COOH groups during the UWM-plasma modification process can be described as follows:![[double bond, length as m-dash]](https://www.rsc.org/images/entities/char_e001.gif) O
O
![[double bond, length as m-dash]](https://www.rsc.org/images/entities/char_e001.gif) O + OH → O
O + OH → O![[double bond, length as m-dash]](https://www.rsc.org/images/entities/char_e001.gif) C–OH
C–OH
![[double bond, length as m-dash]](https://www.rsc.org/images/entities/char_e001.gif) C–OH
C–OH

![[double bond, length as m-dash]](https://www.rsc.org/images/entities/char_e001.gif) O
O![[double bond, length as m-dash]](https://www.rsc.org/images/entities/char_e001.gif) O and C–OH groups. Thereafter, the C
O and C–OH groups. Thereafter, the C![[double bond, length as m-dash]](https://www.rsc.org/images/entities/char_e001.gif) O and C–OH species react with OH and O radicals, respectively, and can be converted into O
O and C–OH species react with OH and O radicals, respectively, and can be converted into O![[double bond, length as m-dash]](https://www.rsc.org/images/entities/char_e001.gif) C–OH groups. Consequently, the content of COOH groups on the WNS surface increased after UWM-plasma modification.
C–OH groups. Consequently, the content of COOH groups on the WNS surface increased after UWM-plasma modification.![[double bond, length as m-dash]](https://www.rsc.org/images/entities/char_e001.gif) C–OH) changed into C–O groups during the Cu(II) adsorption process. It is known that COOH groups are considered to be the decisive chemisorption sites in the Cu(II) adsorption process.14,18,35 In this study, UWM-plasma modification added new COOH active sites to the WNS surface and then enhanced Cu(II) adsorption by chemisorption, which occurred via ion exchange and/or complexation between positive charged Cu2+ and nonionized or ionized carboxylic groups (COOH). The possible Cu(II) adsorption mechanism for UWM-plasma-modified WNS can be described by the following equations:
C–OH) changed into C–O groups during the Cu(II) adsorption process. It is known that COOH groups are considered to be the decisive chemisorption sites in the Cu(II) adsorption process.14,18,35 In this study, UWM-plasma modification added new COOH active sites to the WNS surface and then enhanced Cu(II) adsorption by chemisorption, which occurred via ion exchange and/or complexation between positive charged Cu2+ and nonionized or ionized carboxylic groups (COOH). The possible Cu(II) adsorption mechanism for UWM-plasma-modified WNS can be described by the following equations:![[double bond, length as m-dash]](https://www.rsc.org/images/entities/char_e001.gif) C–OH + Cu2+ → R–O
C–OH + Cu2+ → R–O![[double bond, length as m-dash]](https://www.rsc.org/images/entities/char_e001.gif) C–OCu+ + H+
C–OCu+ + H+
![[double bond, length as m-dash]](https://www.rsc.org/images/entities/char_e001.gif) C–OH)2 + Cu2+ → R–(O
C–OH)2 + Cu2+ → R–(O![[double bond, length as m-dash]](https://www.rsc.org/images/entities/char_e001.gif) C–O)2Cu + 2H+
C–O)2Cu + 2H+


