 Open Access Article
Grain boundary plane distribution and its potential correlation with magnetic properties in hexagonal RCo5 permanent magnets
Xiaokun Yuan *,
Dongtao Zhang and
Yuan Ji
College of Materials Science and Engineering, Beijing University of Technology, Beijing, 100124, China. E-mail: yuanxiaokun@bjut.edu.cn; Fax: +86 10 67396260; Tel: +86 10 67396260
First published on 19th June 2018
Abstract
Grain boundary plane distributions (GBPDs) are demonstrated to be spatially inhomogeneous in RCo5 permanent magnets. The potential effect of GBPDs on magnetic properties is proposed from major performance considerations, and approaches to exactly differentiate the boundary population are introduced. The crystallographic texture in permanent magnets should cover not only the texture of the crystals, but also the texture between crystals, which is helpful to advance the present understanding of the relationship between textures and properties in permanent magnets.
1 Introduction
Since the discovery of SmCo5 in 1967,1 RCo5 permanent magnets (where R refers to the rare earth elements) have made significant contributions to the development and application of devices in the fields of electronics, automation, medicine and energy. To optimize permanent magnets for advanced applications, large remanence (Br) and coercivity (Hc), as well as the energy product (BH), are primarily focused on.2 Accordingly, the kernel statistical issue is the magnetocrystalline anisotropy (which can be characterized via two approaches: the orientation texture of the crystals, and the crystal alignment with reference to the magnetically easy axis. For RCo5 crystals, the easy axis is the c-axis). Besides the crystal interior, another indispensable structural constituent is the boundary plane (with the key index for the configuration feature, for example, the misorientation across the boundary plane). However, boundary plane is of less concern. Therefore, the major motivation for this work is to provide a better description and increased understanding about the potential effect of grain boundary plane distribution (GBPD) on magnetic properties. Recently, we have reported the orientation texture of boundary planes in hexagonal RCo5 permanent magnets (with relatively weak orientation texture of crystals),3–6 and we now report new computational developments in this inter-disciplinary work.2 Materials and methods
To maintain the link to the major motivation of the current work, various specimens were selected under specific situations, and their dissimilarities in chemical composition, preparation method and crystal size were of less concern. Accordingly, four samples were used in this work. Sample 1 and sample 2 are commercial samples, both with a nominal BH value around 24MGOe. Sample 1 only has an SmCo5 phase and was used for principal analysis. Sample 2 contained both SmCo5 and Sm2Co7 phases and was used as a phase boundary case. Sample 3 and sample 4 were prepared at BJUT; they are PrCo5 specimens with different height reduction rates during the hot deformation step (70% for sample 3 and 90% for sample 4), and were used to illustrate the correlation between GBPD and the magnetic properties. The hysteresis loops were measured using a Quantum Design VersaLab vibrating sample magnetometer.The samples were treated using a metallographic polishing procedure. Then, electron backscatter diffraction (EBSD) data were collected using an EDAX Hikari high-speed detector incorporated in a FEI Quanta 250 scanning electron microscope, with a step size of 0.5 micron to ensure the accuracy of the subsequent analysis. The data then underwent a clean-up treatment to correct spurious points due to incorrect indexing and to reliably assign orientations for small crystals. Afterwards, line segments associated with the crystal orientations were extracted according to the misorientation across the boundary planes.
From the datasets of line segments, misorientation statistics were performed using stereological programs developed at Carnegie Mellon University. The methodology, namely the “five parameter analysis” (FPA) method, already reported for hexagonal symmetries,7–12 gives clear information on the distribution features of boundary planes in a polycrystalline structure. The method cannot characterize detailed crystallographic indices on a specific boundary, but can present statistical information about GBPDs. When misorientation, Δg, and boundary plane normal, n, are considered, λ(Δg, n) represents the relative area of boundary planes with a specific misorientation. When the misorientation is averaged, λ(n) represents the relative area of the habit planes. For hexagonal symmetry, the FPA method requires at least 2 × 10⁵ line segments for a λ(Δg, n) analysis and 5 × 10³ line segments for a λ(n) analysis.
Here, we should note that the FPA method is more applicable to polycrystalline structures within which crystals are randomly oriented, however, the orientation texture of crystals is quite strong in most permanent magnets (for example, sample 1 and sample 2 in this work). Therefore, when the FPA method is applied to permanent magnets, the exact GBPD outcome might be biased by the strong orientation texture of the crystals. As to the two rectification methods, measuring GBPD from three perpendicular directions (one of which should be the easy axis) seems not to work. This is because the strong orientation texture of crystals along the easy axis remains intact from different observing directions. Accordingly, measuring the GBPD from consecutive planar sections, or the so-called three-dimensional EBSD technique, becomes the only alternative, however, it is beyond the scope and capability of the current work. As a whole, based on the observation on a single planar section, the current work can still be regarded as a beneficial exploration since it is an important step to completely describe the orientation texture in permanent magnets.
3 Results and discussion
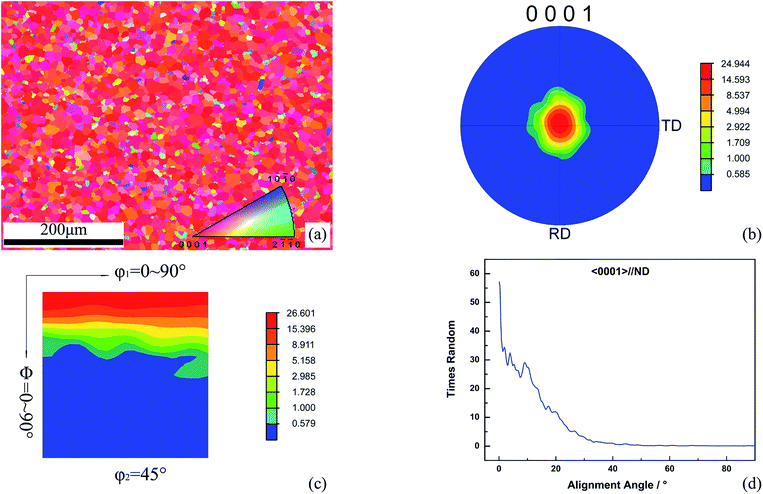
Before describing the GBPD in sample 1, the orientation texture of the crystals is briefly investigated, and the outcomes are illustrated in Fig. 1. The crystal orientation map of a selected region in sample 1 is shown in Fig. 1a. The axial [0001] texture of SmCo5 crystals can be indicated through orientation texture intensity approaches, see either the {0001} pole figure shown in Fig. 1b or the orientation distribution function (ODF) shown in Fig. 1c; both figures show the texture intensity in units of multiples of a random distribution (MRD). From a statistical point of view, sample 1 contains 5736 crystals after the clean-up procedure and has therefore reduced the noise in the pole figure and ODF sections. Additionally, the given resolution during the EBSD measurement (as well as the clean-up procedure) has shifted the plots with reasonable smoothness. These treatments can guarantee the measurement of the orientation texture of the crystals. If we ignore the orientation texture intensity and study the volume fraction of {0001} crystal directions that are parallel to, or lie within a certain number of degrees of, the sample normal, then such an approach integrates the portion of a distribution around a location of interest and therefore this approach is an alternative to characterize the orientation texture of SmCo5 crystals; see the alignment of 〈0001〉 crystal directions with the sample normal in Fig. 1d. No matter which method is used, they both deal with most of the statistical issues around magnetocrystalline anisotropy at the current stage.For the RCo5 structure, the magnetocrystalline anisotropy comes from the rare earth component, to a large extent.13 It can be explained as the stability of the magnetization direction with respect to the crystal axes, and such stability has a potential effect on the performance of permanent magnets. If the material is under hot deformation conditions, the direction of the external magnetic field with respect to the pressing direction (usually parallel to the sample normal) is relevant to the crystal orientation bias. Here, the remanence is a strongly dependent attribute of the crystallographic texture,14 and the maximum bulk crystallographic alignment of constituent crystals with predominant c-axis orientation texture is important in order to obtain the highest remanence and energy product. Additionally, the resistance to demagnetization becomes weak after the alignment of crystals is improved, and then, the coercivity of the bulk magnet decreases.15 Moreover, from the view of magnetic domains, in a field that is applied parallel to the texture axis, the dominant magnetization processes are the nucleation of reverse domains and the propagation of easily moveable domain walls,16 and these processes are significant in determining the magnetic response. These interpretations, although mostly proposed for the better-studied R–Fe–B alloys, reveal the necessity to connect microstructure and properties of RCo5 permanent magnets (by using the axial texture of RCo5 crystals as the internal relationship), and the quantitative evaluation of such a relationship should include plotting the magnetic properties of interest, for example, size and squareness of the hysteresis loop, against the corresponding texture volume fraction.
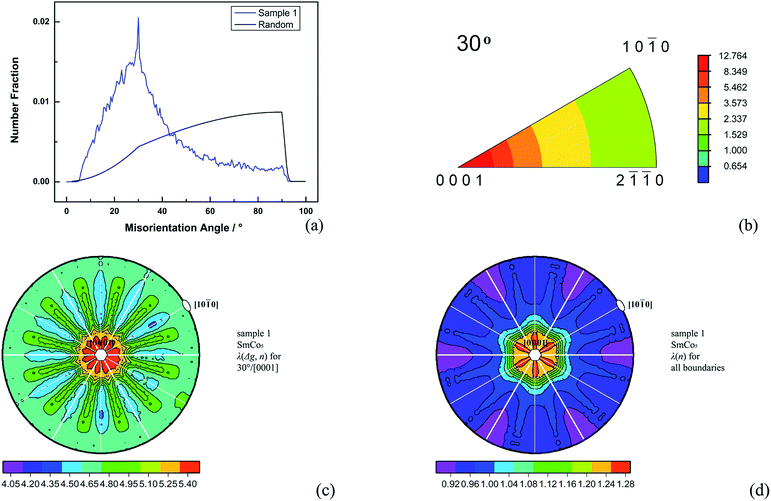
From the individual orientations of crystals, the orientation texture of the crystals has been determined. It is therefore possible to further calculate the orientation difference or misorientation between neighboring crystals and hence provide information about the texture between crystals,17 namely the orientation texture of boundary planes, or in other words, the GBPD. The measurement of boundary features in magnets has been an appealing area of study for a long time (for example, misorientation distribution has been investigated in ref. 18); whilst both theoretical and experimental works have increasingly demonstrated the necessity to connect boundary features and magnetic properties. The starting point of GBPDs should be misorientation across boundary planes. This is because misorientation is an efficient indicator of the magnetocrystalline environment in polycrystalline structures.18 In these structures, if the boundaries are in a more magnetically disordered state, the higher energy at the boundary locations, on a statistic level, could affect the global properties of the bulk magnet as a consequence.19 Referring to the technical route reported in ref. 10, the GBPD measurement results for sample 1 are shown in Fig. 2. Firstly, the misorientation angle distribution between SmCo5/SmCo5 crystals is shown in Fig. 2a, and only one angular parameter is included in this situation. Compared with the MacKenzie random object,20 the experimental misorientation values clearly deviate from the random distribution, and a preference for a 30° misorientation angle is clearly observed. Secondly, the axis/angle misorientation distribution function, namely the axis/angle MDF, which determines the preferred disorientation between SmCo5/SmCo5 crystals, is shown in Fig. 2b. Three angular parameters in the axis/angle MDF (with its equivalent form, the Rodrigues–Frank space, not shown here) are used to describe the GBPD in the axis-angle space; one parameter representing the misorientation angle and the other two the misorientation axes. Accordingly, the preference for [0001] as the misorientation axis can be observed after the preference for a 30° misorientation angle has been specified, that is, 30°/[0001] is the dominant disorientation in sample 1. Thirdly, after the misorientation is chosen, the complete GBPD for that misorientation can be plotted into crystallographic space via a stereographic projection. Note that in the case of FPA, five angular parameters are used to describe the GBPD, with three representing misorientation, Δg, and two representing the boundary plane normal, n. From the combined data of sample 1, λ(Δg, n) for 30°/[0001] is shown in Fig. 2c, in which the distribution peak of the misorientation is at the position of the [0001] misorientation axis, meaning that the boundary plane of the misorientation is perpendicular to the common misorientation axis, that is to say, the 30°/[0001] misorientation has a pure twist configuration. Alternatively, for hexagonal symmetries, one major misorientation relationship is 27.796°/[0001], or the Σ13a coincidence site lattice (CSL) boundary, which usually has a twist configuration. In the current work, interestingly, Σ13a is not prevalent in sample 1. Similarly, λ(n) is shown in Fig. 2d, from which the predominant occurring frequency of the {0001} habit planes can be observed. As a result, the orientation texture of the boundary planes in sample 1 show the [0001] axial feature, which is similar to the orientation texture of crystals with regards to the [0001] easy axis.
Previous studies usually suggest the orientation texture of boundary planes through measuring misorientation angles between crystals.19,21,22 For a structure that contains slightly misoriented adjacent crystals, with the complete GBPD descriptions in the current work, it is possible to comprehensively describe the crystallographic texture, not only the texture of the crystals, but also the texture between crystals. Therefore, to advance the present understanding of the relationship between crystallographic texture and magnetic properties, one should consider that the key geometric features for magnetic properties can be effectively reflected by the GBPD. Boundary locations can be regarded as structural defects in magnetic structures, compared to crystal interiors. Hence, (i) from the remanence consideration, the remanence might decrease with a reduction in the exchange constants near the boundaries.23 At the same time, parallel alignment of the magnetic moment in the vicinity of the boundaries is necessary to favor an enhancement of remanence,24 and this inference is supported by more recent reports that for some cubic symmetries, CSL boundaries with specific misorientations have larger moments than those in the crystal interior.25,26 Although the exact mechanism needs to be further clarified, misorientation on a statistical level is of great value towards identifying the alteration of remanence at boundary locations. (ii) From the coercivity consideration, according to the Brandon criterion,27 dislocations exist on the vicinal crystal lattice interfaces of boundaries with specific misorientations, and such lattice defects would have low energy because of the good atomic fit. Therefore, the variation of coercivity at boundary locations can, at least qualitatively, be explained by combination of those misorientation attributes. Possible routes may include magnetic hardening occurring in the epitaxial layer of crystals that are close to the boundary,28 enhancement of the pinning strength at the boundary locations during domain wall motion29 and facilitation of magnetic reversal with lattice defects at boundary locations.2 (iii) From the magnetic domain consideration, boundary locations could act as the pinning sites for domain wall motion and such a barrier effect could be responsible for the enhancement in coercivity.2,13,29–31 Additionally, boundary locations, as weak regions of the magnetocrystalline anisotropy field,15 could be the starting point for nucleation of reverse domains.24,29,32 The demonstration of inhomogeneous misorientation, as well as its implications on the lattice symmetric features, could thus present information about specific mechanisms for domain movement at boundary locations. (iv) From the energy consideration, there are two kinds of energies of interest. One of the energies of interest is the boundary energy, and recent observations have suggested that the boundary energies and the corresponding boundary areas are inversely correlated.33,34 Accordingly, λ(Δg, n) can be used as a proxy for the grain boundary energy distribution (GBED)10,33,34 on a statistical level. The other energy of interest is the surface energy of the crystallographic planes, which is significant in determining the boundary energy35 and misorientation36 if two crystals with different orientations are brought into contact, and λ(n) can thus provide key information about the energy stability state if the energy anisotropy of the habit planes is integrated.
With the above considerations, it can be recognized that the orientation texture in permanent magnets comes from not only the crystal interiors, but also boundary locations, and statistically significant results should be unambiguously obtained to present a more direct connection between GBPD and magnetic properties. Here, the connection might tentatively be called “grain boundary magnetism distribution” (GBMD) because it takes the orientation texture between crystals into account. The misorientation in RCo5 permanent magnets has been proven to be inhomogeneous,3–6 and the authors hereby further propose the principle of “concrete analysis to concrete boundary planes” during GBPD studies. Some important examples are as follows:
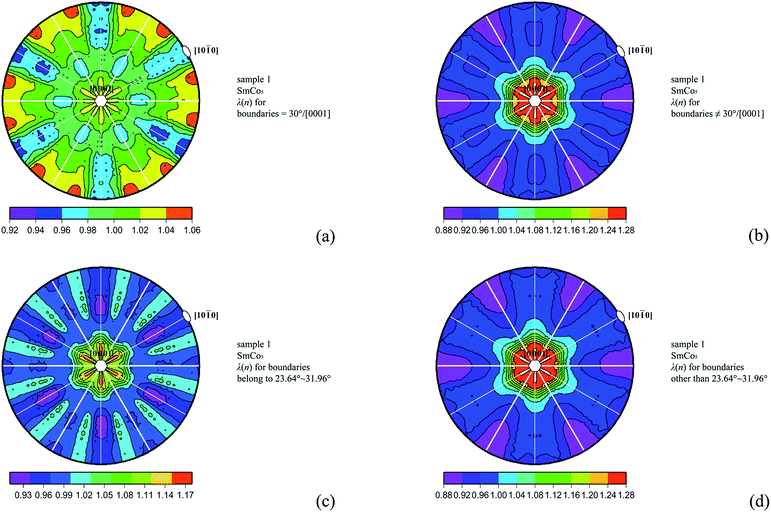
All of the boundaries can be sorted according to specific misorientation across the boundary plane. As an example, for sample 1, λ(n) for boundaries with and without the 30°/[0001] misorientation are shown in Fig. 3a and b, respectively. It can be observed that boundaries with the 30°/[0001] misorientation favor the habit planes parallel to the easy axis, and boundaries without the 30°/[0001] misorientation favor the habit planes perpendicular to the easy axis. All of the boundaries can also be sorted according to whether a boundary is within a certain misorientation range. As an example, for sample 1, we choose the tolerance of the Σ13a boundary, with 23.64° to 31.96°36 as the misorientation range. λ(n) of boundaries within and not within that tolerance are shown in Fig. 3c and d, respectively. Here, the two boundary partitions both favor the habit planes perpendicular to the easy axis, and merely display different relative areas (see the MRD bars below the pole plots). Additionally, the similar contour shapes in Fig. 3b and d indicate that the random boundaries favor the {0001} orientation. These differentiation methods can help to explain the deviation of the prevalent misorientation from the ideal position within the tolerance if lattice defects and low energies at boundary locations, on a statistical level, are taken into account.
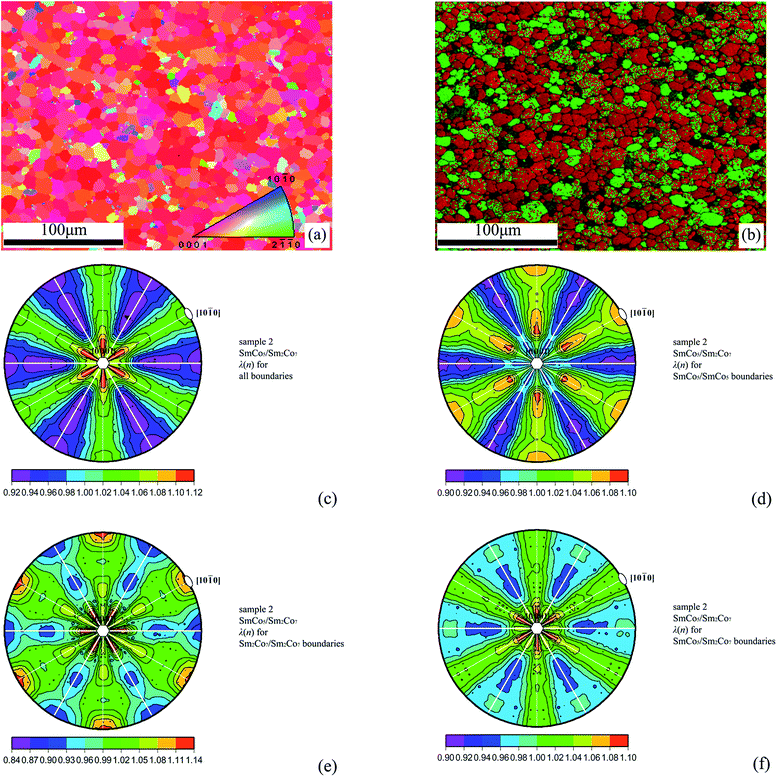
Permanent magnets usually contain various phases, and all of the boundaries can therefore be sorted according to chemical composition. As an example, sample 2 contains SmCo5 and Sm2Co7 hexagonal phases with different c/a ratios, and all of the boundaries can then be filtered into SmCo5/SmCo5 grain boundaries, Sm2Co7/Sm2Co7 grain boundaries and SmCo5/Sm2Co7 phase boundaries. For sample 2, the crystal orientation map is shown in Fig. 4a and the spatial phase distribution is shown in Fig. 4b. λ(n) plots of the boundary sections after the previously mentioned phase filters have been applied are shown in Fig. 4c–f. When all of the boundaries are considered, they favor the habit planes perpendicular to the easy axis (see Fig. 4c). The SmCo5/SmCo5 grain boundaries mostly favor the {4 0 −4 5} planes with their normal deviated by about 19.3° from the easy axis (see Fig. 4d). The Sm2Co7/Sm2Co7 grain boundaries mostly favor the habit planes parallel or perpendicular to the easy axis, and the two portions have the same relative area (see Fig. 4e). The SmCo5/Sm2Co7 phase boundaries only favor the habit planes perpendicular to the easy axis, and their relative areas are slightly less than in the case of all the boundaries (see Fig. 4f). The significance of such differentiation is to quantitatively measure the contribution weights of different phases to the GBMD. Moreover, it is also suitable to study the R-rich/R2Fe14B phase boundaries in R–Fe–B permanent magnets if misorientation information can be obtained via ultra-high resolution.37,38
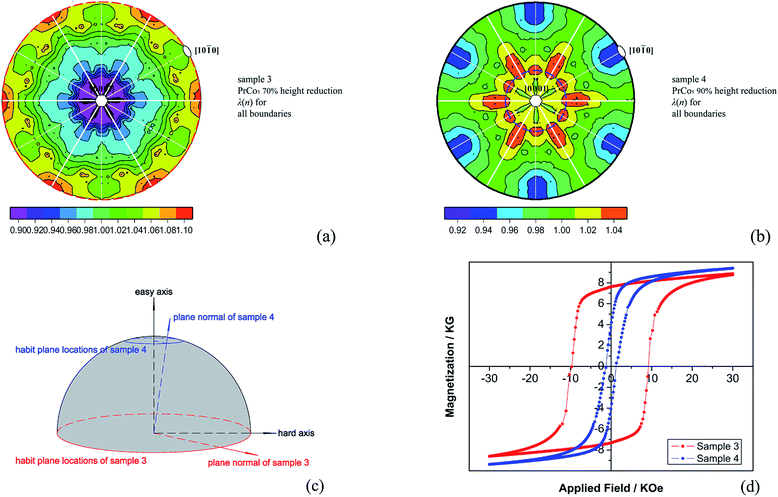
The GBPD can also be used in real production to optimize crystallographic textures and in-turn to obtain optimum properties. As an example, for sample 3 and sample 4 (PrCo5 specimens with different height reductions), λ(n) plots for all of the boundaries are shown in Fig. 5a and b, respectively. The locations of the most frequent habit planes for each sample are marked by dashed circles of different colors. The two dashed circles are then displayed in crystallographic space in Fig. 5c. It can be seen that the height reduction has clearly affected the GBPD: for sample 3 with a 70% height reduction, the most common habit planes are parallel to the easy axis; for sample 4 with a 90% height reduction, the normal of the most common habit plane deviates by about 17.6° from the easy axis. By comparing the hysteresis loops of the two samples shown in Fig. 5d, it can be seen that the orientation bias of the habit planes and magnetic anisotropy39 have been developed under various height reductions, and that the preferred orientation of habit planes might be the result of trying to minimize the surface energy as a whole.40 Here, it should be addressed that in the hot deformation case, the optimum properties of PrCo5 magnets can be achieved only when the height reduction is higher than 90%. In this work, the height reduction is 70% for sample 3 and 90% for sample 4. The main reason for doing this was to give a more obvious difference in Fig. 5c, in other words, to show that the type and occurrence frequencies of habit planes are quite different under distinct height reductions. Undoubtedly, when the height reduction is further refined, similar pole plots (like Fig. 5c) are helpful to accurately determine the discrepancies between GBPDs. Moreover, when checking the relationship between GBPDs and magnetic properties in full, it would be an illustrative way to plot the coercivity vs. the angle of the habit plane normal from the easy axis, and such a plot should be effective when refining the magnetic properties under various magnet preparation methods.
4 Conclusions
The conclusions of this study are: textural qualities and quantities in hexagonal RCo5 permanent magnets should cover not only the orientation texture of crystals, but also the orientation texture of boundary planes. Moreover, explicating the anisotropy properties at boundary locations through accurately differentiating the boundary population is important in order to obtain a complete explanation regarding the structure-property relationship in permanent magnets. Measuring GBPDs from consecutive planar sections would provide further specifications in addition to the current work which is based on the observation on a single planar section.Conflicts of interest
There are no conflicts to declare.Acknowledgements
Xiaokun Yuan acknowledges support from the National Natural Science Foundation of China 51471007. Xiaokun Yuan also thanks Prof. Gregory S. Rohrer from Carnegie Mellon University for giving significant insights into this work, and appreciates the kind help from Prof. Jie Zhu and Dr Xiaoqian Bao (University Of Science and Technology Beijing), Dr Yuntao Lei (Gatan, Inc.), Dr Jennifer Anand Sundararajan (Intel Corporation) and Dr Hongmei Xu (who provided language help).Notes and references
- K. Strnat, G. Hoffer, J. Olson, W. Ostertag and J. J. Becker, J. Appl. Phys., 1967, 38, 1001 CrossRef.
- L. H. Lewis and F. J. Villacorta, Metall. Mater. Trans. A, 2013, 44, 2 CrossRef.
- X. K. Yuan, M. Yue, D. T. Zhang, T. N. Jin, Z. R. Zhang, J. H. Zuo, J. X. Zhang, J. Zhu and X. X. Gao, CrystEngComm, 2014, 16, 1669 RSC.
- X. K. Yuan, D. T. Zhang, S. L. Zhou, M. Yue, J. X. Zhang, J. Zhu, Q. Ma and Z. Wang, CrystEngComm, 2015, 17, 4210 RSC.
- D. T. Zhang, X. K. Yuan, M. Yue, Q. Ma, J. Zhu and J. X. Zhang, RSC Adv., 2015, 5, 90976 RSC.
- D. T. Zhang, X. K. Yuan, M. Yue, D. Zhou, J. Zhu and X. X. Gao, CrystEngComm, 2016, 18, 2632 RSC.
- D. M. Saylor, B. S. E. Dasher, B. L. Adams and G. S. Rohrer, Metall. Mater. Trans. A, 2004, 35, 1981 CrossRef.
- V. Randle, G. S. Rohrer and Y. Hu, Scr. Mater., 2008, 58, 183 CrossRef.
- C. S. Kim, T. R. Massa and G. S. Rohrer, J. Am. Ceram. Soc., 2008, 91, 996 CrossRef.
- G. S. Rohrer, J. Am. Ceram. Soc., 2011, 94, 633 CrossRef.
- S. A Bojarski, M. Stuer, Z. Zhao, P. Bowen and G. S. Rohrer, J. Am. Ceram. Soc., 2014, 97, 622 CrossRef.
- M. N. Kelly, K. Glowinski, N. T. Nuhfer and G. S. Rohrer, Acta Mater., 2016, 111, 22 CrossRef.
- R. Skomski and D. J. Sellmyer, J. Rare Earths, 2009, 27, 675 CrossRef.
- T. Kawai, B. M. Ma, S. G. Sankar and W. E. Wallace, J. Appl. Phys., 1990, 67, 4610 CrossRef.
- Y. Matsuura, J. Hoshijima and R. Ishii, J. Magn. Magn. Mater., 2013, 336, 88 CrossRef.
- K. Khlopkov, O. Gutfleisch, D. Eckert, D. Hinz, B. Wall, W. Rodewald, K. H. Müller and L. Schultz, J. Alloys Compd., 2004, 365, 259 CrossRef.
- O. Engler and V. Randle, Introduction to texture analysis: macrotexture, microtexture, and orientation mapping, CRC press, 2009 Search PubMed.
- H. J. Bunge, Texture, Stress, Microstruct., 1989, 11, 75 CrossRef.
- T. Watanabe, Y. Suzuki, S. Tanii and H. Oikawa, Philos. Mag. Lett., 1990, 62, 9 CrossRef.
- J. K. Mackenzie, Biometrika, 1958, 45, 229 CrossRef.
- A. Goyal, E. D. Specht, D. M. Kroeger and T. A. Mason, Appl. Phys. Lett., 1996, 68, 711 CrossRef.
- T. G. Woodcock and O. Gutfleisch, Acta Mater., 2011, 59, 1026 CrossRef.
- R. Fischer and H. Kronmüller, J. Appl. Phys., 1998, 83, 3271 CrossRef.
- O. Gutfleisch, J. Phys. D: Appl. Phys., 2000, 33, 157 CrossRef.
- K. Hampel, D. D. Vvedensky and S. Crampin, Phys. Rev. B, 1993, 47, 4810 CrossRef.
- S. Ii, K. Hirayama, K. Matsunaga, H. Fujii and S. Tsurekawa, Scr. Mater., 2013, 68, 253 CrossRef.
- D. G. Brandon, Acta Metall., 1966, 14, 1479 CrossRef.
- R. F. Sabiryanov and S. S. Jaswal, Phys. Rev. B, 1998, 58, 12071 CrossRef.
- H. S. Amin, T. Ohkubo, T. Shima and K. Hono, Acta Mater., 2012, 60, 819 CrossRef.
- R. W. Gao, D. H. Zhang, H. Li, S. T. Jiang, S. Z. Zhou, F. B. Li and L. D. Zhang, J. Appl. Phys., 1995, 78, 1156 CrossRef.
- H. J. Li, M. Yue, Y. Q. Li, Q. Wu, W. Q. Liu, D. T. Zhang and Q. M. Lu, AIP Adv., 2017, 7, 056231 CrossRef.
- G. Hrkac, T. G. Woodcock, K. T. Butler, L. Saharan, M. T. Bryan, T. Schrefl and O. Gutfleisch, Scr. Mater., 2014, 70, 35 CrossRef.
- G. S. Rohrer, J. Mater. Sci., 2011, 46, 5881 CrossRef.
- H. Beladi and G. S. Rohrer, Metall. Mater. Trans. A, 2013, 44, 115 CrossRef.
- T. G. Woodcock, Y. P. Zhang, G. Hrkac, G. Ciuta, N. M. Dempsey, T. Schrefl, O. Gutfleisch and D. Givord, Scr. Mater., 2012, 67, 536 CrossRef.
- H. S. Ryoo, S. K. Hwang, M. H. Kim, S. I. Kwun and S. W. Chae, Scr. Mater., 2001, 44, 2583 CrossRef.
- R. van Bremen, D. R. Gomes, L. T. H. de Jeer, V. Ocelík and J. T. M. de Hosson, Ultramicroscopy, 2016, 160, 256 CrossRef PubMed.
- D. Gordan, Microsc. Microanal., 2017, 23 Search PubMed , cover story.
- M. Yue, J. H. Zuo, W. Q. Liu, W. C. Lv, D. T. Zhang, J. X. Zhang, Z. H. Guo and W. Li, J. Appl. Phys., 2011, 109, 07A711 CrossRef.
- K. Makita and O. Yamashita, Appl. Phys. Lett., 1999, 74, 2056 CrossRef.
| This journal is © The Royal Society of Chemistry 2018 |

