 Open Access Article
Creative Commons Attribution 3.0 Unported Licence
Production of ethylene glycol from direct catalytic conversion of cellulose over a binary catalyst of metal-loaded modified SBA-15 and phosphotungstic acid
Shitao Yua,
Xincheng Cao a,
Shiwei Liu*a,
Lu Lia and
Qiong Wuab
aCollege of Chemical Engineering, Qingdao University of Science and Technology, Qingdao 266042, China. E-mail: liushiweiqust@126.com; Fax: +86 532 84022719; Tel: +86 532 84022719
bDepartment of Chemical & Biomolecular Engineering, University of Tennessee Knoxville, 419 Dougherty Engineering Bldg., Knoxville, Tennessee 37996, USA
First published on 10th July 2018
Abstract
This study presents the utilization of a binary catalyst composed of metal-loaded modified SBA-15 (M/SBA-15) and phosphotungstic acid (H3PW12O40) for ethylene glycol (EG) production from direct catalytic conversion of cellulose. M/SBA-15 (M = Ru, Au, Pd, Pt, Rh and Ni) catalysts were prepared using the impregnation method and characterized by means of XRD, N2 physisorption, TEM and H2-temperature-programmed reduction (H2-TPR) techniques. Their catalytic performance was then studied in detail on the basis of cellulose conversion and the selectivity of polyols and EG. The results showed that the mesoporous structure of the SBA-15 sample was well maintained after the metal-loaded modification, and almost all of the selected catalysts gave about 100% conversion of cellulose. However, the selectivity for EG was greatly different. Among the various binary catalysts, the combination of Rh/SBA-15 and H3PW12O40 gave the best selectivity to EG (55.5%), whereas the worst selectivity of EG (11%) was obtained over the Au/SBA-15 and H3PW12O40 system under identical conditions. In addition to phosphotungstic acid, other W compounds were also studied in combination with the Ru/SBA-15 catalyst. The results showed that the EG selectivity depended on the W compounds as follows: H4SiW12O40 < H2WO4 < H3PW12O40. Therefore, the binary catalyst of Rh/SBA-15 and H3PW12O40 showed the greatest potential for EG production from direct catalytic conversion of cellulose.
1. Introduction
The excessive consumption of fossil fuel and the ever-increasing emissions associated with their consumption have spurred a great deal of research for alternative energy sources.1 Biomass as a clean and renewable carbon source on earth has received increasing attention.2 With regards to the utilization of biomass, the conversion of cellulose holds great potential due to its nonedible nature and huge availability.3 Nevertheless, cellulose, as a biopolymer bonded by β-1,4-glucosidic bonds, contains abundant hydrogen bonds; hence, it is difficult to convert it by solvents or catalysts under mild conditions.4 Therefore, the robust structure of cellulose remains a great concern for its efficient transformation under mild conditions.In order to achieve high energy efficiency and atom economy in the conversion of cellulose, different primary routes have been explored.5–8 One of the most promising routes is direct catalytic conversion of cellulose to polyols, for which the polyol products can be directly used as chemicals or precursors to produce renewable chemicals.9 This process couples the C–C breaking reaction of cellulose by an acid catalyst to form glucose and the hydrogenation of the glucose over the metal catalysts to generate the polyols.7 Amongst the polyol products, EG has a large market and is widely used in the pharmaceutical, cosmetic, food, dye, plastic and automobile industries; thus, it is considered to be a high-value market product.10 Currently, the manufacture of EG is mainly dependent on petroleum resources using the method of oxidation, followed by hydration of ethylene.11 Therefore, obtaining EG from the direct transformation of cellulose is very significant because of its possible environment benefits and the current concern over the depletion of fossil fuel sources. For this catalytic approach, catalyst plays an important role in the selectivity of a specific polyol product. For example, using Ru/AC as the catalyst (AC = activated carbon), Liu et al. obtained ∼40% yield of hexitols.12 Zhang et al. obtained EG yield of up to ∼54% using H2WO4 in combination with 1.2% Ru/AC catalyst.13
It is well known that the dispersion and accessibility of active sites have a significant impact on the activity and selectivity of the catalyst. To develop efficient catalysts, extensive studies have been conducted by using different technologies. For example, Zhang et al. used the traditional active carbon (AC) as support for dispersing Ni particles to improve the activity of the catalyst in the catalytic conversion of cellulose to EG.14 Although the AC had large surface area, the active sites exhibited low dispersion and poor accessibility due to the microporous structure of AC. Additionally, the microporous carbon used as support may have a negative effect on the overall catalytic performance due to its steric hindrance and diffusion limitations. For this reason, mesoporous carbon (CMK-3) with WCx active sites was synthesized to catalyze cellulose.15 The WCx/CMK-3 catalyst exhibited better catalytic performance than the WCx/AC catalyst due to its good accessibility and the dispersion of the active sites. However, the rigorous synthesis conditions and difficulty in replication greatly limited its application. In 2010, Zheng et al. developed a series of bimetallic catalysts for the conversion of cellulose, including Ru–W, Ni–W, Ir–W and Pt–W supported on different carriers. It was found that the maximum yield of EG (75.4%) was obtained over the Ni–W/SBA-15 catalyst.16 In this context, the mesoporous material SBA-15 can be used as the catalyst for catalytic cracking of cellulose due to its ordered hexagonal mesostructure and large pore size, which can facilitate the conversion of bulky molecules.17 However, the pure silica SBA-15 material had almost no catalytic activity because of the absence of active sites.18 Therefore, the catalyst must be further modified and improved to solve this problem. Among all the modification methods, the impregnation method has remarkable advantages such as simple preparation and easier industrial application.19 Up to now, metals, including Ni,20 La,21 Al,22 Ca23 and Mg,24 modified with SBA-15 have shown good catalytic performance in the catalytic cracking of vegetable oils. It is worth mentioning that these catalysts were all prepared using the impregnation method. Nevertheless, there are few reports related to obtaining the desired products from catalytic conversion of cellulose over these catalysts.
In this study, we evaluated the catalytic performances of various binary catalysts of M/SBA-15 (M = Ru, Au, Pd, Pt, Rh and Ni) mesoporous materials and different W compounds and chose the best binary catalyst to produce EG from the catalytic conversion of cellulose. To the best of our knowledge, there is no clear picture of the comparative performance of these catalysts. Therefore, it is expected that the results will provide the vital guidance for the rational selection of highly active binary catalysts for the catalytic conversion of cellulose to EG.
2. Experimental
2.1 Materials
Microcrystalline cellulose (MCC, average molecular weight: 90![[thin space (1/6-em)]](https://www.rsc.org/images/entities/char_2009.gif) 000) was purchased from Sigma-Aldrich and used without further purification. Other materials, namely, tungstic acid (H2WO4), phosphotungstic acid hydrate (H3O40PW12·xH2O), tungstosilicic acid hydrate (H4[Si(W3O10)4]·xH2O), ruthenium chloride trihydrate (RuCl3·3H2O), rhodium chloride trihydrate (RhCl3·3H2O), chloroplatinic acid hexahydrate (H2PtCl6·6H2O), nickel chloride hexahydrate (NiCl2·6H2O), palladium chloride (PdCl2), chloroauric acid tetrahydrate (HAuCl4·4H2O), triblock copolymer-P123 (EO20PO70EO20), and tetraethyl orthosilicate (TEOS), were all purchased from Aldrich and used after drying without any further treatment.
000) was purchased from Sigma-Aldrich and used without further purification. Other materials, namely, tungstic acid (H2WO4), phosphotungstic acid hydrate (H3O40PW12·xH2O), tungstosilicic acid hydrate (H4[Si(W3O10)4]·xH2O), ruthenium chloride trihydrate (RuCl3·3H2O), rhodium chloride trihydrate (RhCl3·3H2O), chloroplatinic acid hexahydrate (H2PtCl6·6H2O), nickel chloride hexahydrate (NiCl2·6H2O), palladium chloride (PdCl2), chloroauric acid tetrahydrate (HAuCl4·4H2O), triblock copolymer-P123 (EO20PO70EO20), and tetraethyl orthosilicate (TEOS), were all purchased from Aldrich and used after drying without any further treatment.
2.2 Preparation and characterization of catalysts
SBA-15 was synthesized by the hydrothermal method according to the literature.25 The molar composition of the mixture was 1TEOS![[thin space (1/6-em)]](https://www.rsc.org/images/entities/char_2009.gif) :
:![[thin space (1/6-em)]](https://www.rsc.org/images/entities/char_2009.gif) 0.02P123
0.02P123![[thin space (1/6-em)]](https://www.rsc.org/images/entities/char_2009.gif) :
:![[thin space (1/6-em)]](https://www.rsc.org/images/entities/char_2009.gif) 6HCl
6HCl![[thin space (1/6-em)]](https://www.rsc.org/images/entities/char_2009.gif) :
:![[thin space (1/6-em)]](https://www.rsc.org/images/entities/char_2009.gif) 192H2O.
192H2O.
Ru/SBA-15 catalyst was prepared by the wet impregnation method. First, 1.0 g SBA-15 powder was immersed into 20 mL RhCl3·3H2O solution (10 wt%) under stirring at 80 °C. After evaporation at 80 °C, the sample was dried at 100 °C for 12 h and then calcined at 550 °C for 6 h in air. The solid obtained was reduced with H2 (20 cm3 min−1) at 550 °C for 2 h at a heating rate of 2 °C min−1, giving the Ru-SBA-15 catalyst. Other catalysts such as Ni (Pt, Pd, Au, Rh)/SBA-15 were also prepared using the same method.
XRD patterns were recorded on a XB-3A instrument operating at 40 kV and 100 mA with Cu Kα radiation (λ = 0.15418 nm) in the 2θ range from 0.5° to 10°. The experiment conditions were as follows: a step width of 0.01° and scan speed of 2° min−1. The BET specific surface area and pore size distribution of the catalysts were measured from N2 adsorption/desorption isotherms at −77 K using a Micromeritics ASAP 2000 system. TEM images were recorded to observe the dispersion degree of the metal phase. Transmission electron microscopy (TEM) was conducted on a JEOS-2020 F electron microscope operating at an accelerating voltage of 200 kV. The metal contents of the as-synthesized catalyst were measured by inductively coupled plasma-atomic emission spectrometry (ICP-AES) technique on a Varian VISTA-PRO AX spectrophotometer.
H2-temperature-programmed reduction (H2-TPR) was performed in a fixed reactor. Prior to the TPR, 100 mg samples were purged in Ar at 100 °C for 1 h. Subsequently, the samples were heated in a flow of pure H2 from 100 °C to 800 °C at a rate of 10 °C min−1 and were analyzed by a Hiden QIC-20 mass spectrometer.
2.3 Catalytic cracking cellulose
The catalytic conversion of cellulose was carried out in a Teflon-lined stainless autoclave (100 mL) at 245 °C for 4 h under 5.0 MPa hydrogen pressure. Typically, the reaction mixture was composed of cellulose (W1), binary catalyst (0.1 g M/SBA-15 and 0.02 g W compounds) and 25 mL of H2O, which were successively placed in the autoclave. Then, the reactor was purged with nitrogen at about 0.2 MPa to completely remove the air. The reactor was heated by external electrical resistance at a heating rate of 15 °C min−1 and its temperature was measured using a calibrated thermocouple. After the reaction, the cellulose (W2) remaining in the reactor was collected by centrifugation and used to calculate the cellulose conversion. The compositions of liquid-phase products were analyzed by HPLC equipped with RID (Refractive Index Detector). The separation was realized on a column of Bio-Rad HPX-87X column (8 × 300 mm) with 0.05 M H2SO4 aqueous solution as mobile phase, and each product (Wi) was quantified using the external standard method. The conversion (wt%) of cellulose and selectivity of the desired product (wt%) were calculated as follows:3. Results and discussion
3.1 Catalyst characterization
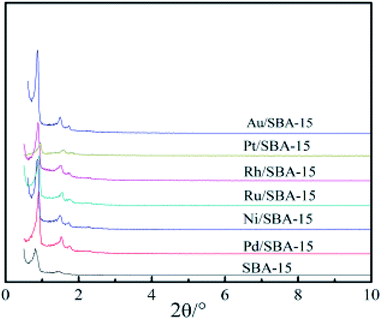
The XRD patterns of the pure silica SBA-15 and M/SBA-15 samples are shown in Fig. 1. Three characteristic reflection peaks of the SBA-15 are present at 2θ of 0.9°, 1.6° and 1.8°, which were indexed as (100), (110) and (200) diffraction peaks, respectively. The XRD profiles matched well with the hexagonally-structured SBA-15 sample reported by Zhao et al.25 Almost all of the patterns of the M/SBA-15 samples showed the three peaks with high intensity, indicating that the hexagonal mesostructure of the SBA-15 was well maintained even after the metal species were introduced.Fig. 2 displays the N2 adsorption–desorption and corresponding pore size distribution isotherms of the SBA-15 and M/SBA-15 samples. It can be seen from Fig. 2(a) that all of the samples exhibit type IV isotherms with an H1 type hysteresis loop, which is a characteristic of mesoporous materials.26 This indicates that the pure silica SBA-15 and all M/SBA-15 samples had an ordered mesostructure. The textural parameters of different samples are summarized in Table 1. It was found that the SBA-15 material had high specific surface area (580 m2 g−1), but the surface areas of the M/SBA-15 samples were reduced within the range of 394–482 m2 g−1. Moreover, the M/SBA-15 samples exhibited smaller total pore volume and larger average pore size compared to those of the pure silica SBA-15 sample. This may be due to the accumulation of metal species on the surface of the mesoporous material or deep into the channel interior, thus hindering the interior channel of the mesoporous material SBA-15 and resulting in smaller pore volume. Moreover, the metal species loaded on SBA-15 will partially block most of the micropores in the M/SBA-15 samples, thereby increasing the average pore size. All these results indicated that the metal phases were dispersed on the surface of the SBA-15 support. According to Table 1, the specific surface areas and total pore volumes of the Pd (Ni, Pt)/SBA-15 samples were relatively low compared to those of the other samples, which may be due to the accumulation of excess metal species on the surface of the SBA-15 support.
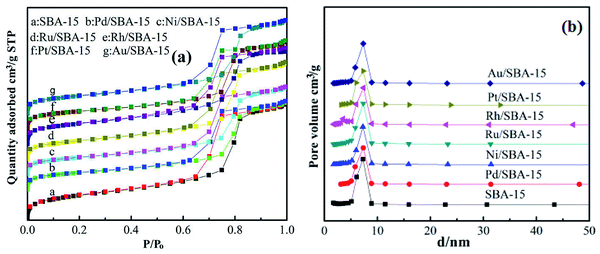 | ||
| Fig. 2 (a) N2 adsorption–desorption isotherms and (b) BJH pore size distribution of SBA-15 and M/SBA-15 samples. | ||
| Entry | Catalyst | SBETa (m2 g−1) | Dporesizeb (nm) | Vtotalc (cm3 g−1) | Vmicrod (cm3 g−1) | Vmesoe (cm3 g−1) | Metal contentf (wt%) |
|---|---|---|---|---|---|---|---|
| a From N2 absorption measurement (BET method).b Average pore diameter calculated by BJH methods.c Total pore volumes were obtained at P/P0 = 0.99.d Micropore volume was calculated using the t-plot method.e Mesopore volume calculated as VMeso = VTotal − VMicro.f Metal content was measured from ICP-AES measurements. | |||||||
| 1 | SBA-15 | 580 | 7.25 | 1.15 | 0.01 | 1.14 | — |
| 2 | Au/SBA-15 | 422 | 7.32 | 0.94 | 0.01 | 0.93 | 9.3 |
| 3 | Pt/SBA-15 | 409 | 7.30 | 0.89 | 0.02 | 0.87 | 9.5 |
| 4 | Rh/SBA-15 | 482 | 7.36 | 0.97 | 0.02 | 0.95 | 9.8 |
| 5 | Ru/SBA-15 | 436 | 7.33 | 0.98 | 0.01 | 0.97 | 9.5 |
| 6 | Ni/SBA-15 | 398 | 7.26 | 0.88 | 0.01 | 0.87 | 9.8 |
| 7 | Pd/SBA-15 | 394 | 7.32 | 0.9 | 0.02 | 0.88 | 9.7 |
The particle size distributions of the metal phase on the surface of the SBA-15 support were determined by TEM images. As shown in Fig. 3, the average particle size of different catalyst was different. The average particle sizes of Rh and Ru on the SBA-15 support were 5.78 nm and 4.25 nm, respectively (Fig. 3(c and d)). However, the average particle sizes of Ni/SBA-15 and Pd/SBA-15 were larger than 20 nm (Fig. 3(e and f)), which may be due to the aggregation of metal species on the surface of SBA-15.27 These results showed that the metal particles Au, Ru and Rh have good dispersibility on the SBA-15 support, which is consistent with the structural parameters of the different samples obtained from the N2 adsorption–desorption experiment.
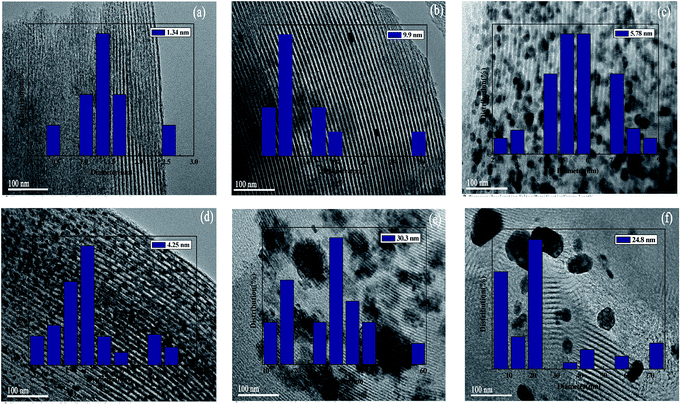 | ||
| Fig. 3 TEM images of M/SBA-15 (scale bar, 100 nm): (a) Au/SBA-15; (b) Pt/SBA-15; (c) Rh/SBA-15; (d) Ru/SBA-15; (e) Ni/SBA-15; (f) Pd/SBA-15. | ||
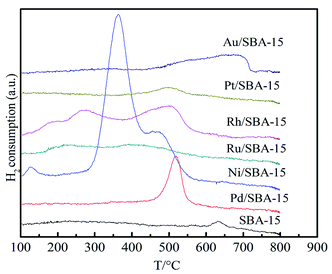
Fig. 4 displays the H2-TPR profiles of the SBA-15 and the M/SBA-15 samples. As can be seen from Fig. 4, different M/SBA-15 catalysts showed the hydrogen desorption peaks at different temperatures. This indicates that the metal species were successfully loaded on the SBA-15 sample and had catalytic hydrogenation capability. It is worth noting that the Ni (Pd)/SBA-15 samples showed higher hydrogen desorption peaks compared to those observed for the other catalysts, which may be due to the accumulation of excess Ni and Pd metal species on the surface of the SBA-15 support, which can be confirmed by the TEM images.
3.2 Catalytic performance of the M-SBA-15 and H3PW12O40 binary system
The catalytic performances of the various binary catalysts composed of M/SBA-15 and H3PW12O40 (TPA) were investigated in the catalytic conversion of cellulose. Table 2 shows the distribution of the main products, namely, ethylene glycol (EG), sorbitol (SO), mannitol (MA), 1,2-propylene glycol (PG), and glycerol (GY), obtained using different tested binary catalysts. As can be seen from Table 2, cellulose was almost totally converted even in the absence of M/SBA-15 catalysts (Entry 1), indicating that TPA plays a key role in the cracking cellulose reaction.| Entry | Catalyst/g | Conversion/% | Selectivity/% | ||||
|---|---|---|---|---|---|---|---|
| EG | SO | MA | PG | GY | |||
| a Reaction conditions: 0.5 g of cellulose; 0.1 g of catalyst; 0.02 g of H3PW12O40 (TPA); 25 mL H2O; reaction temperature, 245 °C; reaction time, 4 h; H2 pressure, 5 MPa. | |||||||
| 1 | TPA | 100 | 0 | 0 | 0 | 0 | 0 |
| 2 | Ru/SBA-15 | 98 | 13.0 | 1.0 | 0 | 1.4 | 1.4 |
| 3 | Pd/SBA-15 + TPA | 100 | 31.8 | 0 | 2.2 | 11.3 | 2.0 |
| 4 | Ni/SBA-15 + TPA | 100 | 29.2 | 0 | 0.3 | 10.6 | 1.9 |
| 5 | Ru/SBA-15 + TPA | 100 | 55.5 | 9.9 | 2.1 | 2.6 | 5.5 |
| 6 | Rh/SBA-15 + TPA | 100 | 35.5 | 3.8 | 6.8 | 6.2 | 2.2 |
| 7 | Pt/SBA-15 + TPA | 100 | 24.4 | 1.2 | 0.4 | 10.3 | 1.5 |
| 8 | Au/SBA-15 + TPA | 100 | 11.0 | 0.5 | 0 | 12.6 | 0 |
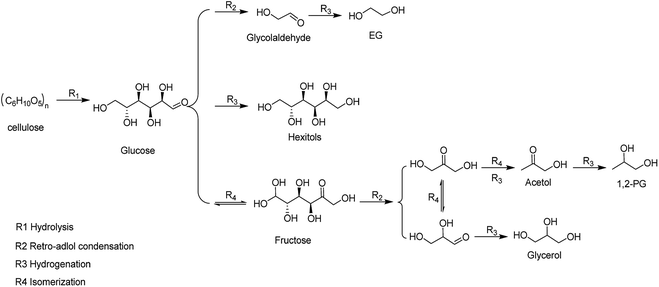
The EG selectivity significantly improved when the M/SBA-15 catalysts were introduced (Entries 3–8). According to the literature,27 metal catalyst as a hydrogenation active centre has a synergistic effect with the W compound, that is, the cellulose is hydrolyzed by W compound, followed by the metal-catalyzed hydrogenation of the formed intermediate products to obtain the EG product. Scheme 1 depicts the possible reaction routes involved in cellulose conversion to polyols. The main reaction route for the EG formation involves (R1) hydrolysis of cellulose to glucose, (R2) retro-aldol condensation of glucose to form glycolaldehyde (GA), and (R3) the hydrogenation of GA to form EG.28 Such a reaction route indicates the importance of the binary catalyst in the selective formation of EG from cellulose. From Table 2, it is observed that different combinations of the binary catalyst have a significant impact on the selectivity of EG. The best selectivity to EG (55%) was observed when the binary catalyst of Ru/SBA-15 and TPA was used (Entry 5), whereas the worst selectivity to EG (11%) was observed when using Au/SBA-15 and TPA as the binary catalyst (Entry 8). Our results indicate that the binary catalyst of Ru/SBA-15 and TPA achieve higher EG selectivity than that obtained in a previous report. Ribeiro et al. reported that the EG yield reached the 34.8% using Ru–W/CNT as the catalyst.29 Moreover, the selectivity to EG for the catalysts such as Pd, Ni and Pt modified-SBA-15 were 31.8%, 29.2% and 24.4% (Entries 3–4 and 7), respectively, which is lower than that obtained for the other metal phase modified-SBA-15 catalysts such as Ru and Rh modified-SBA-15. Based on the above N2 adsorption–desorption analysis results, Ru (Rh)-SBA-15 catalyst has larger BET surface area and pore volume than the other metal phase modified-SBA-15, indicating that the hydrogenated molecules can more easily contact with hydrogenation active sites in the Ru (Rh)-SBA-15 catalyst. Moreover, the TEM images could provide additional clues for the EG selectivity from the dispersion of metal phase on the SBA-15 support. Ru and Rh metal particles were well dispersed on the surface of the SBA-15, but Ni, Pd and Pt-modified catalysts showed distinct dark zones on the TEM images due to the metal particles aggregation. As shown in Table 2, it was found that the order of EG selectivity for M/SBA-15 metal element catalyst was Ru > Rh > Ni > Pd > Ni > Pt > Au.
3.3 Effects of combination of M/SBA-15 with various W species on the selectivity of polyols and EG product
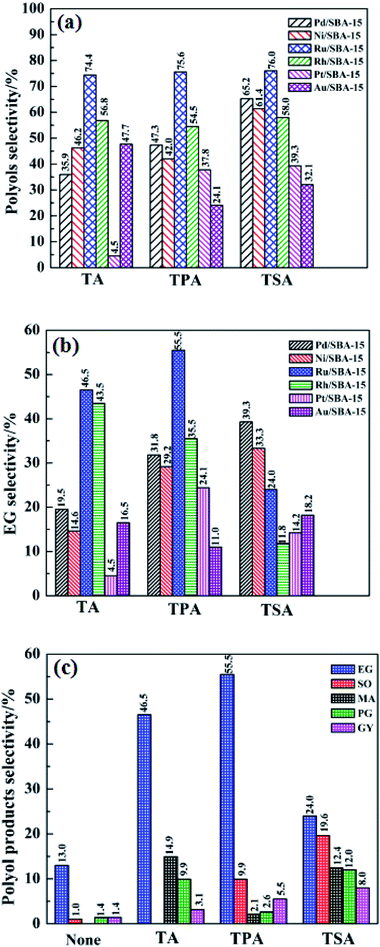
Fig. 5 shows the effect of different binary catalysts on the selectivity of the polyols, EG and the distribution of the polyol products. According to Fig. 5(a), it was found that different W compounds, namely, H2WO4 (TA), H3PW12O40 (TPA) and H4SiW12O40 (TSA) have an important impact on the selectivity of polyols. For example, when using TA, TPA and TSA in combination with Pt/SBA-15 as binary catalysts, the polyols selectivity were 35.9%, 47.3% and 65.2%, respectively. The results suggest that W compounds play a key role in the selective formation of polyols from cellulose. This can be explained by the fact that the W compounds with acid sites can promote the hydrolysis and C–C breaking reactions of cellulose. Interestingly, regardless of the type of W compounds used, the polyols selectivity is always high in the presence of Ru/SBA-15 catalyst, indicating that Ru/SBA-15 exhibit excellent catalytic performance in the selective formation of polyols. This may be due to the fact that Ru particles are well dispersed on the SBA-15 support to form more hydrogenation active sites (seeing Fig. 3(d)).The effect of different binary catalysts on the EG selectivity was investigated, and the detailed results are shown in Fig. 5(b). It was found that the binary catalyst of Ru/SBA-15 and TPA gave the highest EG selectivity (55.5%), whereas the EG selectivity of 46.5% and 24.0% were obtained when the Ru/SBA-15 was combined with TA and TSA, respectively. This indicates that the combination of Ru/SBA-15 and TPA show better synergy in the selective formation of EG from cellulose than other binary catalysts. In order to further shed light on the potential of the Ru/SBA-15 catalyst in the catalytic conversion of cellulose, the effect of binary catalyst of Ru/SBA-15 and different W compounds on the distribution of polyol products was investigated. As shown in Fig. 5(c), the addition of W compounds can effectively improve the polyol products selectivity, particularly the EG selectivity, which increases from 13.0% to 55.5% after the addition of TPA. At the same time, it can be seen that regardless of which W compound was used in combination with Ru/SBA-15, EG was always predominant product. These results indicate that W compounds play an important role in the selective formation of EG from cellulose. It is worth noting that the lower EG selectivity (24.0%) and higher SO selectivity (19.6%) were observed when using TSA and Ru/SBA-15 as the binary catalyst. The reason for higher SO selectivity and lower EG selectivity can be explained as follows: TSA catalyze the cleavage of C–C bonds of cellulose by retro-aldol reaction, but it is less active to C–C breaking reaction of cellulose so that it results in lower EG selectivity.13 Based on the above analysis, we can conclude that the EG selectivity depended on the W compounds in the presence of the Ru/SBA-15 in the following order: TSA < TA < TPA. These results show the potential of the binary catalyst of Ru/SBA-15 and TPA in the selective formation of EG from cellulose. As Ru/SBA-15 and TPA system has good selectivity to EG, the binary catalyst was chosen for the further study.
3.4 The effect of reaction conditions on the distribution of main products
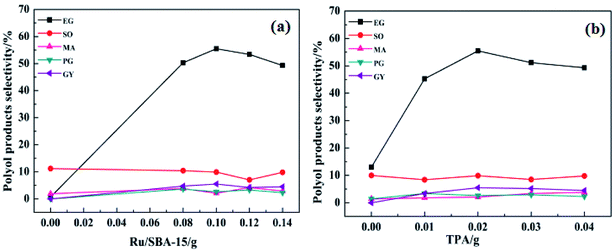
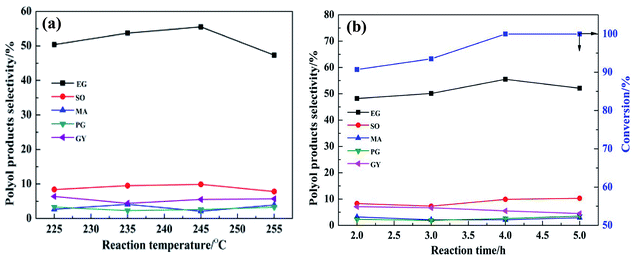
In order to improve the EG selectivity, the reaction conditions for the catalytic conversion of cellulose using the binary catalyst of Ru/SBA-15 and TPA as catalyst were investigated. Fig. 6 shows the effect of catalyst dosage on the distribution of polyol products. Fig. 6(a) displays the effect of the Ru/SBA-15 dosage on the distribution of polyol products. As shown in Fig. 6(a), the selectivity of EG increased with the increase in the Ru/SBA-15 dosage from 0.0 g to 0.1 g. When the catalyst Ru/SBA-15 dosage was 0.1 g, EG selectivity reached the maximum of 55.5%. However, when the Ru/SBA-15 dosage was 0.14 g, the selectivity of EG decreased to 49.3%. This can be explained by the fact that the more the amount of Ru/SBA-15, the faster would be the reaction for EG hydrogenolysis.11 Therefore, the optimal the amount of Ru/SBA-15 seems to be 0.1 g. Fig. 6(b) shows the effect of the TPA dosage on the distribution of polyol products. According to Fig. 6(b), when only Ru/SBA-15 was used, the polyol products such as EG, SO and MA were produced from the C–C breaking reaction of cellulose. This indicates that Ru-SBA-15 not only possesses hydrogenation properties, but also has hydrogenolysis ability. Compared with no TPA, the addition of TPA can greatly improve the EG selectivity. For example, when the amount of TPA was 0.02 g and on fixing the amount of Ru/SBA-15 at 0.1 g, EG selectivity was enhanced from 13.0% to 55.5%. Nevertheless, when the TPA dosage was 0.03 g, the EG selectivity decreased to 51.2%. Similar to the influence of the Ru/SBA-15 content, the selectivity for EG also showed a volcano curve with the change in the amount of TPA, signifying that a good balance between Ru/SBA-15 and TPA is required. Based on the above results, the binary catalyst combination of 0.1 g Ru/SBA-15 and 0.02 g TPA shows the best catalytic performance for EG selectivity from catalytic conversion cellulose.The plot showing the effect of reaction temperature on the distribution of polyol products is displayed in Fig. 7(a). As the reaction temperature increased from 225 °C to 245 °C, the EG selectivity increased from 50.4% to 55.5%, respectively. This might be due to the fact that more H+ was produced from hot compressed water at higher temperature to promote the conversion of cellulose, and/or the higher temperature might provide more energy for the cleavage of C–C bond of sugar intermediates.30 When the temperature was increased to 255 °C, the selectivity for EG decreased to 47.3%. This may be due to the deactivation of active sites or the degradation of EG product at higher temperature. Therefore, the optimum operating temperature was set as 245 °C. Fig. 7(b) displays the effect of reaction time on the distribution of polyol products. When the reaction time was increased from 2.0 h to 4.0 h, the EG selectivity increased from 48.2% to 55.5%, respectively. With prolonged reaction time, the selectivity to EG decreased from 55.5% to 52.1%. This is ascribed to the long reaction time favoring side reactions such as hydrogenolysis of EG.11 Therefore, the optimum reaction conditions for EG selectivity were as follows: Ru/SBA-15: 0.1 g; TPA: 0.02 g; 245 °C, 4 h. Under the abovementioned conditions, the EG selectivity reached nearly 55.5%.
4. Conclusion
The direct catalytic conversion of cellulose into EG was investigated over the various binary catalysts composed of M/SBA-15 and W compounds. A remarkable advantage of these binary catalysts was that it not only led to a nearly 100% conversion of cellulose, but also gave the higher selectivity for EG. Among the binary catalysts, Ru/SBA-15 and TPA system showed the excellent performance for EG selectivity (about 55.5%). More importantly, compared with single catalyst, the use of the binary catalyst can significantly improve the EG selectivity due to the synergistic effect between M/SBA-15 and W compounds. Moreover, the SBA-15 mesoporous material, which has a large surface area and ordered hexagonal mesopore, facilitates not only the high dispersion of metal element but also the transport of reactant and product molecules. Taking into account that the raw material used is cellulose and the importance of EG in the petrochemical industry, the new binary catalyst of Ru/SBA-15 and TPA is a promising candidate for the production of EG from cellulose in the future.Conflicts of interest
There are no conflicts to declare.Acknowledgements
This study was financially supported by the Natural Science Foundation of China (31370570 and 31100430), the Taishan Scholars Projects of Shandong (ts201511033), the Key R&D Project of Shandong (2017GGX40106), and the People's Livelihood Science and Technology Project of Qingdao (173383NSH). The authors are also grateful for the experimental conditions which the Polyphase Fluid Reaction and Separation Engineering Key Laboratory of the Shandong give.References
- M. A. Harmer, A. Fan, A. Liauw and R. K. Kumar, A new route to high yield sugars from biomass: phosphoric-sulfuric acid, Chem. Commun., 2009, 6610–6614 RSC.
- D. L. Klass, Biomass for renewable energy, fuels, and chemicals, 1998, 29, 1028–1037 Search PubMed.
- J. Pang, A. Wang, M. Zheng, Y. Zhang, Y. Huang and X. Chen, Catalytic conversion of cellulose to hexitols with mesoporous carbon supported Ni-based bimetallic catalysts, Green Chem., 2012, 14, 614–617 RSC.
- Y. Yu, L. Xia and H. Wu, Some recent advances in hydrolysis of biomass in hot-compressed water and its comparisons with other hydrolysis methods, Energy Fuels, 2008, 22, 46–60 CrossRef.
- A. Fukuoka and P. L. Dhepe, Catalytic conversion of cellulose into sugar alcohols, Angew. Chem., 2006, 45, 5285–5287 CrossRef.
- V. Stijn, G. Jan, P. A. Jacops and B. F. Sels, Recent advances in the catalytic conversion of cellulose, ChemCatChem, 2011, 3, 82–94 CrossRef.
- J. Geboers, D. V. S. Van, K. Carpentier, P. Jacobs and B. Sels, Efficient hydrolytic hydrogenation of cellulose in the presence of Ru-loaded zeolites and trace amounts of mineral acid, Chem. Commun., 2011, 47, 5590–5592 RSC.
- D. V. S. Van, J. Geboers, M. Dusselier, H. Schepers, T. Vosch and L. Zhang, Selective bifunctional catalytic conversion of cellulose over reshaped Ni particles at the tip of carbon nanofibers, Chemsuschem, 2010, 3, 698–701 CrossRef PubMed.
- J. N. Chheda, G. W. Huber and J. A. Dumesic, Liquid-Phase catalytic processing of biomass-derived oxygenated hydrocarbons to fuels and chemicals, Angew. Chem., Int. Ed., 2007, 46, 7164–7183 CrossRef PubMed.
- H. Yue, Y. Zhao, X. Ma and J. Gong, Ethylene Glycol: Properties, Synthesis, and Applications, Chem. Soc. Rev., 2012, 41, 4218–4424 RSC.
- Z. Tai, J. Zhang, A. Wang, J. Pang, M. Zheng and T. Zhang, Catalytic conversion of cellulose to ethylene glycol over a low-cost binary catalyst of Raney Ni and tungstic acid, Chemsuschem, 2013, 6, 652–658 CrossRef PubMed.
- C. Luo, S. Wang and H. Liu, Cellulose conversion into polyols catalyzed by reversibly formed acids and supported ruthenium clusters in hot water, Angew. Chem., 2007, 119, 7780–7783 CrossRef.
- Z. Tai, J. Zhang, A. Wang, M. Zheng and T. Zhang, Temperature-controlled phase-transfer catalysis for ethylene glycol production from cellulose, Chem. Commun., 2012, 48, 7052–7054 RSC.
- N. Ji, T. Zhang, M. Zheng, A. Wang, H. Wang, X. Wang and J. G. Chen, Direct Catalytic conversion of cellulose into ethylene glycol using nickel-promoted tungsten carbide catalysts, Angew. Chem., Int. Ed., 2008, 47, 8510–8513 CrossRef PubMed.
- Y. Zhang, A. Wang and T. Zhang, A new 3D mesoporous carbon replicated from commercial silica as a catalyst support for direct conversion of cellulose into ethylene glycol, Chem. Commun., 2010, 46, 862–864 RSC.
- M. Y. Zheng, A. Q. Wang, N. F. Pang, X. D. Wang and T. Zhang, Transition metal-tungsten bimetallic catalysts for the conversion of cellulose into ethylene glycol, ChemSusChem, 2010, 3, 63–66 CrossRef PubMed.
- Y. L. Cao, J. W. Wang, L. I. Q. Feng, N. Yin, Z. M. Liu, M. Q. Kang and Y. L. Zhu, Hydrolytic hydrogenation of cellulose over Ni-WO3/SBA-15 catalysts, J. Fuel Chem. Technol., 2013, 41, 943–949 CrossRef.
- M. Baca, E. D. L. Rochefoucauld, E. Ambroise, J. M. Krafft, R. Hajjar, P. P. Man, X. Carrier and J. Blanchard, Characterization of mesoporous alumina prepared by surface alumination of SBA-15, Microporous Mesoporous Mater., 2008, 110, 232–241 CrossRef.
- Y. Zheng, F. Wang, X. Yang, Y. Huang, C. Liu and Z. Zheng, Study on aromatics production via the catalytic pyrolysis vapor upgrading of biomass using metal-loaded modified H-ZSM-5, J. Anal. Appl. Pyrolysis, 2017, 126, 169–179 CrossRef.
- X. Zhang, Q. Zhang, T. Wang, B. Li, Y. Xu and L. Ma, Efficient upgrading process for production of low quality fuel from bio-oil, Fuel, 2016, 179, 312–321 CrossRef.
- G. E. Luz Jr, A. G. D. Santos, A. C. R. Melo, R. M. Oliveira, A. S. Araujo and V. J. Fernandes Jr, Thermal catalytic cracking of buriti oil over LaSBA-15 mesoporous materials, Fuel Process. Technol., 2011, 92, 2099–2104 CrossRef.
- Y. S. Ooi and S. Bhatia, Aluminum-containing SBA-15 as cracking catalyst for the production of biofuel from waste used palm oil, Microporous Mesoporous Mater., 2007, 102, 310–317 CrossRef.
- M. C. G. Albuquerque, I. Jimenez-Urbistondo, J. Santamaria-Gonzalez, J. M. Merida-Robles, R. Moreno-Tost, E. Rodrrguez-Castellon, A. Jimenez-Lopez, D. C. S. Azevedo, C. L. Cavalcante Jr and P. Maireles-Torres, CaO supported on mesoporous silicas as basic catalysts for transesterification reactions, Appl. Catal., A, 2008, 334, 35–43 CrossRef.
- Y. L. Wei, Y. Cao and J. H. Zhu, Attempts on preparing mesoporous basic material MgO/SBA-15, Stud. Surf. Sci. Catal., 2004, 154, 878–885 CrossRef.
- D. Zhao, J. Feng, Q. Huo, N. Melosh, G. H. Fredrickson, B. F. Chmelka and G. D. Stucky, Triblock copolymer syntheses of mesoporous silica with periodic 50 to 300 angstrom pores, Science, 1998, 279, 548–552 CrossRef PubMed.
- S. Y. Wang, W. Z. He, C. Liu, G. M. Li and F. E. Zhang, Characterizations and preparation of Mg(OH)2 nanocrystals through ultrasonic–hydrothermal route, Res. Chem. Intermed., 2016, 42, 4135–4145 CrossRef.
- V. Jollet, F. Chambon, F. Rataboul, A. Cabiac, C. Pinel, E. Guillon and N. Essayem, Tungsten trioxide promoted selective conversion of cellulose into propylene glycol and ethylene glycol on a ruthenium catalyst, Angew. Chem., 2012, 13, 3303–3307 Search PubMed.
- M. Y. Zheng, J. F. Pang, R. Y. Sun, A. Wang and T. Zhang, Selectivity control for cellulose to diols: dancing on eggs, ACS Catal., 2017, 7, 1939–1954 CrossRef.
- L. S. Ribeiro, J. Órfão, J. J. D. M. Órfão and M. F. R. Pereira, Hydrolytic hydrogenation of cellulose to ethylene glycol over carbon nanotubes supported Ru–W bimetallic catalysts, Cellulose, 2018, 25, 2259–2272 CrossRef.
- V. Jollet, F. Chambon, F. Rataboul, A. Cabiac, C. Pinel, E. Guillon and N. Essayem, Non-Catalyzed and Pt/γ-Al2O3 catalyzed hydrothermal cellulose dissolution-conversion: influence of the reaction parameters, Top. Catal., 2010, 53, 1254–1257 CrossRef.
| This journal is © The Royal Society of Chemistry 2018 |


