 Open Access Article
Creative Commons Attribution 3.0 Unported Licence
One-step cathodic electrodeposition of a cobalt hydroxide–graphene nanocomposite and its use as a high performance supercapacitor electrode material
Seyed Abbas Rahimia,
Parviz Norouzi *ab and
Mohammad Reza Ganjaliab
aCenter of Excellence in Electrochemistry, Faculty of Chemistry, University of Tehran, Tehran, Iran. E-mail: norouzi@khayam.ut.ac.ir; pnorouzi@gmail.com
bBiosensor Research Center, Endocrinology & Metabolism Molecular-Cellular Sciences Institute, Tehran University of Medical Sciences, Tehran, Iran
First published on 27th July 2018
Abstract
In this study, Co(OH)2-reduced graphene oxide has been synthesized using a simple and rapid one-step cathodic electrodeposition method in a two electrode system at a constant current density on a stainless steel plate, and then characterized as a supercapacitive material on Ni foam. The composites were characterized by FT-IR, X-ray diffraction, scanning electron microscopy, and cyclic voltammetry using a galvanostatic charge/discharge test. The feeding ratios of the initial components for electrodeposition had a significant effect on the structure and electrochemical performance of the Co(OH)2-reduced graphene oxide composite. The results show that the 1![[thin space (1/6-em)]](https://www.rsc.org/images/entities/char_2009.gif) :
:![[thin space (1/6-em)]](https://www.rsc.org/images/entities/char_2009.gif) 4 (w/w) ratio of GO
4 (w/w) ratio of GO![[thin space (1/6-em)]](https://www.rsc.org/images/entities/char_2009.gif) :
:![[thin space (1/6-em)]](https://www.rsc.org/images/entities/char_2009.gif) CoCl2·6H2O was optimum and produced an intertwined composite structure with impressive supercapacitive behavior. The specific capacitance of the composite was measured to be 734 F g−1 at a current density of 1 A g−1. Its rate capability was ∼78% at 20 A g−1 and its capacitance retention was 95% after 1000 cycles of charge–discharge. Moreover, its average energy density and power density were calculated to be 60.6 W h kg−1 and 3208 W kg−1, respectively. This green synthesis method enables a rapid and low-cost route for the large scale production of Co(OH)2-reduced graphene oxide nanocomposite as an efficient supercapacitor material.
CoCl2·6H2O was optimum and produced an intertwined composite structure with impressive supercapacitive behavior. The specific capacitance of the composite was measured to be 734 F g−1 at a current density of 1 A g−1. Its rate capability was ∼78% at 20 A g−1 and its capacitance retention was 95% after 1000 cycles of charge–discharge. Moreover, its average energy density and power density were calculated to be 60.6 W h kg−1 and 3208 W kg−1, respectively. This green synthesis method enables a rapid and low-cost route for the large scale production of Co(OH)2-reduced graphene oxide nanocomposite as an efficient supercapacitor material.
Introduction
At present, the demand for and application of energy is essential for the development of modern technologies. However, the growing needs for energy bring about environmental problems and the consumption of natural resources. Hence, extreme research for developing new technology on energy storage and delivery has allured much attention.1–3 In relation to this, supercapacitors (SCs) are regarded as encouraging candidates for energy storage due to their high power performance, long life cycle, fast charging rate and low maintenance cost.4–6 In general, supercapacitors can be classified into two types: (i) electrical double-layer capacitors (EDLCs) that use carbon-based materials as electrode material and (ii) pseudocapacitors that employ transition metal oxides/hydroxides and conductive polymers.7,8Carbon-based EDLCs typically display excellent rate capability and very good cycle lives, but they have low specific capacitances because of the surface accessibility of the carbonaceous material to the electrolyte. Moreover, metal oxides/hydroxides-based pseudocapacitors show high specific capacitances through a fast faradic reaction, but they suffer from low power density arising from weak electrical conductivity of the electroactive material. This restricts fast electron transfer and leads to poor cycling stability because of probable damage to the electroactive material structure during the charge–discharge cycles.9 Consequently, applying a hybrid material of carbonaceous materials and metal oxides/hydroxides are expected to have a good performance in supercapacitors.10,11
Among a wide variety of metal oxide/hydroxide pseudocapacitive materials (e.g. RuO2·H2O, IrO2·H2O, MnO2·H2O, V2O5, Co3O4, Co(OH)2 and Ni(OH)2),12 cobalt hydroxide is considered a promising candidate owing to its low cost, well-defined electrochemical reactions, layered structure with large interlayer spacing that facilitate the diffusion of electrolyte ions to the surface of electroactive material, and environmental compatibility.13–15 In view of the fact that Co(OH)2, as a pseudocapacitive material, has limitations such as low conductivity and intense agglomeration during charge and discharge processes, its application as a high-performance supercapacitor material has not yet been realized.16,17 In this regard, many researchers have attempted to overcome these limitations and boost the supercapacitor properties of Co(OH)2 by using new methods and strategies for synthesis and modification of individual structures18–21 or hybrid structures of Co(OH)2.22–26 In the same vein, using carbon-based materials in combination with Co(OH)2 is one of these strategies to take advantage of synergistic effects and to improve supercapacitor properties of Co(OH)2. Among carbonaceous materials, graphene has attracted intense interest because of its unique electrical and mechanical properties, such as high electrical conductivity (103 to 104 S m−1) and large specific surface area (calculated theoretical value 2630 m2 g−1).27,28
Recently, cobalt hydroxide-reduced graphene oxide (Co(OH)2-rGO) composites have been prepared with different morphologies and structures by different chemical and electrochemical methods. Chemical precipitation,23,29 chemical bath deposition,30,31 chemical reduction precipitation,32 and hydrothermal preparation33–41 are examples of chemical methods that have been used to prepare Co(OH)2–graphene composites. Also, the preparation of Co(OH)2–graphene composites was performed by using electrochemical methods, such as cathodic electrodeposition after Radio Frequency-Plasma Enhanced Chemical Vapor Deposition (RF-PECVD),42,43 potentiodynamic electrodeposition15 and electrodeposition using chronopotentiometry.44,45
Although in the various abovementioned methods some excellent achievements, such as high specific capacitances and long cycle life (1636 F g−1,44 1139 F g−1,31 1030 F g−1,14 960 F g−1![[thin space (1/6-em)]](https://www.rsc.org/images/entities/char_2009.gif) 36), have been gained, a number of challenges still need to be addressed, such as the complexity of the synthesis method, the expense of equipment and consumption of time. To the best of our knowledge, in only one single report, graphene–Co(OH)2 supercapacitor electrode material has been prepared by a simple one-step chemical reduction method.32 Although one step electrochemical synthesis of rGO-Ni(OH)2
36), have been gained, a number of challenges still need to be addressed, such as the complexity of the synthesis method, the expense of equipment and consumption of time. To the best of our knowledge, in only one single report, graphene–Co(OH)2 supercapacitor electrode material has been prepared by a simple one-step chemical reduction method.32 Although one step electrochemical synthesis of rGO-Ni(OH)2![[thin space (1/6-em)]](https://www.rsc.org/images/entities/char_2009.gif) 46 and in situ glucose-assisted electrodeposition of rGO/MnO2
46 and in situ glucose-assisted electrodeposition of rGO/MnO2![[thin space (1/6-em)]](https://www.rsc.org/images/entities/char_2009.gif) 47 has been reported, there is no report yet in the literature on the one-step electrochemical deposition of Co(OH)2-rGO nanocomposite.
47 has been reported, there is no report yet in the literature on the one-step electrochemical deposition of Co(OH)2-rGO nanocomposite.
In the present study, a facile and rapid one-step cathodic electrodeposition method has been developed for the synthesis of Co(OH)2-rGO composite. Moreover, this study offers a green preparation method for the composite. These features provide us with an opportunity to have facile control on the synthesis parameters.
The electrochemical properties of the as-prepared supercapacitor electrode materials were investigated in detail. In addition, the effect of the ratio of starter components on the structure and electrochemical properties of the hybrid material is addressed. Moreover, the structural and supercapacitive properties of the as-prepared Co(OH)2–graphene composite was compared with that of pure Co(OH)2, which was synthesized in a similar way.
Experimental section
Chemicals
CoCl2·6H2O, graphite flakes, KMnO4, KOH, H2SO4 (98%), H3PO4 (85%), HCl (37%) and H2O2 (30%) were obtained from Merck chemical Co. Polytetrafluoroethylene (PTFE), N-methyl-2-pyrrolidone (NMP) and carbon black were purchased from Sigma-Aldrich Co. Ni foam was purchased from nano-BAZAR Co., Ltd. (Tehran, Iran). All chemicals were used without any further purification and all aqueous solutions were prepared using deionized water.Synthesis of graphene oxide (GO)
GO was prepared from graphite flake powder according to the modified Hummer method.48 In summary, 1.0 g of graphite powder was added to a 9![[thin space (1/6-em)]](https://www.rsc.org/images/entities/char_2009.gif) :
:![[thin space (1/6-em)]](https://www.rsc.org/images/entities/char_2009.gif) 1 (v/v) mixture of H2SO4
1 (v/v) mixture of H2SO4![[thin space (1/6-em)]](https://www.rsc.org/images/entities/char_2009.gif) :
:![[thin space (1/6-em)]](https://www.rsc.org/images/entities/char_2009.gif) H3PO4. After sonication of the mixture for 1 h, 6.0 g of KMnO4 was added slowly (within 5 minutes) with stirring while the temperature was maintained below 40 °C. About 2–3 h after addition of the KMnO4, the color of the mixture turned from dark purplish green to dark brown. The reaction mixture was stirred at ∼50 °C for 12 h, following which the solution was cooled to room temperature and then poured onto crushed ice (∼300 mL) with 3 mL H2O2 to end the reaction. The color of the solution turned bright yellow. The graphene oxide (GO) formed was washed several times with 5% HCl and then with deionized water. The washing treatment was performed using decantation of supernatant by centrifugation. Finally, the gel-like product was dried in vacuum at 80 °C and finally, a dark brown product was obtained.
H3PO4. After sonication of the mixture for 1 h, 6.0 g of KMnO4 was added slowly (within 5 minutes) with stirring while the temperature was maintained below 40 °C. About 2–3 h after addition of the KMnO4, the color of the mixture turned from dark purplish green to dark brown. The reaction mixture was stirred at ∼50 °C for 12 h, following which the solution was cooled to room temperature and then poured onto crushed ice (∼300 mL) with 3 mL H2O2 to end the reaction. The color of the solution turned bright yellow. The graphene oxide (GO) formed was washed several times with 5% HCl and then with deionized water. The washing treatment was performed using decantation of supernatant by centrifugation. Finally, the gel-like product was dried in vacuum at 80 °C and finally, a dark brown product was obtained.
Preparation of Co(OH)2-rGO nanocomposite by cathodic electrodeposition
GO powder and CoCl2·6H2O were used to prepare electrolyte solutions for cathodic electrodeposition. Four different weight ratios of these components were used. The following is a typical process for preparation of 1![[thin space (1/6-em)]](https://www.rsc.org/images/entities/char_2009.gif) :
:![[thin space (1/6-em)]](https://www.rsc.org/images/entities/char_2009.gif) 4 (w/w) ratio of GO. CoCl2·6H2O and 100 mg of GO powder was dispersed in 200 mL deionized water by ultrasonic treatment (at least 1 h). Then, 400 mg of CoCl2·6H2O was dissolved in ∼50 mL of deionized water and added to the above GO dispersion, which was further diluted to 500 mL and then stirred for 20 minutes to obtain a homogenous mixture.
4 (w/w) ratio of GO. CoCl2·6H2O and 100 mg of GO powder was dispersed in 200 mL deionized water by ultrasonic treatment (at least 1 h). Then, 400 mg of CoCl2·6H2O was dissolved in ∼50 mL of deionized water and added to the above GO dispersion, which was further diluted to 500 mL and then stirred for 20 minutes to obtain a homogenous mixture.
Cathodic electrodeposition was carried out in a simple two-electrode system containing a stainless steel plate (10 cm × 5 cm) as the cathode electrode centred between two graphite plates (12 cm × 5 cm) as the anode electrodes (at 1 cm space). The cell system was connected to a power supply. The Co(OH)2-rGO composites were electrodeposited at a constant current density of 1.7 mA cm−2 for 15 min. After electrodeposition, the cathode electrode was washed with deionized water and dried at 60 °C and then, the film was removed from the electrode surface. The obtained samples were composites of 1![[thin space (1/6-em)]](https://www.rsc.org/images/entities/char_2009.gif) :
:![[thin space (1/6-em)]](https://www.rsc.org/images/entities/char_2009.gif) 2, 1
2, 1![[thin space (1/6-em)]](https://www.rsc.org/images/entities/char_2009.gif) :
:![[thin space (1/6-em)]](https://www.rsc.org/images/entities/char_2009.gif) 4, 1
4, 1![[thin space (1/6-em)]](https://www.rsc.org/images/entities/char_2009.gif) :
:![[thin space (1/6-em)]](https://www.rsc.org/images/entities/char_2009.gif) 8, and 1
8, and 1![[thin space (1/6-em)]](https://www.rsc.org/images/entities/char_2009.gif) :
:![[thin space (1/6-em)]](https://www.rsc.org/images/entities/char_2009.gif) 20 (w/w) ratios of GO
20 (w/w) ratios of GO![[thin space (1/6-em)]](https://www.rsc.org/images/entities/char_2009.gif) :
:![[thin space (1/6-em)]](https://www.rsc.org/images/entities/char_2009.gif) CoCl2·6H2O and were labelled as GC2, GC4, GC8, and GC20, respectively. To study the effect of GO, other pure Co(OH)2 nanostructures were electrodeposited from a solution containing 400 mg of CoCl2·6H2O under the same conditions.
CoCl2·6H2O and were labelled as GC2, GC4, GC8, and GC20, respectively. To study the effect of GO, other pure Co(OH)2 nanostructures were electrodeposited from a solution containing 400 mg of CoCl2·6H2O under the same conditions.
Cobalt chloride salt was used as an ion source and supporting electrolyte in the electrochemical system. Then, by applying the constant current to the electrolyte, H2O reduction (eqn (1)) and/or the oxygen evolution reaction (eqn (2)) could act as prominent production sources of the hydroxyl group (OH−) according to following reactions.49,50
| 2H2O + 2e− → H2 + 2OH−, E0 = −1.08 V | (1) |
| O2 + 2H2O + 4e− → 4OH−, E0 = 0.40 V | (2) |
In fact, the oxygen evolution reaction is composed of two parallel reactions, eqn (3) and (4), and takes advantage of H2O2 as an intermediate component to produce OH−.
| O2 + 2H2O + 2e− → H2O2 + 2OH− | (3) |
| H2O2 + 2e− → 2OH− | (4) |
By applying the cathodic current to the stainless steel electrode, the produced OH− species are localized at the surface of the electrode. As the reaction proceeds, the Co2+ ions near the electrode surface undergo hydrolysis and condensation simultaneously and convert to Co(OH)2, which and deposits on the electrode based on the following equation:49,50
| Co2+ + 2OH− → Co(OH)2 | (5) |
In the case of Co(OH)2-rGO synthesis, the dispersed sheets of GO in solution are negatively charged due to the existence of the ionized hydroxyl and carboxyl groups on their surface.51,52 After the cobalt salt was added to the solution, these functional groups electrostatically absorb the Co2+ ions. This phenomenon could allow for the simultaneous hydrolysis and condensation reactions of the Co2+ ions with OH− along with co-deposition and reduction of GO sheets to form Co(OH)2-rGO on the electrode surface. The schematic picture of cathodic electrodeposition of Co(OH)2-rGO is shown in Fig. 1.
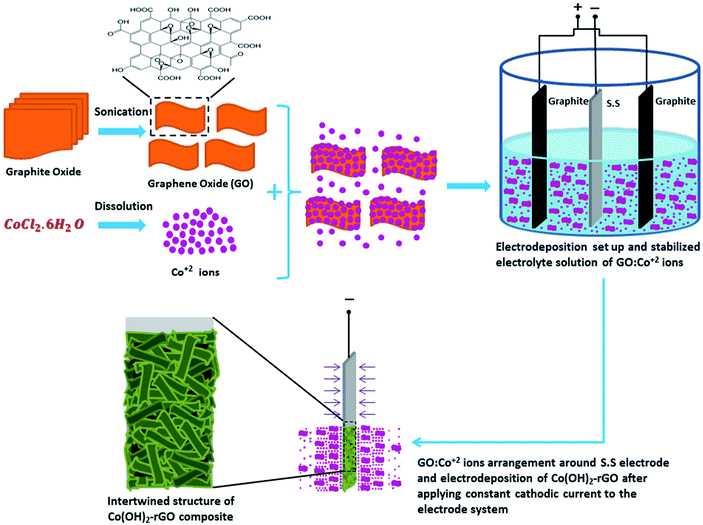 | ||
| Fig. 1 Schematic illustration of the one-step cathodic electrodeposition process of Co(OH)2-rGO composite in a simple two electrode system. | ||
Characterization
The chemical ingredients, morphology and crystalline structure of the electrodeposited samples were investigated by Fourier transform infrared spectroscopy (FT-IR, Perkin Elmer), scanning electron microscopy (SEM, COXEM) (supplied with an energy dispersive spectrometer, EDS, IXRF), and X-ray diffraction (XRD, STOE, provided with Cu-Kα radiation λ = 1.54056 Å).Electrochemical testing of the composite electrode material
Electrochemical properties of the composites were investigated under a three-electrode electrochemical cell at room temperature. The working electrodes were fabricated by mixing the well-prepared powder of active materials with acetylene black and PTFE in a mass ratio of 85![[thin space (1/6-em)]](https://www.rsc.org/images/entities/char_2009.gif) :
:![[thin space (1/6-em)]](https://www.rsc.org/images/entities/char_2009.gif) 10
10![[thin space (1/6-em)]](https://www.rsc.org/images/entities/char_2009.gif) :
:![[thin space (1/6-em)]](https://www.rsc.org/images/entities/char_2009.gif) 5 and dispersed in NMP solvent. PTFE and acetylene black were used as the binder and conductive agent, respectively. The as-prepared slurry was coated onto the Ni foam substrate (1 cm × 1 cm) using a spatula and then dried at 60 °C for 12 h. Finally, the electrode was pressed under a pressure of 2 MPa. A platinum wire and an Ag/AgCl electrode were used as the counter and the reference electrode, respectively. The as-prepared electrodes were immersed in 2.0 M KOH solution for at least 8 h. The electrochemical measurements were carried out in a 2.0 M KOH aqueous electrolyte. Cyclic voltammogram (CV) and galvanostatic charge/discharge (GCD) curves were recorded by a potentiostat (Autolab PGSTAT302N). Electrochemical Impedance Spectroscopy (EIS) was recorded at 0.1 V AC voltage within a frequency range of 100 kHz to 0.1 Hz. All electrochemical experiments were performed at room temperature.
5 and dispersed in NMP solvent. PTFE and acetylene black were used as the binder and conductive agent, respectively. The as-prepared slurry was coated onto the Ni foam substrate (1 cm × 1 cm) using a spatula and then dried at 60 °C for 12 h. Finally, the electrode was pressed under a pressure of 2 MPa. A platinum wire and an Ag/AgCl electrode were used as the counter and the reference electrode, respectively. The as-prepared electrodes were immersed in 2.0 M KOH solution for at least 8 h. The electrochemical measurements were carried out in a 2.0 M KOH aqueous electrolyte. Cyclic voltammogram (CV) and galvanostatic charge/discharge (GCD) curves were recorded by a potentiostat (Autolab PGSTAT302N). Electrochemical Impedance Spectroscopy (EIS) was recorded at 0.1 V AC voltage within a frequency range of 100 kHz to 0.1 Hz. All electrochemical experiments were performed at room temperature.
Result and discussion
Characterization of electrode materials
For the investigation of functional groups, the FT-IR spectrum of GO and GC4 (as an ideal component ratio based on our studies) and four composites having different weight ratios of GO and Co salt were compared (see Fig. 2(a) and (b)). All FT-IR samples were prepared by mixing the fixed ratio of each sample (2 mg) and KBr (0.4 g) and pressed under pressure.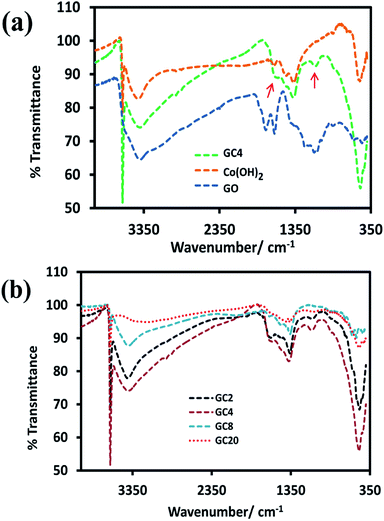 | ||
| Fig. 2 FT-IR spectrums of (a) GO, Co(OH)2 and GC4 composite and (b) four Co(OH)2-rGO hybrid materials with different weight ratios of initial components (GO and cobalt salt). | ||
As shown in Fig. 2(a), in the spectrum of GO, the absorption bands at 3417 cm−1 can be assigned to the O–H stretching vibrations. The peak located at 1625 cm−1 can be ascribed to the skeletal vibration of C![[double bond, length as m-dash]](https://www.rsc.org/images/entities/char_e001.gif) C from sp2 carbon bonds. The peaks located at 1744 cm−1, 1389 cm−1, and 1230 cm−1, can be attributed to the stretching vibrations of C
C from sp2 carbon bonds. The peaks located at 1744 cm−1, 1389 cm−1, and 1230 cm−1, can be attributed to the stretching vibrations of C![[double bond, length as m-dash]](https://www.rsc.org/images/entities/char_e001.gif) O in carboxyl groups, C–OH, and C–O–C, respectively.8,53–56 Also, the spectra for the GC4 composite and Co(OH)2 alone are shown above the GO spectrum. In the spectra of the GC4 composite and Co(OH)2, the sharp and intense peak located at 3632 cm−1 can be related to the non-hydrogen bonded O–H groups and also indicate the full formation of the β-Co(OH)2 phase in both samples.57,58 As shown in Fig. 2(a), the intensity of the peak at 3632 cm−1, related to β-Co(OH)2, is much higher than the intensity of the peak for the Co(OH)2 sample, which can be attributed to the synergistic effect of the GO sheets on the phase formation process of Co(OH)2 during electrodeposition. Also, the peaks located at 3420 cm−1 and 493 cm−1 can be attributed to the O–H stretching vibrations of water molecules and the ν(Co–O) stretching vibrations, respectively.32,37 The intensity of 3632 cm−1, 1090 cm−1, and 493 cm−1 peaks for the GC4 sample are much larger than those seen for the Co(OH)2 sample. In addition, two peaks located at 1090 cm−1 and 1570 cm−1 (marked with red arrows) in the spectrum of GC4 can be assigned to the deformation of the C–O band and the skeletal vibration of the bonded rGO sheets to Co(OH)2, respectively.50,59,60
O in carboxyl groups, C–OH, and C–O–C, respectively.8,53–56 Also, the spectra for the GC4 composite and Co(OH)2 alone are shown above the GO spectrum. In the spectra of the GC4 composite and Co(OH)2, the sharp and intense peak located at 3632 cm−1 can be related to the non-hydrogen bonded O–H groups and also indicate the full formation of the β-Co(OH)2 phase in both samples.57,58 As shown in Fig. 2(a), the intensity of the peak at 3632 cm−1, related to β-Co(OH)2, is much higher than the intensity of the peak for the Co(OH)2 sample, which can be attributed to the synergistic effect of the GO sheets on the phase formation process of Co(OH)2 during electrodeposition. Also, the peaks located at 3420 cm−1 and 493 cm−1 can be attributed to the O–H stretching vibrations of water molecules and the ν(Co–O) stretching vibrations, respectively.32,37 The intensity of 3632 cm−1, 1090 cm−1, and 493 cm−1 peaks for the GC4 sample are much larger than those seen for the Co(OH)2 sample. In addition, two peaks located at 1090 cm−1 and 1570 cm−1 (marked with red arrows) in the spectrum of GC4 can be assigned to the deformation of the C–O band and the skeletal vibration of the bonded rGO sheets to Co(OH)2, respectively.50,59,60
According to Fig. 2(b), by comparing the four FT-IR spectra of the composites (synthesized from different weight ratios of the initial components), it can be seen that the intensity of the peaks located at 1090 cm−1 and 1570 cm−1 (related to rGO) initially increases with the ratio of GO to CoCl2·6H2O up to 1![[thin space (1/6-em)]](https://www.rsc.org/images/entities/char_2009.gif) :
:![[thin space (1/6-em)]](https://www.rsc.org/images/entities/char_2009.gif) 4 (w/w) and then decreases. The observation of such behavior is probably due to the existence of maximum aggregation at the ratio of 1
4 (w/w) and then decreases. The observation of such behavior is probably due to the existence of maximum aggregation at the ratio of 1![[thin space (1/6-em)]](https://www.rsc.org/images/entities/char_2009.gif) :
:![[thin space (1/6-em)]](https://www.rsc.org/images/entities/char_2009.gif) 4 (w/w) via electrostatic interactions between cobalt ions and graphene oxide in the as-prepared electrodeposition electrolyte.
4 (w/w) via electrostatic interactions between cobalt ions and graphene oxide in the as-prepared electrodeposition electrolyte.
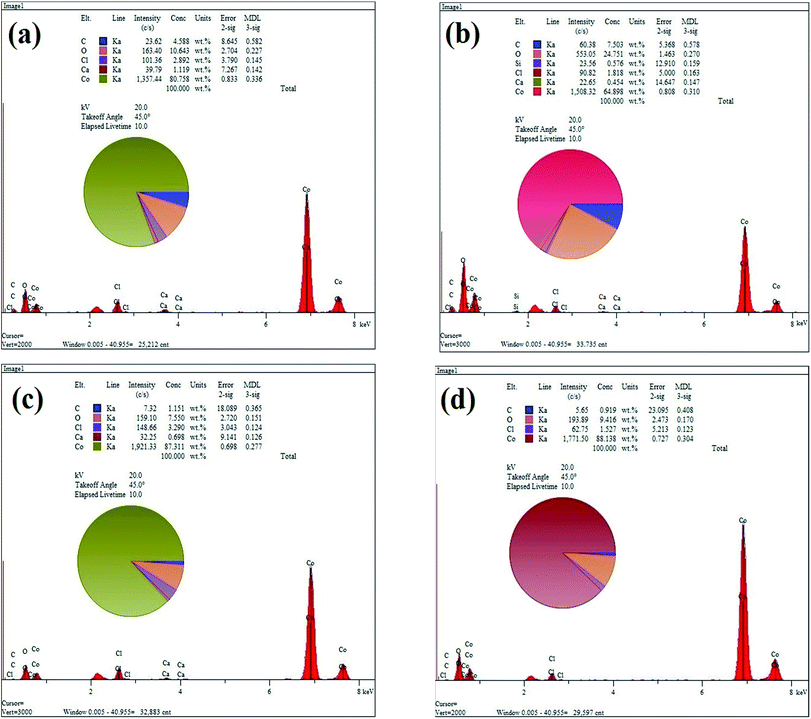
Fig. 3(a)–(d) show the EDS elemental analysis of GC2, GC4, GC8 and GC20 composites, respectively. The elemental analysis indicates that the carbon content (C%) of the composites is in the following order: GC4 > GC2 > GC8 > GC20. Among these composites, as a result of hybridization of GO with Co(OH)2 during the electrodeposition, C% in the GC4 composite is 7.5. This result is in good agreement with the obtained data from the FT-IR spectra (see Fig. 2(b)).
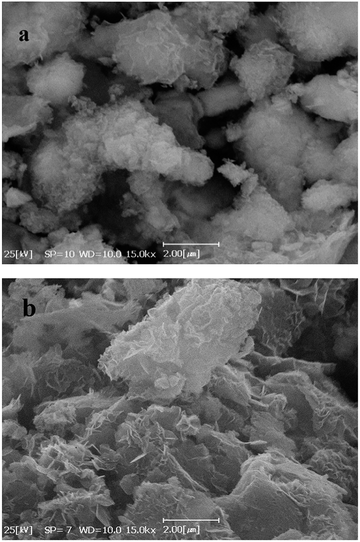
Fig. 4(a) and (b) show SEM images of Co(OH)2 and GC4 composite, respectively. On comparison, Co(OH)2 exhibits sponge-like structure with some layers that had not been properly completed to form perfect interweave coats, while the GC4 composite displays an intertwined structure with distinct nanostructure sheets. The latter structure shows a well-porous structure that could ideally have more capability to preserve charge.
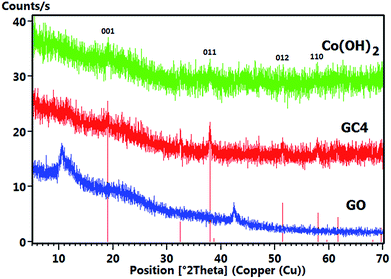
Fig. 5 shows the comparative XRD patterns of GO, GC4 and Co(OH)2. For GO, distinct broad peak at 2θ = 10.48° corresponds to diffraction of the (001) plane of the graphene oxide structure with interlayer spacing of 0.84 nm, indicating the somewhat high oxidation degree of graphite.48
The XRD pattern of GC4 shows peaks at 2θ = 19.11°, 32.56°, 38.03°, 38.78°, 51.51°, 58.10°, 59.74°, 61.75°, 68.20° and 69.71°, which can be respectively indexed as (001), (010), (011), (002), (012), (110), (003), (111), (020) and (103) distinct diffractions of brucite-like β-cobalt hydroxide (ref. code no. 96-101-0268) with hexagonal cell (a, b = 3.18 + 0.01 Å, c = 4.68 + 0.02 Å).57,58,61 By comparing XRD patterns of GC4 and Co(OH)2, it can be seen that the pattern of Co(OH)2 is similar to that of GC4, particularly at (001), (011), (012) and (110) diffractions, but with lower intensity. This can be attributed to the formation of a less crystalline structure of Co(OH)2 during electrodeposition in the presence of only Co2+ ions and the presence of GO sheets during electrodeposition of GC4, which probably induced better crystalline structure of the composite. The crystallography results from XRD were also confirmed by morphology observations from SEM and by the FT-IR spectra for the chemical bonding (see Fig. 2(a) and 4).
Electrochemical study
For the investigation of the electrochemical performance of the electrodeposited materials (as supercapacitors), the as-prepared samples were examined by CV, EIS, and GCD techniques. Fig. 6(a) shows the recorded CVs in the potential range of −0.3 to 0.5 V for the curves of GC4, Co(OH)2, and the bare Ni foam at a scan rate of 50 mV s−1. As shown in the figure, in case of the bare Ni foam, there was no noticeable peak current. According to the CV curves for the GC4 and Co(OH)2 electrodes, a pair of redox peaks for both electrode materials in the KOH electrolyte is observed. The reactions are as follows:20,24| Co(OH)2 + OH− ↔ CoOOH + H2O + e− | (6) |
| CoOOH + OH− ↔ CoO2 + H2O + e− | (7) |
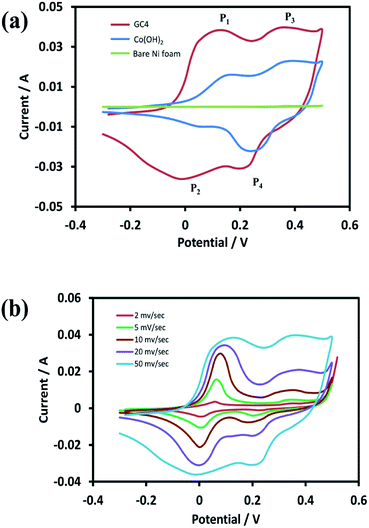 | ||
| Fig. 6 (a) CV curves of GC4 hybrid electrode, Co(OH)2 electrode and bare Ni foam at scan rate of 50 mV s−1 and (b) CV curves of GC4 at different scan rates in the potential range of −0.3 to 0.5 V. | ||
The electrode reactions during the charging process are related to the oxidation of Co(OH)2 to CoOOH with the P1 peak potential, followed by the oxidation of CoOOH to CoO2 with the P3 peak potential. During the discharge process, the reactions correspond to reduction of CoO2 to CoOOH and then the reduction to Co(OH)2, with the P4 and P2 peak potentials, respectively.
Taking into account the CV curves data, first, the CV curve profiles of both electrodes exhibit well-defined redox peaks, confirming the faradic nature of the materials. Also, a characteristic of the pseudocapacitive effect can be differentiated from electrical double-layer capacitors, i.e., a typical rectangular shape.62 Second, the redox pair peaks are more distinct in the GC4 and appear to have a relatively equal share of total faradic current rather than that seen in case of Co(OH)2. This can be attributed to the presence of graphene in the composite structure that has a synergistic interaction with Co(OH)2 and hence, it can improve the appearance of the P1/P2 redox pair peaks.
Fig. 6(b) represents the CV curves of GC4 at different scan rates (2, 5, 10, 20, and 50 mV s−1). As seen in the curves, the shapes of the CVs changed with scan rate, which is clearly distinct from that of electrochemical double-layer capacitance that has a rectangular shape. This again confirms the pseudocapacitance behavior for the GC4 composite, in which the charge storage is based on faradic redox reactions (eqn (6) and (7)).23,40 Furthermore, the peak current of anodic oxidations is almost equal to that of cathodic reductions. This could be interpreted as good charge–discharge reversibility for the GC4 composite.
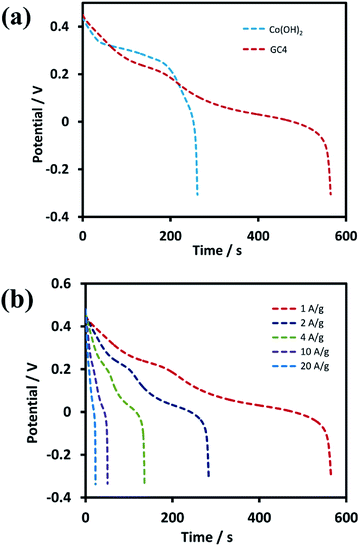
Further investigations were performed on GC4 and Co(OH)2 samples from the GCD experiments. Fig. 7(a) shows the discharge profiles of the as-prepared GC4 and Co(OH)2 electrodes within the potential range of −0.3 to 0.5 V at the current density of 1 A g−1. The nonlinear shape of the discharge profiles for both samples show pseudocapacitive behavior. The results are also in good agreement with their CV data.62 The appearance of two distinct potential plateaus (corresponding to two-steps of reduction of CoO2 to Co(OH)2) for GC4 in comparison with Co(OH)2 implies that the presence of rGO in the hybrid electrode probably causes an increase in the reversibility of the two redox reactions via intensifying the bulk conductivity of the composite and facilitating ion diffusion of the electrolyte into the surface of the electrode, which induces the synergistic effect of cobalt hydroxide. Therefore, a boosted supercapacitive performance for the GC4 hybrid material is observed.
Specific capacitances (Cs) of electrodes were measured to be 734 and 352 F g−1 at the current density of 1 A g−1 for the GC4 and Co(OH)2, respectively. The calculation of specific capacitances of electrodes was carried out based on the following equation:21
 | (8) |
Discharge curves of GC4 hybrid material at different current densities from 1 to 20 A g−1 are shown in Fig. 7(b). The Cs values of GC4, according to eqn (8), were calculated to be 734, 728, 710, 669 and 570 F g−1 at current densities of 1, 2, 4, 10, and 20 A g−1, respectively, while the calculated Cs values of Co(OH)2 are 352, 340, 305, 261 and 158 F g−1 at current densities of 1, 2, 4, 10 and 20 A g−1, respectively. At both electrodes, at high current densities, the Cs values decreased due to the minimum time for the active material to respond and less access of surface active sites to charge storage due to the blocking effect of the OH− ions diffusion process.34,63 The Cs values show that at the current density of 20 A g−1, the rate capability for GC4 and Co(OH)2 is as high as ∼78% and ∼55%, respectively. The better rate capability for the GC4 over Co(OH)2 implies that the presence of rGO in the composite network provides better diffusion rate of the OH− ions to the surface of electroactive materials even at high current density.
In addition, the energy density (E) and power density (P) for both Co(OH)2 and GC4 electrodes materials were calculated according to eqn (9) and (10).19,64
 | (9) |
 | (10) |
The calculated average values for the energy density and power density at different current densities (1, 2, 4, 10 and 20 A g−1) for GC4 were 60.6 W h kg−1 and 3208 W kg−1, respectively. The calculated E and P quantities for Co(OH)2 were 25.5 W h kg−1 and 2575 W kg−1, respectively. Again, these values confirm the improvement in supercapacitive performance of the GC4 composite electrode as compared to that of Co(OH)2 due to the rGO insertion into the composite.
EIS measurements, as a principal method to evaluate the basic behavior of supercapacitor materials, were conducted in 2 M KOH solution. Fig. 8 shows the Nyquist plots for both electrodes over the frequency range from 100 kHz to 0.01 Hz at 0.1 V. The impedance spectra of both electrode materials are almost similar, and consist of a semicircle at the high frequency region and a post-semicircle straight line at the low frequency region.
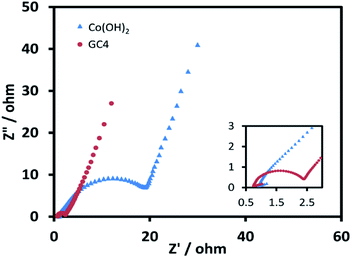 | ||
| Fig. 8 Nyquist plots for GC4 and Co(OH)2 electrodes over the frequency range from 100 kHz to 0.1 Hz at 0.1 V. | ||
The solution resistance (Rs) can be derived from the intercept of the plot on the real impedance axis. The calculated Rs value for GC4 is 0.74 Ω, which is smaller than that of Co(OH)2 (0.85 Ω) and implies that GC4 has good conductivity. In the high frequency region, the diameter of the semicircle represents the charge transfer resistance (Rct) corresponding to the faradic redox reaction of electrode materials, involving the exchange of OH− ions. The calculated quantity of Rct for GC4 is 0.82 Ω is much smaller than that of Co(OH)2 (9.2 Ω), hinting that the bulk conductivity and response rate of charge transfer in the composite are very favorable. Therefore, GC4 can be considered to be used as an ideal supercapacitive electrode material.34,63 The post-semicircle straight line in the low frequency region is known as Warburg resistance, which occurs due to diffusion and transport of the OH− ions in the electrolyte to the electrode surface.36 In this region, a line with higher slope than 45° represents lower diffusion resistance to ions.62 As shown in Fig. 8, the linear slope for both GC4 and Co(OH)2 is apparently greater than 45°, suggesting that diffusion resistance is not the determining factor and hence, both electrodes can store charge effectively.18,36
Good cycle life is a crucial parameter for supercapacitor electrode materials. Fig. 9(a) and (b) represent the 10 last charge–discharge cycles of the composite and Co(OH)2 at a current density of 1 A g−1, respectively. Fig. 9(c) displays the comparison between the capacitance retention of the two electrode materials over 1000 cycles, estimated from the GCD test conducted at the current density of 1 A g−1.
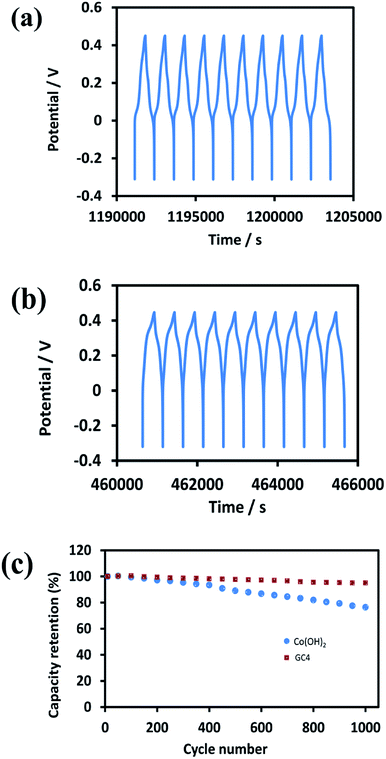 | ||
| Fig. 9 The 10 last cycles of (a) GC4 hybrid electrode (b) Co(OH)2 electrode and (c) the cycle stability of two electrode material at current density of 1 A g−1 for 1000 cycles. | ||
The calculated capacitance retention for GC4 was 95% after 1000 cycles of charge–discharge, while this quantity for pure Co(OH)2 was 76%, demonstrating that the GC4 has a long cycling stability and a high degree of charge–discharge reversibility. The improved capacitive performance for GC4 over pure Co(OH)2 could be attributed to the intertwined structure of the composite that resulted in more flexibility of the nanostructure sheets of the composite during charge–discharge cycles.
Conclusions
Co(OH)2-rGO hybrid materials were prepared by a one-step cathodic electrodeposition method. Results showed that the 1![[thin space (1/6-em)]](https://www.rsc.org/images/entities/char_2009.gif) :
:![[thin space (1/6-em)]](https://www.rsc.org/images/entities/char_2009.gif) 4 (w/w) ratio of GO
4 (w/w) ratio of GO![[thin space (1/6-em)]](https://www.rsc.org/images/entities/char_2009.gif) :
:![[thin space (1/6-em)]](https://www.rsc.org/images/entities/char_2009.gif) Co salt was optimum for the electrodeposition of the composite (i.e. GC4) with the most effective structure. The GC4 composite exhibited a specific capacitance of 734 F g−1 at a current density of 1 A g−1, a rate capability of ∼78% at a current density of 20 A g−1, and a cycling stability of 95% after 1000 cycles of charge–discharge. Also, this composite demonstrated the average energy and power density of 60.6 W h kg−1 and 3208 W kg−1, respectively. Results exhibited that the boosted supercapacitive performance for the GC4 as compared to that of other composites may be attributed to the synergistic effect between Co(OH)2 nanostructure and rGO sheets and the intertwined structure of this composite. Briefly, these results indicate that this study offers an opportunity for rapid and environmentally friendly preparation route of the metal oxide/hydroxide-rGO composites.
Co salt was optimum for the electrodeposition of the composite (i.e. GC4) with the most effective structure. The GC4 composite exhibited a specific capacitance of 734 F g−1 at a current density of 1 A g−1, a rate capability of ∼78% at a current density of 20 A g−1, and a cycling stability of 95% after 1000 cycles of charge–discharge. Also, this composite demonstrated the average energy and power density of 60.6 W h kg−1 and 3208 W kg−1, respectively. Results exhibited that the boosted supercapacitive performance for the GC4 as compared to that of other composites may be attributed to the synergistic effect between Co(OH)2 nanostructure and rGO sheets and the intertwined structure of this composite. Briefly, these results indicate that this study offers an opportunity for rapid and environmentally friendly preparation route of the metal oxide/hydroxide-rGO composites.
Furthermore, we can predict that this procedure can also be used to prepare similar composites by using supportive reagents in an electrodeposition solution for more rGO insertion into the hybrid matrix, and thus realize the more possible improvement in the supercapacitive properties of the composite.
Conflicts of interest
There are no conflicts to declare.Acknowledgements
This study was supported by grants (NO. 3463764-232) from the research council of the University of Tehran which is hereby gratefully acknowledged.Notes and references
- N. S. Choi, Z. Chen, S. A. Freunberger, X. Ji, Y. K. Sun, K. Amine, G. Yushin, L. F. Nazar, J. Cho and P. G. Bruce, Angew. Chem., Int. Ed., 2012, 51, 9994–10024 CrossRef PubMed.
- M. S. Islam and C. A. Fisher, Chem. Soc. Rev., 2014, 43, 185–204 RSC.
- P. Simon and Y. Gogotsi, Nat. Mater., 2008, 7, 845–854 CrossRef PubMed.
- P. Simon, Y. Gogotsi and B. Dunn, Science, 2014, 343, 1210–1211 CrossRef PubMed.
- M. Winter and R. J. Brodd, Chem. Rev., 2004, 104, 4245–4270 CrossRef PubMed.
- Y. S. Yun, M. E. Lee, M. J. Joo and H.-J. Jin, J. Power Sources, 2014, 246, 540–547 CrossRef.
- V. Subramanian, H. Zhu, R. Vajtai, P. Ajayan and B. Wei, J. Phys. Chem. B, 2005, 109, 20207–20214 CrossRef PubMed.
- Z. Jinhua, C. Ningna, G. You, Z. Hongli, F. Xiaomiao, L. Ruiqing, M. Yanwen, W. Lianhui and H. Wenhua, Sci. China Mater., 2018, 61, 243 CrossRef.
- J. Yan, Q. Wang, T. Wei and Z. Fan, Adv. Energy Mater., 2014, 4, 1300816 CrossRef.
- F. Huang and D. Chen, Energy Environ. Sci., 2012, 5, 5833–5841 RSC.
- S. W. Lee, J. Kim, S. Chen, P. T. Hammond and Y. Shao-Horn, ACS Nano, 2010, 4, 3889–3896 CrossRef PubMed.
- Y. Wang, Y. Song and Y. Xia, Chem. Soc. Rev., 2016, 45, 5925–5950 RSC.
- J.-K. Chang, C.-M. Wu and I.-W. Sun, J. Mater. Chem., 2010, 20, 3729–3735 RSC.
- U. M. Patil, M. S. Nam, J. S. Sohn, S. B. Kulkarni, R. Shin, S. Kang, S. Lee, J. H. Kim and S. C. Jun, J. Mater. Chem. A, 2014, 2, 19075–19083 RSC.
- X. Xia, J. Tu, Y. Zhang, Y. Mai, X. Wang, C. Gu and X. Zhao, J. Phys. Chem. C, 2011, 115, 22662–22668 CrossRef.
- Z.-A. Hu, Y.-L. Xie, Y.-X. Wang, L.-J. Xie, G.-R. Fu, X.-Q. Jin, Z.-Y. Zhang, Y.-Y. Yang and H.-Y. Wu, J. Phys. Chem. C, 2009, 113, 12502–12508 CrossRef.
- C. Yuan, X. Zhang, L. Hou, L. Shen, D. Li, F. Zhang, C. Fan and J. Li, J. Mater. Chem., 2010, 20, 10809–10816 RSC.
- M. Aghazadeh, A.-A. M. Barmi and T. Yousefi, J. Iran. Chem. Soc., 2012, 9, 225–229 CrossRef.
- M. Aghazadeh, S. Dalvand and M. Hosseinifard, Ceram. Int., 2014, 40, 3485–3493 CrossRef.
- M. Aghazadeh, M. R. Ganjali and M. G. Maragheh, Int. J. Electrochem. Sci., 2017, 12, 5792–5803 CrossRef.
- M. Aghazadeh, A. Rashidi and M. R. Ganjali, Electron. Mater. Lett., 2017, 1–9 Search PubMed.
- S. Bae, J.-H. Cha, J. H. Lee and D.-Y. Jung, Dalton Trans., 2015, 44, 16119–16126 RSC.
- X. Cai, S. H. Lim, C. K. Poh, L. Lai, J. Lin and Z. Shen, J. Power Sources, 2015, 275, 298–304 CrossRef.
- K. K. Lee, W. S. Chin and C. H. Sow, J. Mater. Chem. A, 2014, 2, 17212–17248 RSC.
- G. Nagaraju, Y. H. Ko and J. S. Yu, CrystEngComm, 2014, 16, 11027–11034 RSC.
- T. Zhao, H. Jiang and J. Ma, J. Power Sources, 2011, 196, 860–864 CrossRef.
- M. D. Stoller, S. Park, Y. Zhu, J. An and R. S. Ruoff, Nano Lett., 2008, 8, 3498–3502 CrossRef PubMed.
- E. Yoo and H. Zhou, ACS Nano, 2011, 5, 3020–3026 CrossRef PubMed.
- J. P. Cheng, L. Liu, K. Y. Ma, X. Wang, Q. Q. Li, J. S. Wu and F. Liu, J. Colloid Interface Sci., 2017, 486, 344–350 CrossRef PubMed.
- Q. Cheng, J. Tang, N. Shinya and L.-C. Qin, Sci. Technol. Adv. Mater., 2014, 15, 014206 CrossRef PubMed.
- U. Patil, S. C. Lee, J. Sohn, S. Kulkarni, K. Gurav, J. Kim, J. H. Kim, S. Lee and S. C. Jun, Electrochim. Acta, 2014, 129, 334–342 CrossRef.
- S. Chen, J. Zhu and X. Wang, J. Phys. Chem. C, 2010, 114, 11829–11834 CrossRef.
- G. Du, P. Liu, X. Yang, J. Zhang, X. Wang and X. Sun, RSC Adv., 2015, 5, 38324–38329 RSC.
- D. Ghosh, S. Giri and C. K. Das, ACS Sustainable Chem. Eng., 2013, 1, 1135–1142 CrossRef.
- Q. Huang, J. Wang, F. Liu, X. Chang, H. Chen, H. Lin and S. Han, RSC Adv., 2016, 6, 16745–16750 RSC.
- G. H. Jeong, H.-M. Lee, H. Lee, C.-K. Kim, Y. Piao, J.-H. Lee, J.-H. Kim and S.-W. Kim, RSC Adv., 2014, 4, 51619–51623 RSC.
- Z. Li, J. Wang, L. Niu, J. Sun, P. Gong, W. Hong, L. Ma and S. Yang, J. Power Sources, 2014, 245, 224–231 CrossRef.
- B. Rezaei, A. R. T. Jahromi and A. A. Ensafi, Int. J. Hydrogen Energy, 2017, 42, 16538–16546 CrossRef.
- C.-Y. Sun, Y.-G. Zhu, T.-J. Zhu, J. Xie, G.-S. Cao and X.-B. Zhao, J. Solid State Electrochem., 2013, 17, 1159–1165 CrossRef.
- H. Xie, S. Tang, Z. Gong, S. Vongehr, F. Fang, M. Li and X. Meng, RSC Adv., 2014, 4, 61753–61758 RSC.
- T. Yin, W. Zhang, Y. Yin, Y. Yan, K. Zhan, J. Yang and B. Zhao, J. Mater. Sci.: Mater. Electron., 2017, 28, 7884–7891 CrossRef.
- C. Zhao, X. Wang, S. Wang, Y. Wang, Y. Zhao and W. Zheng, Int. J. Hydrogen Energy, 2012, 37, 11846–11852 CrossRef.
- C. Zhao, W. Zheng, X. Wang, H. Zhang, X. Cui and H. Wang, Sci. Rep., 2013, 3, 2986 CrossRef PubMed.
- E. M. Jin, H. J. Lee, H.-B. Jun and S. M. Jeong, Korean J. Chem. Eng., 2017, 34, 885–891 CrossRef.
- C. Liang, L. Chen, D. Wu, C. Zhang, S. Xu, Y. Zhu, D. Xiong, P. Yang, L. Wang and P. K. Chu, Mater. Lett., 2016, 172, 40–43 CrossRef.
- H. Zhang, X. Zhang, D. Zhang, X. Sun, H. Lin, C. Wang and Y. Ma, J. Phys. Chem. B, 2012, 117, 1616–1627 CrossRef PubMed.
- S. Majid, Sci. Rep., 2015, 5, 16195 CrossRef PubMed.
- D. C. Marcano, D. V. Kosynkin, J. M. Berlin, A. Sinitskii, Z. Sun, A. Slesarev, L. B. Alemany, W. Lu and J. M. Tour, ACS Nano, 2010, 4, 4806–4814 CrossRef PubMed.
- J. R. Brownson and C. Lévy-Clément, Phys. Status Solidi B, 2008, 245, 1785–1791 CrossRef.
- M. Aghazadeh and S. Dalvand, J. Electrochem. Soc., 2014, 161, D18–D25 CrossRef.
- D. Chen, L. Tang and J. Li, Chem. Soc. Rev., 2010, 39, 3157–3180 RSC.
- D. Li, M. B. Mueller, S. Gilje, R. B. Kaner and G. G. Wallace, Nat. Nanotechnol., 2008, 3, 101–105 CrossRef PubMed.
- A. B. Bourlinos, D. Gournis, D. Petridis, T. Szabó, A. Szeri and I. Dékány, Langmuir, 2003, 19, 6050–6055 CrossRef.
- C. Nethravathi, T. Nisha, N. Ravishankar, C. Shivakumara and M. Rajamathi, Carbon, 2009, 47, 2054–2059 CrossRef.
- H. Tong, J. Zhu, J. Chen, Y. Han, S. Yang, B. Ding and X. Zhang, J. Solid State Electrochem., 2013, 17, 2857–2863 CrossRef.
- X. Feng, N. Chen, J. Zhou, Y. Li, Z. Huang, L. Zhang, Y. Ma, L. Wang and X. Yan, New J. Chem., 2015, 39, 2261–2268 RSC.
- Z. Liu, R. Ma, M. Osada, K. Takada and T. Sasaki, J. Am. Chem. Soc., 2005, 127, 13869–13874 CrossRef PubMed.
- R. Jayashree and P. V. Kamath, J. Mater. Chem., 1999, 9, 961–963 RSC.
- F. Liu, S. Ye, H. Guo, M. Zhai and J. Qian, J. Supercond. Novel Magn., 2014, 27, 787–791 CrossRef.
- C. Nethravathi and M. Rajamathi, Carbon, 2008, 46, 1994–1998 CrossRef.
- R. R. Salunkhe, B. P. Bastakoti, C. T. Hsu, N. Suzuki, J. H. Kim, S. X. Dou, C. C. Hu and Y. Yamauchi, Chem.–Eur. J., 2014, 20, 3084–3088 CrossRef PubMed.
- X. Guo, X. Li, Z. Xiong, C. Lai, Y. Li, X. Huang, H. Bao, Y. Yin, Y. Zhu and D. Zhang, J. Nanopart. Res., 2016, 18, 1–12 CrossRef.
- S. Vijayakumar, A. K. Ponnalagi, S. Nagamuthu and G. Muralidharan, Electrochim. Acta, 2013, 106, 500–505 CrossRef.
- H. Li, J. Song, L. Wang, X. Feng, R. Liu, W. Zeng, Z. Huang, Y. Ma and L. Wang, Nanoscale, 2017, 9, 193–200 RSC.
| This journal is © The Royal Society of Chemistry 2018 |

