 Open Access Article
Facile preparation of rGO/MFe2O4 (M = Cu, Co, Ni) nanohybrids and its catalytic performance during the thermal decomposition of ammonium perchlorate
Weiran Wang and
Dongxiang Zhang*
College of Chemistry and Chemical Engineering, Beijing Institute of Technology, Beijing 100081, P. R. China. E-mail: boris@bit.edu.cn; Fax: +86-10-68941331; Tel: +86-10-68914503
First published on 17th September 2018
Abstract
Reduced graphene oxide/metal ferrite (rGO/MFe2O4, M = Cu, Co, Ni) nanohybrids are successfully prepared through a simple, one-step hydrothermal method. The rGO/MFe2O4 nanohybrids are characterized by XRD, TEM, FT-IR, XPS, Raman and BET surface area measurements. The rGO/MFe2O4 nanohybrids demonstrate amazing catalytic activities on the thermal decomposition of ammonium perchlorate (AP). DSC results indicate that rGO/MFe2O4 nanohybrids (3 wt%), could decrease the decomposition temperature of pure AP from 424.7 °C to 329.1 °C, 338.3 °C, and 364.8 °C, respectively. This enhanced catalytic performance is mainly attributed to the synergistic effect of NPs and rGO. The activation energy (Ea) of AP mixed with nanohybrids is investigated by two isoconversion methods, Flynne–Walle–Ozawa (FWO) and Kissinger–Akahira–Sunose (KAS), on a conversion degree (α) range from 0.05 to 0.95. The values of Ea calculated from the above two methods matched with each other. A strong dependence of Ea on α is observed, indicating a complex decomposition process.
1. Introduction
Ammonium perchlorate (AP) is the most common energetic oxidant in composite solid propellants (CSPs). The thermal decomposition characteristics of AP directly influence the burning behavior of CSPs.1,2 Extensive studies reveal the catalytic activity of transition metals oxides which can significantly improve the performance of the decomposition of AP.3–9 Among the numerous varieties of transition metals oxides, spinel oxides (nanoferrites) due to their size, surface site and abundance of cations, for co-ordination sites, can increase activity of chemical reactivity10 and are widely applied in the fields of electronics, catalysis, adsorbents, etc. Previous studies have suggested that the increase of specific surface area of a catalyst would dramatically enhance its catalytic performance on thermal decomposition of AP.11,12 However, nanoparticles (NPs) are likely to aggregate due to their large surface energy, which will lead to the decrease of specific surface area and further influence their catalytic performance in the decomposition process.Enormous attention has been attracted on graphene due to its excellent special surface properties, high conductivity and thermal stability.13,14 It has been proved that the two-dimensional structure of graphene sheets allows them to be the perfect dispersing-substrate for the NPs and acts as efficient solid conductive supporters for enabling good contact between nanoferrites.15
Herein, we prepared rGO/MFe2O4 (M = Cu, Co, Ni) nanohybrids in a facile one-pot way. We demonstrated a comparative study about the catalytic activities of nanohybrids on thermal decomposition of AP. As far as we know, no study involving rGO/MFe2O4 nanohybrids as a series of catalysts for the decomposition of AP has been reported.
2. Experimental
2.1 Materials
Natural graphite powder was from Qingdao Graphite Factory. Potassium permanganate, sodium nitrate, concentrated sulfuric acid, hydrogen peroxide (30%), hydrochloric acid, sodium hydroxide anhydrous, ethanol, nitrates of Cu, Co, Ni and Fe were obtained from Beijing Chemical Reagent Co. Ltd. All reagents used are analytical grade.2.2 Synthesis of rGO/MFe2O4 (M = Cu, Co, Ni) nanohybrids
GO was obtained from graphite powder in a modified Hummers way.16 GO (72 mg) was added into deionized water (30 mL) with sonication. M(NO3)2·nH2O (M = Cu, Co, Ni) (1 mmol) and Fe(NO3)3·9H2O (2 mmol) was mixed into GO solution. The mixtures were added with NaOH solution until a pH value of 11–12 reached under magnetic stirring. The viscous precipitates were moved into a 100 mL Teflon lined stainless-steel autoclave, heated overnight at 180 °C. The precipitates were centrifuged, rinsed with DI water and ethanol. The products labeled as rGO/CuF, rGO/CoF, rGO/NiF with rGO content of 25 wt%, were put in oven at 60 °C. For comparison, same process was repeated to prepare pure CuF, CoF, NiF NPs and graphene.2.3 Characterization
X-ray powder diffraction (XRD) patterns of the nanohybrids were obtained using a Bruker D8-Advanced diffractometer. Transmission electron microscopy (TEM) and high-resolution (HRTEM) was measured on a JEOL, JEM-2100. The function groups were investigated by Fourier transform infrared spectra (FT-IR; Perkin Elmer). Raman spectra were investigated by a Raman spectrometer (Horiba JY HR-800). X-ray photoelectron spectroscopy (XPS) was characterized by a PHI Quantera system. Nitrogen adsorption/desorption isotherms were characterized by an BELSORP-max (ANKERSMID), Brunauer–Emmett–Teller (BET) method was used to calculate the specific surface area.The rGO/MFe2O4 (M = Cu, Co, Ni) nanohybrids, rGO and pure MF NPs were fully mixed with AP in the mass ratio of 1 wt%, 3 wt% and 5 wt%, respectively. The thermal properties of the above mixtures were investigated using a differential thermal analyzer (TGA-DSC, METTLER, 1/1600HT) with nitrogen gas (flow rate 50 mL min−1).
3. Results and discussion
3.1 Characterization
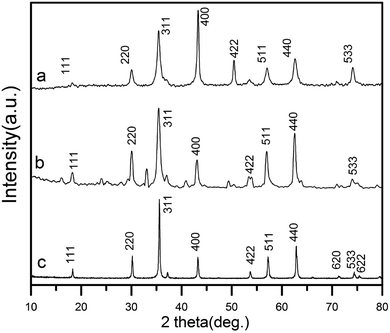
The XRD patterns of as-prepared rGO/CuF, rGO/CoF, rGO/NiF nanohybrids are displayed in Fig. 1. For CuFe2O4 (Fig. 1a), the peaks are at 2θ = 18.2°, 30.1°, 35.5°, 43.2°, 53.6°, 57.0°, 62.6°, 74.1°, which correspond to the crystal planes of (111), (220), (311), (400), (422), (511), (440), (533), respectively. The positions of all diffraction peaks (Fig. 1a–c) can be well assigned to standard structure of CuFe2O4, CoFe2O4, NiFe2O4 (JCPDS no. 77-0010, 22-1086 and 86-2267), respectively. The average crystallite size of rGO/CuF, rGO/CoF, rGO/NiF nanohybrids, calculated from the three most intense peaks of each patterns by Scherrer equation17 are 15.3, 12.6, and 9.8 nm, respectively.The morphology of the as-synthesised rGO/CuF, rGO/CoF, rGO/NiF nanohybrids and GO were characterized by TEM. As shown in Fig. 2a–c, MFe2O4 (M = Cu, Co, Ni) NPs are uniformly dispersed on rGO sheets. There are no NPs fell off the rGO sheets after long time sonication of the samples, indicating the strong interaction between NPs and rGO sheets. Fig. 2g shows a wrinkled waves-like textures of GO sheets. The HRTEM images of CuF, CoF, NiF NPs, presented in Fig. 2d–f, display a clear crystal lattice with a spacing of 0.25 nm, 0.31 nm, 0.31 nm, respectively, corresponding to (311), (111), (111) plane of MFe2O4 (M = Cu, Co, Ni) cubic structure.
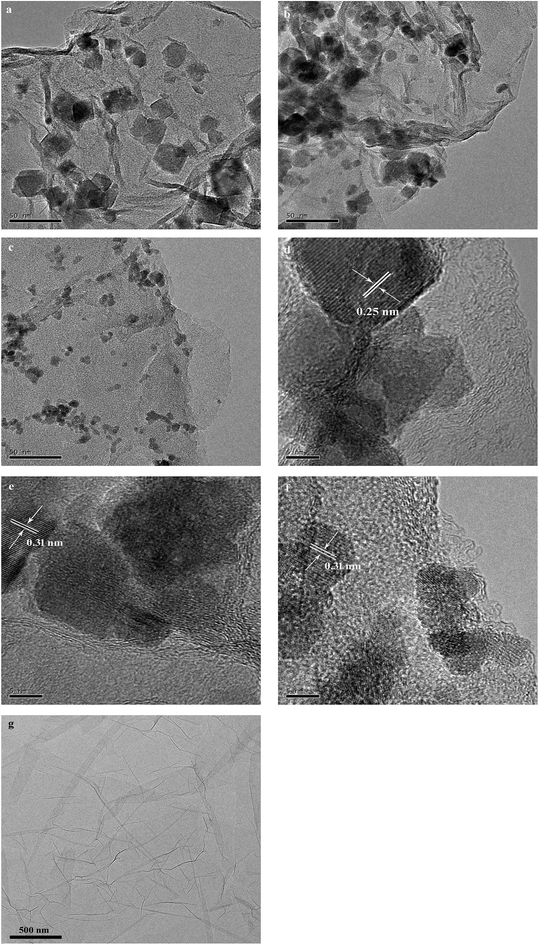 | ||
| Fig. 2 TEM images of (a) rGO/CuF, (b) rGO/CoF, (c) rGO/NiF nanohybrids and (g) GO; HRTEM images of (d) rGO/CuF, (e) rGO/CoF, (f) rGO/NiF nanohybrids. | ||
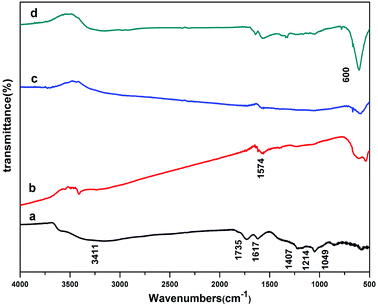
Fig. 3 represents FTIR spectra of GO and rGO/MFe2O4 (M = Cu, Co, Ni). For GO (Fig. 3a), the broad absorption at 3411 cm−1 is ascribed to O–H stretching mode. The other peaks are due to the stretching vibration of carboxylic C![[double bond, length as m-dash]](https://www.rsc.org/images/entities/char_e001.gif) O (1735 cm−1), aromatic C–C (1617 cm−1), C–OH (1407 cm−1), C–O–C (1214 cm−1) and alkoxy (1049 cm−1), respectively.18 For rGO/MFe2O4 (Fig. 3b–d), peak intensity of oxygen-containing groups decreased obviously or disappeared gradually indicating that GO has been successfully reduced to rGO.19 The peak at 1574 cm−1, is due to the skeletal vibration of rGO sheets. A new absorption at around 600 cm−1 is assigned to the metal oxygen bonds.
O (1735 cm−1), aromatic C–C (1617 cm−1), C–OH (1407 cm−1), C–O–C (1214 cm−1) and alkoxy (1049 cm−1), respectively.18 For rGO/MFe2O4 (Fig. 3b–d), peak intensity of oxygen-containing groups decreased obviously or disappeared gradually indicating that GO has been successfully reduced to rGO.19 The peak at 1574 cm−1, is due to the skeletal vibration of rGO sheets. A new absorption at around 600 cm−1 is assigned to the metal oxygen bonds.
Fig. 4 displays the XPS spectra of rGO/MFe2O4 (M = Cu, Co, Ni) nanohybrids and GO. Fig. 4a is clearly indicated that the C/O ratios in the rGO/MFe2O4 nanohybrids increase obviously compared with that of GO. In Fig. 4b, the peaks at around 723.0 and 710.6 eV corresponds to Fe2p1/2 and Fe2p3/2, respectively.20 In Fig. 4c–e, two peaks at 932.9 eV and 952.7 eV are assigned to Cu2p1/2 and Cu2p3/2, respectively.21 Two peaks at 779.2 eV and 880.8 eV is ascribed to the Co 2p3/2 and Co2p1/2, respectively.22 Two peaks at 855.0 and 872.7 eV corresponds to Ni2p3/2 and Ni2p1/2, respectively.23 In Fig. 4f, four peaks at 284.1, 286.3, 287.5, 288.7 eV assigned to aromatic C![[double bond, length as m-dash]](https://www.rsc.org/images/entities/char_e001.gif) C/C–C, C–OH, C
C/C–C, C–OH, C![[double bond, length as m-dash]](https://www.rsc.org/images/entities/char_e001.gif) O, O
O, O![[double bond, length as m-dash]](https://www.rsc.org/images/entities/char_e001.gif) C–O bonds, respectively.24 Fig. 4g–i show that peak intensities of the epoxide and hydroxyl functional groups are remarkably decreased, suggesting the successful reduction of GO.
C–O bonds, respectively.24 Fig. 4g–i show that peak intensities of the epoxide and hydroxyl functional groups are remarkably decreased, suggesting the successful reduction of GO.
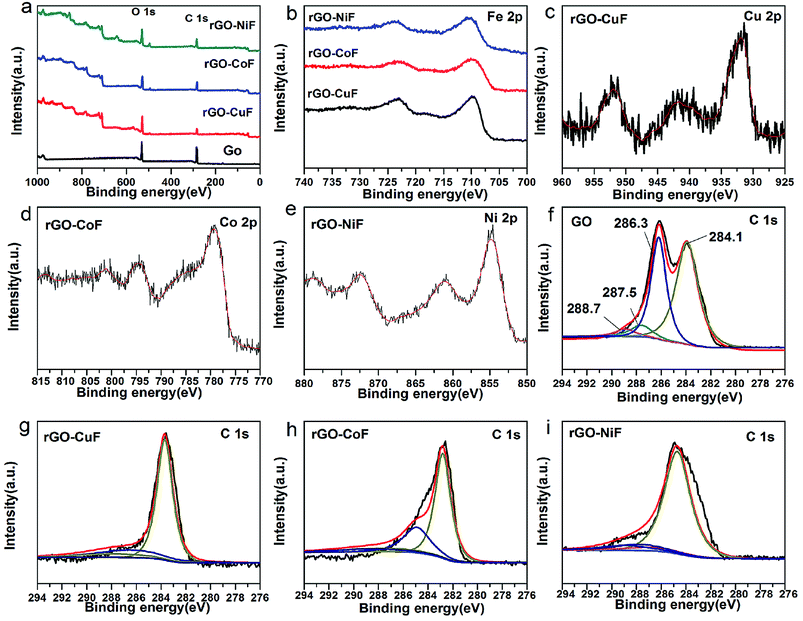 | ||
| Fig. 4 XPS spectra of the rGO/MFe2O4 (M = Cu, Co, Ni) nanohybrids and GO (a) survey, (b) Fe 2p, (c) Cu 2p, (d) Co 2p, (e) Ni 2p, (f) C 1s, (g) C 1s, (h) C 1s, (i) C 1s. | ||
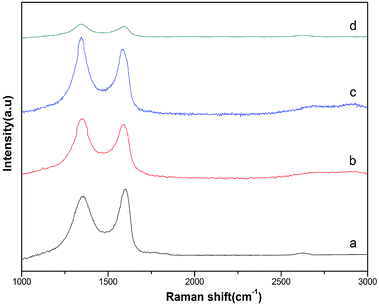
Fig. 5 displays Raman spectra of GO and rGO/MF (M = Cu, Co, Ni) nanohybrids. As can be seen in Fig. 5a, two peaks at around 1356 cm−1 and 1597 cm−1 corresponding to D and G band, respectively. In Fig. 5b and c, small shifting was seen in D and G bands suggesting oxygen-containing functional groups of GO are remarkably removed. The calculated intensity ratios of D and G band (ID/IG) of rGO/CuF, rGO/CoF, rGO/NiF and GO are 1.07, 1.09, 1.04, 0.90, respectively. The higher ID/IG values of rGO/MF nanohybrids suggest that GO sheets are successfully reduced.25
N2 adsorption/desorption isotherms tests are done to calculate specific surface area of pure NPs and rGO/MF (M = Cu, Co, Ni) nanohybrids. As shown in Table 1, the BET value of rGO/MF (M = Cu, Co, Ni) is much higher than that of pure NPs, indicating that rGO sheets improved the dispersion of the NPs, which may resulting its improved catalytic activity.
| Sample | BET surface area (m2 g−1) |
|---|---|
| rGO/CuF | 94.60 |
| rGO/CoF | 74.79 |
| rGO/NiF | 73.92 |
| CuF | 33.01 |
| CoF | 26.74 |
| NiF | 26.53 |
3.2 The catalytic effect of the rGO/MFe2O4 (M = Cu, Co, Ni) nanohybrids on the thermal decomposition of AP
To investigated the catalytic behaviors of the catalysts, TG-DSC curves were tested at a heating rate of 10 °C min−1. Fig. 6a shows DSC curves of pure AP. It indicates a three-stage decomposition process. In the first stage, peak centered at 247.4 °C, is in agreement with crystallographic transition from the orthorhombic to cubic form. In the second stage, peaks at 300.8 °C, shows low-temperature decomposition (LTD) and peaks at 424.7 °C shows high-temperature decomposition (HTD).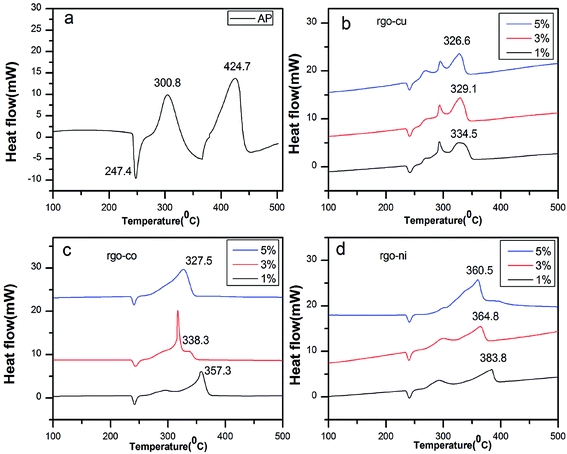 | ||
| Fig. 6 DSC curves of (a) pure AP, AP mixed with (b) rGO/CuF, (c) rGO/CoF, and (d) rGO/NiF (1 wt%, 3 wt%, 5 wt%) nanohybrids. | ||
However, Fig. 6b–d show the endothermic peak has no shifts, indicating that rGO/MFe2O4 nanohybrids have no impact on the endothermic process but obvious peak temperature decreasing is taken place in LTD and HTD process.
In Fig. 6b, LTD peak has no significant changes. As shown in Fig. 6c and d, only one exothermic peak (HTD peak) is obvious for 5 wt%, compared with two exothermic peaks for 1 wt% and 3 wt%. The HTD peak temperature of AP/rGO/MFe2O4 (M = Cu, Co, Ni) mixtures are reduced by 90.2 °C, 67.4 °C, 40.9 °C (1 wt%), 95.6 °C, 86.4 °C, 59.9 °C (3 wt%), 98.1 °C, 97.2 °C, 64.2 °C (5 wt%), respectively. Meanwhile, the released energy of the mixtures (3% wt) is 1523.5 J g−1, 1376.7 J g−1 and 1248.3 J g−1, increased remarkably compared to 598.3 J g−1 of pure AP. The rGO/MFe2O4 (M = Cu, Co, Ni) nanohybrids demonstrate excellent catalytic effects in decreasing the HTD temperature and increasing the energy release of AP. However, the rGO/CuF nanohybrids showed the best catalytic effects and the rGO/NiF nanohybrids the least. The thermal catalytic performance of catalysts on the decomposition of AP is content dependent. As seen from Fig. 6, increasing the mass ratio of rGO/MFe2O4 (M = Cu, Co, Ni) nanohybrids in mixtures can decrease HTD peak temperature and the catalytic performance of rGO/CuF shows less relative to amounts compared to that of rGO/CoF and rGO/NiF nanohybrids.
For comparison, TG-DSC tests were further conducted to study the catalytic activity of the as-prepared MF (M = Cu, Co, Ni) NPs and rGO sheets at a heating rate of 10 °C min−1. As can be seen in Table 2, rGO/MFe2O4 (M = Cu, Co, Ni) nanohybrids demonstrated better catalytic effect than that of pure NPs and rGO.
| Catalyst | ΔT (°C) |
|---|---|
| a T: decreased HTD peak temperature. | |
| CuFe2O4 | 71.5 |
| CoFe2O4 | 45.4 |
| NiFe2O4 | 38.2 |
| rGO | 0.9 |
| rGO/CuFe2O4 | 95.6 |
| rGO/CoFe2O4 | 86.4 |
| rGO/NiFe2O4 | 59.9 |
In Fig. 7a, there are two weight loss steps for pure AP, 23.1% of the first and 76.9% of the second. In Fig. 7b, two weight loss steps take place in all three mass ratio and the weight loss are almost the same, 35.5% of the first and 64.5% of the second. In contrast, Fig. 7c and d show that the weight loss of catalyst (5 wt%) is taken only in one step, which are consistent with their DSC results. Thus the mixtures (5 wt%) exhibit the best catalytic effects in decreasing the HTD temperature of AP compared to other mass ratio. However, for rGO/CuF, it is the most difficult to further decrease the HTD temperature of AP with addition of higher concentration.
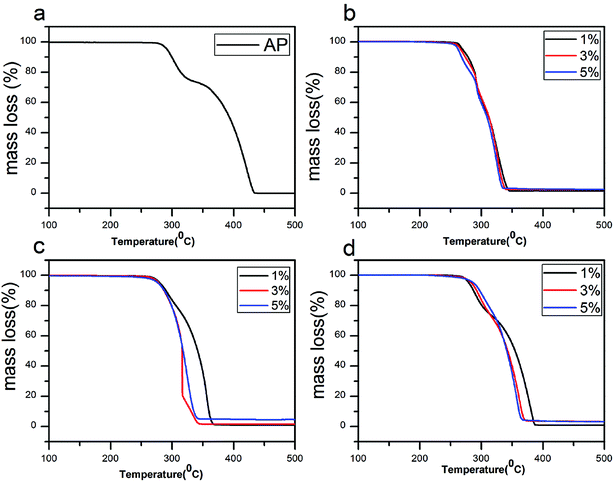 | ||
| Fig. 7 TG curves of (a) pure AP, AP mixed with (b) rGO/CuF, (c) rGO/CoF and (d) rGO/NiF (1 wt%, 3 wt%, 5 wt%) nanohybrids. | ||
3.3 Ea,α values of AP mixed with rGO/MFe2O4 nanohybrids by model-free methods
To Evaluate the Ea,α values of AP mixed with rGO/MFe2O4 (3 wt%.) nanohybrids in the HTD process, mixtures were performed at heating rates of 5, 10, 15 and 20 °C min−1.Two model-free methods, Flynn–Wall–Ozawa (FWO) and Kissinger–Akahira–Sunose (KAS) were applied for obtaining Ea,α values.26–33 The two methods allows the activation energy to be evaluated without making any assumptions about the reaction model. Therefore, for the first order reaction, extent of reaction conversion (α) is calculated using the following eqn (1):
 | (1) |
The m0 and mt are the mass of the sample at the starting and ending time; while m∞ is the mass at arbitrary time or temperature.
The FWO method shown in eqn (2) is:
 | (2) |
The KAS method shown in eqn (3) is:
 | (3) |
 versus 1000/Tα with rGO/MFe2O4 nanohybrids, respectively.
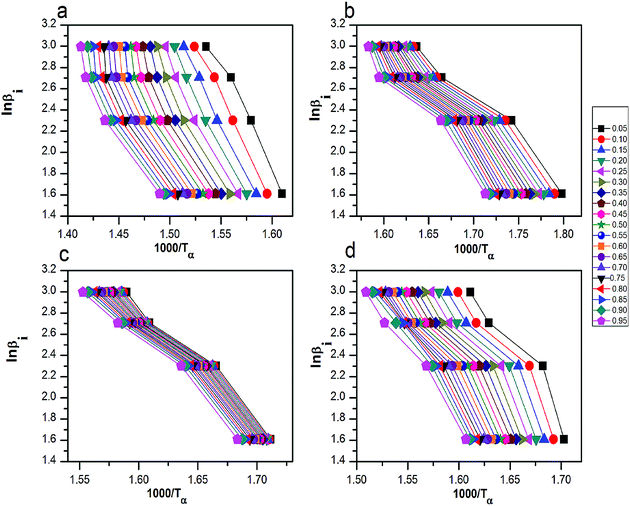 | ||
| Fig. 8 The curves of ln(βi) by 1000/Tα for thermal decomposition of (a) pure AP, AP mixed with (b) rGO/CuF, (c) rGO/CoF and (d) rGO/NiF (3 wt%) nanohybrids. | ||
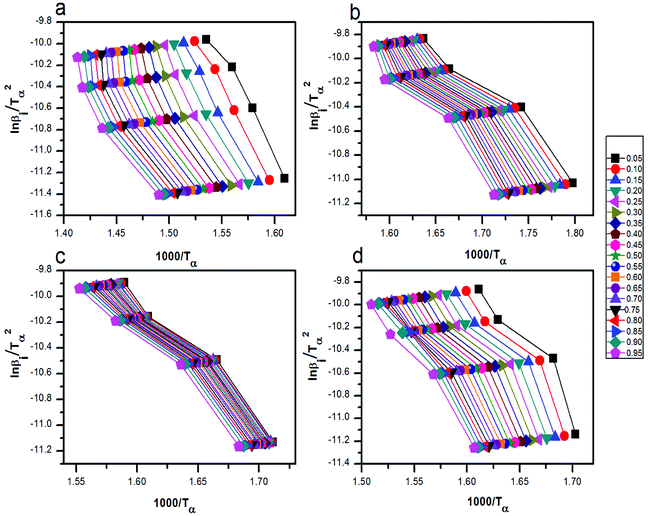 | ||
Fig. 9 The curves of  by 1000/Tα for thermal decomposition of (a) pure AP, AP mixed with (b) rGO/CuF, (c) rGO/CoF and (d) rGO/NiF (3 wt%) nanohybrids. by 1000/Tα for thermal decomposition of (a) pure AP, AP mixed with (b) rGO/CuF, (c) rGO/CoF and (d) rGO/NiF (3 wt%) nanohybrids. | ||
The relationship of Ea to extent of conversion are calculated by FWO and KAS methods in HTD process. The Ea values and its corresponding linear correlation coefficient (R2) for conversion values from 0.05 to 0.95, are shown in Tables 3 and 4. The dependence of Ea on α using FWO and KAS method is shown in Fig. 10, respectively. Since the Ea,α values of mixtures have increased, HTD process of AP is done harder and slower.
| α | AP | AP + rGO/CuF | AP + rGO/CoF | AP + rGO/NiF | ||||
|---|---|---|---|---|---|---|---|---|
| Ea,α | R2 | Ea,α | R2 | Ea,α | R2 | Ea,α | R2 | |
| 0.05 | 165.43 | 0.9696 | 70.29 | 0.9503 | 94.03 | 0.96339 | 116.43 | 0.8725 |
| 0.10 | 173.36 | 0.9924 | 72.14 | 0.9504 | 93.19 | 0.96468 | 115.84 | 0.8910 |
| 0.15 | 172.27 | 0.9965 | 73.70 | 0.9541 | 93.07 | 0.96687 | 115.63 | 0.9018 |
| 0.20 | 169.93 | 0.9905 | 74.58 | 0.9548 | 92.85 | 0.96735 | 115.52 | 0.9082 |
| 0.25 | 166.51 | 0.9790 | 75.54 | 0.9548 | 92.47 | 0.9683 | 115.74 | 0.9139 |
| 0.30 | 164.59 | 0.9668 | 76.19 | 0.9542 | 92.10 | 0.96921 | 116.19 | 0.9210 |
| 0.35 | 165.33 | 0.9585 | 77.03 | 0.9515 | 91.74 | 0.96797 | 116.12 | 0.9290 |
| 0.40 | 160.27 | 0.9501 | 77.78 | 0.9526 | 91.60 | 0.96761 | 116.65 | 0.9362 |
| 0.45 | 159.37 | 0.9427 | 79.05 | 0.9490 | 91.52 | 0.96962 | 116.76 | 0.9396 |
| 0.50 | 157.77 | 0.9308 | 79.58 | 0.9489 | 91.30 | 0.96995 | 117.19 | 0.9448 |
| 0.55 | 157.12 | 0.9270 | 80.32 | 0.9466 | 91.08 | 0.97026 | 118.24 | 0.9495 |
| 0.60 | 156.00 | 0.9281 | 81.07 | 0.9441 | 91.00 | 0.97008 | 118.23 | 0.9540 |
| 0.65 | 153.58 | 0.9225 | 81.93 | 0.9437 | 91.06 | 0.97147 | 119.19 | 0.9607 |
| 0.70 | 153.27 | 0.9219 | 82.57 | 0.9418 | 90.66 | 0.97029 | 120.85 | 0.9628 |
| 0.75 | 151.90 | 0.9165 | 83.45 | 0.9397 | 90.85 | 0.97112 | 123.23 | 0.9710 |
| 0.80 | 150.99 | 0.9251 | 83.87 | 0.9383 | 90.52 | 0.97035 | 125.31 | 0.9732 |
| 0.85 | 149.98 | 0.9184 | 84.10 | 0.9396 | 90.32 | 0.96907 | 126.96 | 0.9733 |
| 0.90 | 148.55 | 0.9259 | 84.53 | 0.9397 | 90.02 | 0.96887 | 125.21 | 0.9779 |
| 0.95 | 145.19 | 0.9299 | 84.55 | 0.9420 | 89.82 | 0.9679 | 119.40 | 0.9764 |
| α | AP | AP + rGO/CuF | AP + rGO/CoF | AP + rGO/NiF | ||||
|---|---|---|---|---|---|---|---|---|
| Ea,α | R2 | Ea,α | R2 | Ea,α | R2 | Ea,α | R2 | |
| 0.05 | 154.31 | 0.9649 | 60.10 | 0.9320 | 83.43 | 0.9534 | 105.87 | 0.8725 |
| 0.10 | 162.15 | 0.9913 | 61.91 | 0.9327 | 82.58 | 0.9549 | 105.21 | 0.8910 |
| 0.15 | 160.99 | 0.9961 | 63.44 | 0.9381 | 80.89 | 0.9535 | 104.94 | 0.9018 |
| 0.20 | 158.58 | 0.9892 | 64.30 | 0.9391 | 82.22 | 0.9582 | 104.78 | 0.9082 |
| 0.25 | 155.10 | 0.9760 | 65.23 | 0.9394 | 81.84 | 0.9593 | 104.94 | 0.9139 |
| 0.30 | 153.12 | 0.9620 | 65.85 | 0.9387 | 81.45 | 0.9604 | 105.35 | 0.9210 |
| 0.35 | 153.80 | 0.9524 | 66.67 | 0.9353 | 81.08 | 0.9588 | 105.24 | 0.9290 |
| 0.40 | 148.69 | 0.9426 | 67.40 | 0.9370 | 80.94 | 0.9583 | 105.73 | 0.9362 |
| 0.45 | 147.73 | 0.9340 | 68.64 | 0.9325 | 80.85 | 0.9608 | 105.81 | 0.9396 |
| 0.50 | 146.10 | 0.9201 | 69.15 | 0.9325 | 80.62 | 0.9612 | 106.20 | 0.9448 |
| 0.55 | 145.40 | 0.9156 | 69.87 | 0.9296 | 80.39 | 0.9616 | 107.22 | 0.9495 |
| 0.60 | 144.23 | 0.9168 | 70.59 | 0.9266 | 80.30 | 0.9613 | 107.18 | 0.9540 |
| 0.65 | 141.77 | 0.9091 | 71.43 | 0.9262 | 80.35 | 0.9631 | 108.11 | 0.9607 |
| 0.70 | 141.43 | 0.9093 | 72.06 | 0.9239 | 79.93 | 0.9615 | 109.76 | 0.9628 |
| 0.75 | 140.02 | 0.9029 | 72.91 | 0.9215 | 80.12 | 0.9625 | 112.11 | 0.9710 |
| 0.80 | 139.07 | 0.9128 | 73.31 | 0.9198 | 79.77 | 0.9615 | 114.17 | 0.9732 |
| 0.85 | 138.02 | 0.9048 | 73.52 | 0.9214 | 79.56 | 0.9598 | 115.80 | 0.9733 |
| 0.90 | 136.55 | 0.9134 | 73.93 | 0.9216 | 79.24 | 0.9594 | 114.02 | 0.9779 |
| 0.95 | 133.15 | 0.9177 | 73.92 | 0.9245 | 79.01 | 0.9581 | 108.17 | 0.9764 |
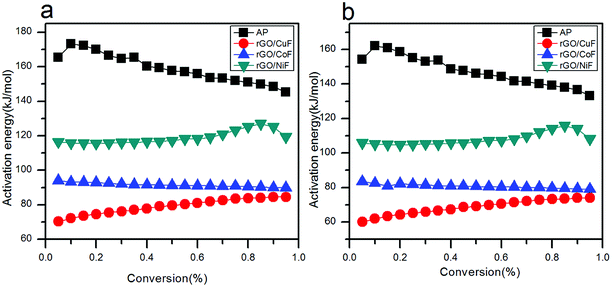 | ||
| Fig. 10 Dependence of Ea,α with α according to (a) FWO method, (b) KAS method for the decomposition of AP mixed with rGO/MFe2O4 nanohybrids. | ||
3.4 Catalytic mechanism
According to the previous researches,34 the first decomposition stage is solid–gas multiple reaction including decomposition and sublimation:| NH4ClO4 → NH4+ + ClO4− | (4) |
| MFe2O4 → MFe2O4 (h+ + e−) | (5) |
| Fe3+ + ClO4− → Fe2+ + ClO4 | (6) |
| Fe2+ + NH4+ → Fe3+ + NH4 | (7) |
| MFe2O4 (e−) + rGO → MFe2O4 + rGO (e−) | (8) |
Once the mixture of AP and rGO/MFe2O4 is heated, electrons in the valence band (VB) of MFe2O4 can jump to its conduction band (CB), meanwhile the generation of holes (h+) in the VB is coming. MFe2O4 provide easy access to transfer electrons from ClO4− to NH4+. Because rGO are known as good electron acceptors,35 the electrons are transferred to the rGO rapidly via a percolation mechanism. rGO/MFe2O4 were used as catalysts for the decomposition, which can prevent the electrons and holes of MFe2O4 recombining, and then boost the dissociation of ClO4−, thus leading to the enhanced catalytic effect.
4. Conclusion
rGO/MFe2O4 (M = Cu, Co, Ni) nanohybrids have been successfully prepared by a facile hydrothermal way to prevent the agglomeration of NPs. The CuF, CoF, NiF NPs are homogeneously dispersed on rGO sheets. DSC results indicate that the rGO/CuF, rGO/CoF, rGO/NiF nanohybrids (3 wt%), can decrease the HTD peak temperature of pure AP from 424.7 °C to 329.1 °C, 338.3 °C, 364.8 °C, respectively, and enhance catalytic performance with increasing amount. The two methods are used to estimate the values of Ea from TG tests without applying the model. Each activation energy has a separate value at different α. According to the FWO method, the Ea,α values (α = 0.45) of AP with rGO/CuF, rGO/CoF, rGO/NiF nanohybrids are reduced from 159.37 kJ mol−1 of pure AP to 79.05 kJ mol−1, 91.52 kJ mol−1, 116.76 kJ mol−1, respectively. As for the KAS method, the values are from 147.73 kJ mol−1 to 68.64 kJ mol−1, 80.85 kJ mol−1, 116.76 kJ mol−1, respectively. The enhanced catalytic activity, attributed to the synergistic effect of NPs and rGO, can make the rGO/MFe2O4 (M = Cu, Co, Ni) nanohybrids be promising catalysts in the AP-based propellants or energetic materials.Conflicts of interest
There are no conflicts to declare.Acknowledgements
This research was supported by the International Science & Technology Cooperation Program of China (2014DFR61080).References
- R. A. Isbell and M. Q. Brewster, Optical properties of energetic materials: RDX, HMX, AP, NC/NG, and HTPB, Propellants, Explos., Pyrotech., 1998, 23, 218–224 CrossRef
.
- D. M. Badujar, M. B. Talawar, S. N. Asthana and P. P. Mahulikar, Advances in Science and Technology of Modern Energetic Materials: an Overview, J. Hazard. Mater., 2008, 151, 289–305 CrossRef PubMed
.
- S. G. Hosseini, R. Ahmadi, A. Ghavi and A. Kash, Synthesis and characterization of α-Fe2O3 mesoporous using SBA-15 silica as template and investigation of its catalytic activity for thermal decomposition of ammonium perchlorate particles, Powder Technol., 2015, 278, 316 CrossRef
.
- X. L. Luo, Y. F. Han, D. S. Yang and Y. S. Chen, Solvo-thermal synthesis of Cu2O micro-spheres and their catalytic performance for thermal decomposition of ammonium perchlorate, Acta Phys.-Chim. Sin., 2012, 28, 297 Search PubMed
.
- A. A. Said and R. A. Qasmi, The role of copper cobaltite spinel, CuxCo3-xO4 during the thermal decomposition of ammonium perchlorate, Thermochim. Acta, 1996, 275, 83–91 CrossRef
.
- W. F. Chen, F. S. Li, J. X. Liu, H. C. Song and J. Y. Yu, Preparation of nanocrystalline Co3O4 and its catalytic performance for thermal decomposition of ammonium perchlorate, Chin. J. Catal., 2005, 26, 1073–1077 Search PubMed
.
- N. Li, M. H. Cao, Q. Y. Wu and C. W. Hu, A facile one-step method to produce Ni/graphene nanocomposites and their application to the thermal decomposition of ammonium perchlorate, CrystEngComm, 2012, 14, 428–434 RSC
.
- N. Li, Z. F. Geng, M. H. Cao, L. Ren, X. Y. Zhao, B. Liu, Y. Tian and C. W. Hu, Well-dispersed ultrafine Mn3O4 nanoparticles on graphene as a promising catalyst for the thermal decomposition of ammonium perchlorate, Carbon, 2013, 54, 124–132 CrossRef
.
- G. Tang, Y. W. Wen, A. M. Pang, D. W. Zeng, Y. G. Zhang, S. Q. Tian, B. Shan and C. S. Xie, The atomic origin of high catalytic activity of ZnO nano tetrapods for decomposition of ammonium perchlorate, CrystEngComm, 2014, 16, 570–574 RSC
.
- H. Gleiter, Nanocrystalline materials, Prog. Mater. Sci., 1989, 33, 223–315 CrossRef
.
- Y. Yuan, W. Jiang, Y. Wang, P. Shen, F. Li, P. Li, F. Zhao and H. Gao, Hydrothermal preparation of Fe2O3/graphene nanocomposite and its enhanced catalytic activity on the thermal decomposition of ammonium perchlorate, Appl. Surf. Sci., 2014, 303, 354–359 CrossRef
.
- N. Li, Z. Geng, M. Cao, L. Ren, X. Zhao, B. Liu, Y. Tian and C. Hu, Well-dispersed ultrafine Mn3O4 nanoparticles on graphene as a promising catalyst for the thermal decomposition of ammonium perchlorate, Carbon, 2013, 54, 124–132 CrossRef
.
- G. Eda and M. Chhowalla, Graphene Patchwork, ACS Nano, 2011, 5, 4265 CrossRef PubMed
.
- P. V. Kamat, Graphene-Based Nanoarchitectures. Anchoring Semiconductor and Metal Nanoparticles on a Two-Dimensional Carbon Support, J. Phys. Chem. Lett., 2010, 1, 520–527 CrossRef
.
- Z. S. Wu, W. C. Ren, L. Wen, L. B. Gao, J. P. Zhao, Z. P. Chen, G. M. Zhou, F. Li and H. M. Cheng, Graphene Anchored with Co3O4 Nanoparticles as Anode of Lithium Ion Batteries with Enhanced Reversible Capacity and Cyclic Performance, ACS Nano, 2010, 4, 3187–3194 CrossRef PubMed
.
- W. Hummer and R. Offeman, Preparation of graphitic oxide, J. Am. Chem. Soc., 1958, 80, 1339 CrossRef
.
- A. Eslami, S. G. Hosseini and V. Asadi, The effect of microencapsulation with nitrocellulose on thermal properties of sodium azide particles, Prog. Org. Coat., 2009, 65, 269–274 CrossRef
.
- S. J. Park, K. S. Lee, G. Bozoklu, W. W. Cai, S. T. Nguyen and R. S. Ruoff, Graphene oxide papers modified by divalent ions—enhancing mechanical properties via chemical cross-link, ACS Nano, 2008, 2, 572–578 CrossRef PubMed
.
- Y. S. Fu and X. Wang, Magnetically Separable ZnFe2O4–Graphene Catalyst and its High Photocatalytic Performance under Visible Light Irradiation, Ind. Eng. Chem. Res., 2011, 50, 7210–7218 CrossRef
.
- S. A. Chambers, R. F. C. Farrow, S. Maat, M. F. Toney, L. Folks, J. G. Catalano, T. P. Trainor and G. E. Brown Jr, Molecular beam epitaxial growth and properties of CoFe2O4 on MgO(001), J. Magn. Magn. Mater., 2002, 246, 124–139 CrossRef
.
- I. Nedkov, R. E. Vandenberghe, T. Marinova, P. Thailhades, T. Merodiiska and I. Avramova, Magnetic structure and collective Jahn-Teller distortions in nanostructured particles of CuFe2O4, Appl. Surf. Sci., 2006, 253, 2589–2596 CrossRef
.
- T. Yamashita and P. Hayes, Analysis of XPS spectra of Fe2+ and Fe3+ ions in oxide materials, Appl. Surf. Sci., 2008, 254, 2441–2449 CrossRef
.
- M. Fu, Q. Z. Jiao and Y. Zhao, Preparation of NiFe2O4 nanorod-graphene composites via an ionicliquid assisted one-step hydrothermal approach and their microwave absorbing properties, J. Mater. Chem., 2013, A1, 5577–5586 RSC
.
- H. Estrade-Szwarckopf, XPS photoemission in carbonaceous materials: a “defect” peak beside the graphitic asymmetric peak, Carbon, 2004, 42, 1713–1721 CrossRef
.
- S. Stankovich, D. A. Dikin, R. D. Piner, K. A. Kohlhaas, A. Kleinhammes, Y. Jia, Y. Wu, S. T. Nguyen and R. S. Ruoff, Synthesis of graphene-based nanosheets via chemical reduction of exfoliated graphite oxide, Carbon, 2007, 45, 1558–1565 CrossRef
.
- J. M. Criado, L. A. Perez-Maqueda and P. E. Sanchez-Jimenez, Dependence of the pre exponential factor on temperature, J. Therm. Anal. Calorim., 2005, 82, 671–675 CrossRef
.
- Z. Shuping, W. Yulong, Y. Mingde, L. Chun and T. Junmao, Pyrolysis characteristics and kinetics of the marine microalgae Dunaliellatertiolecta using thermogravimetric analyzer, Bioresour. Technol., 2010, 101, 359–365 CrossRef PubMed
.
- S. Syed, R. Qudaih, I. Talab and I. Janajreh, Kinetics of pyrolysis and combustion of oil shale sample from thermogravimetric data, Fuel, 2011, 90, 1631–1637 CrossRef
.
- P. Murugan, N. Mahinpey, T. Mani and N. Freitag, Pyrolysis and combustion kinetics of Fostert on oil using thermogravimetric analysis, Fuel, 2009, 88, 1708–1713 CrossRef
.
- M. Muthuraman, T. Namioka and K. Yoshikawa, Characteristics of co-combustion and kinetic study on hydrothermally treated municipal solid waste with different rank coals: a thermogravimetric analysis, Appl. Energy, 2010, 87, 141–148 CrossRef
.
- C. Chen, X. Ma and K. Liu, Thermogravimetric analysis of microalgae combustion under different oxygen supply concentrations, Appl. Energy, 2011, 88, 3189–3196 CrossRef
.
- Y. Chunmiao, Y. Lifu, L. Chang, L. Gang and Z. Shengjun, Thermal analysis of magnesium reactions with nitrogen/oxygen gas mixtures, J. Hazard. Mater., 2013, 260, 707–714 CrossRef PubMed
.
- H. Mostaan, F. Karimzadeh and M. H. Abbasi, Non-isothermal kinetic studies on the formation of Al2O3/Nb composite, Thermochim. Acta, 2010, 511, 32–36 CrossRef
.
- L. L. Bircumshaw and B. H. Newmann, The thermal decomposition of ammonium perchlorate I. Introduction, experimental, analysis of gaseous products, and thermal decomposition experiments, Proc. R. Soc. A, 1954, 227, 115–132 CrossRef
.
- I. V. Lightcap, T. H. Kosel and P. V. Kamat, Anchoring Semiconductor and Metal Nanoparticles on a Two-Dimensional Catalyst Mat. Storing and Shuttling Electrons with Reduced Graphene Oxide, Nano Lett., 2010, 10, 577–583 CrossRef PubMed
.
| This journal is © The Royal Society of Chemistry 2018 |

