 Open Access Article
Detection of SO2 derivatives using a new chalco-coumarin derivative in cationic micellar media: application to real samples†
Marisol Gómez *ab,
Margarita E. Aliaga
 a,
Verónica Arancibiaa,
Alexis Moyaa,
Camilo Segurac,
Marco T. Nuñezd,
Pabla Aguirred,
Edgar Nagles
 e and
Olimpo García-Beltrán
 *e
*e
aFacultad de Química, Pontificia Universidad Católica de Chile, Vicuña Mackenna 4860, Santiago, 7820436, Chile
bEscuela de Obstetricia y Puericultura and Centro Integrativo de Biología y Química Aplicada (CIBQA), Universidad Bernardo OHiggins, General Gana 1702, Santiago, 8370993, Chile
cDepartment of Chemistry, Faculty of Sciences, Universidad de Chile, Santiago 7800024, Chile
dBiology Department, Faculty of Sciences, Universidad de Chile, Santiago 7800024, Chile
eFacultad de Ciencias Naturales y Matemáticas, Universidad de Ibagué, Carrera 22 Calle 67, Ibagué 730001, Colombia. E-mail: jose.garcia@unibague.edu.co
First published on 5th September 2018
Abstract
A new probe (E)-7-(diethylamino)-3-(3-(thiophen-2-yl)acryloyl)-2H-chromen-2-one (ChC16) was synthesized and studied as a turn-on fluorescent probe, based on a Michael addition mechanism for sensing SO2 derivatives, which is favored in the presence of cationic micellar media such as cetylpyridinium bromide (CPB). The probe showed high selectivity and sensitivity toward bisulfite over other anions and biothiols, including cysteine (Cys), homocysteine (Hcy) and glutathione (GSH), with a detection limit of 240 nM. Moreover, the probe showed great potential for its practical application in the detection of bisulfite in real samples, such as dry white wine, and in bioimaging.
1. Introduction
Sulfur dioxide (SO2) derivatives, such as sulfite (SO3−2) and bisulfite (HSO3−) ions, have been largely used as preservatives for many foodstuffs, drinks and medications.1 However, it is well-known that all the SO2 forms can potentially cause health problems. Specifically, it has been reported that elevated quantities of sulfite can cause asthma and allergic reactions in some people, including difficulty in breathing, urticaria and gastrointestinal discomfort.2–4In this context, the Joint FAO/WHO Expert Committee on Food Additives has determined that an acceptable daily intake of sulfites should be lower than 0.7 mg kg−1 of body weight.5 Besides, since 1986 the FDA in the United States has demanded that any food or drink that contains a sulfite concentration bigger than 10 mg L−1 (125 μM)6 should be labelled. Therefore, the development of analytical methods that allow the detection and quantification of by-products of SO2 have gained great interest.
At this time, there are several conventional methods for this purpose, such as iodometric titration,7 chromatography,8,9 electrochemical analysis10–12 and flow injection analysis (FIA).13,14 Nevertheless, the principal disadvantage of these methods is that the majority of them require sample pre-treatment and the use of multiple reagents. Furthermore, in some cases, the detection process is very low and depends on high-cost instruments.
By contrast, the current use of fluorescent probes as a detection technique has acquired great relevance due to their high sensitivity and accuracy. In this context, novelty fluorescent probes have been developed by the detection of SO2 derivatives,15–19 mainly based on reactions with HSO3−/SO32−. Some examples reported in the literature are summarized in Table S1 (ESI†), and among this information we are interested in those that undergo a nucleophilic addition to “C![[double bond, length as m-dash]](https://www.rsc.org/images/entities/char_e001.gif) C” double bond, as a detection mechanism. Interestingly, Zhang et al. (2013)20 reported promising studies in this area, using a cationic cetyltrimethylammonium bromide (CTAB) micelle, which created a hydrophobic microenvironment promoting the addition reaction from the sulfite to an activated olefin in aqueous solutions. Therefore, the selectivity and sensitivity of the probe improved considerably. More recently, we have reported new probes able to detect SO2-derivatives via a Michael-type addition reaction, which was also favored by micellar media.21 In particular, we demonstrated that typical interferences, such as glutathione (GSH) and cysteine (Cys) were inhibited by the presence of the cationic micelles of cetylpyridinium bromide (CPB) and zwitterionic micelle of sulfobetaine (SB3-14) and the detection limits improved considerably. Thus, we take advantage of this fact and we are presenting in this study a new coumarin–chalcone derivative (E)-7-(diethylamino)-3-(3-(thiophen-2-yl)acryloyl)-2H-chromen-2-one (ChC16). The latter would undergo a nucleophilic addition reaction of SO2-derivatives to its “C
C” double bond, as a detection mechanism. Interestingly, Zhang et al. (2013)20 reported promising studies in this area, using a cationic cetyltrimethylammonium bromide (CTAB) micelle, which created a hydrophobic microenvironment promoting the addition reaction from the sulfite to an activated olefin in aqueous solutions. Therefore, the selectivity and sensitivity of the probe improved considerably. More recently, we have reported new probes able to detect SO2-derivatives via a Michael-type addition reaction, which was also favored by micellar media.21 In particular, we demonstrated that typical interferences, such as glutathione (GSH) and cysteine (Cys) were inhibited by the presence of the cationic micelles of cetylpyridinium bromide (CPB) and zwitterionic micelle of sulfobetaine (SB3-14) and the detection limits improved considerably. Thus, we take advantage of this fact and we are presenting in this study a new coumarin–chalcone derivative (E)-7-(diethylamino)-3-(3-(thiophen-2-yl)acryloyl)-2H-chromen-2-one (ChC16). The latter would undergo a nucleophilic addition reaction of SO2-derivatives to its “C![[double bond, length as m-dash]](https://www.rsc.org/images/entities/char_e001.gif) C” double bond, favored by the use of a cationic micelle.
C” double bond, favored by the use of a cationic micelle.
2. Results and discussion
2.1 Synthesis and characterization of probe (ChC16)
We describe here a new probe ChC16 (Scheme 1), which was designed considering a diethylaminocoumarin unit, as the fluorophore,5 bound via a double bond (C![[double bond, length as m-dash]](https://www.rsc.org/images/entities/char_e001.gif) C) with a thiophene fragment. The bond (C
C) with a thiophene fragment. The bond (C![[double bond, length as m-dash]](https://www.rsc.org/images/entities/char_e001.gif) C) would be responsible for the recognition of SO2-derivatives via a nucleophilic addition reaction. The latter based on previous studies, which demonstrated that other chalco-coumarin derivatives were able to act as fluorescent sensors for biothiols based on Michael addition.22,23 Regarding the thiophene fragment, it is considered as a good moiety for Michael acceptor. In fact, studies demonstrated that 2-(2-nitrovinyl)thiophene is only a little less reactive than the well-known Michael acceptor trans β-nitrostyrene.24
C) would be responsible for the recognition of SO2-derivatives via a nucleophilic addition reaction. The latter based on previous studies, which demonstrated that other chalco-coumarin derivatives were able to act as fluorescent sensors for biothiols based on Michael addition.22,23 Regarding the thiophene fragment, it is considered as a good moiety for Michael acceptor. In fact, studies demonstrated that 2-(2-nitrovinyl)thiophene is only a little less reactive than the well-known Michael acceptor trans β-nitrostyrene.24
 | ||
| Scheme 1 Synthetic route for probe ChC16. Reagents and conditions: (a) ethyl acetoacetate, piperidine, AcOH, EtOH, reflux, 6 h; (b) 2-thiophenecarboxaldehyde, DCM, reflux, 12 h. | ||
The new compound ChC16 was synthesized in two steps, as shown in Scheme 1. Firstly, 4-diethylaminosalicylaldehyde (1) was condensed with ethyl acetoacetate (Knoevenagel) and cyclized obtaining the compound 3-acetyl-7-(diethylamino)-2H-chromen-2-one (2).25 Finally, ChC16 was synthetized by adaptations of a literature procedure26 and characterized by 1H-NMR, 13C-NMR and HRMS (S1–S3; ESI†).
2.2 Absorption and emission properties of the probe (ChC16) in a micellar media of CPB
The absorption and emission properties of the ChC16 derivative at neutral conditions, 20 mM Britton–Robinson (BR) buffer (pH ≈ 7) containing 1% (v/v) DMSO were assessed. Probe ChC16 exhibits an absorption band with a maximum at 450 nm (Fig. S4; ESI†), a molar absorptivity (ε450) of 23![[thin space (1/6-em)]](https://www.rsc.org/images/entities/char_2009.gif) 888 L mol−1 cm−1 (Fig. S5; ESI†) and a characteristic emission ∼500 nm. In the presence of the micelle CPB, the absorption band associated with ChC16 is well defined and centered at 460 nm. Regarding the intensity of fluorescence emission (centered on 500 nm), it considerably increased by CPB effect. As shown in Table 1, the quantum yields were determined to be 0.169 and 0.349 for ChC16 in absence and presence of CPB, respectively.
888 L mol−1 cm−1 (Fig. S5; ESI†) and a characteristic emission ∼500 nm. In the presence of the micelle CPB, the absorption band associated with ChC16 is well defined and centered at 460 nm. Regarding the intensity of fluorescence emission (centered on 500 nm), it considerably increased by CPB effect. As shown in Table 1, the quantum yields were determined to be 0.169 and 0.349 for ChC16 in absence and presence of CPB, respectively.
| [CBP] (mM) | [Na2SO3] (μM) | λAbs (nm) | λEmi (nm) | ε (M−1 cm−1) | Φ |
|---|---|---|---|---|---|
| — | — | 450 | 500 | 23![[thin space (1/6-em)]](https://www.rsc.org/images/entities/char_2009.gif) 888 888 |
0.169 |
| 1.5 | — | 460 | 490 | 36![[thin space (1/6-em)]](https://www.rsc.org/images/entities/char_2009.gif) 034 034 |
0.349 |
| — | 500 | 450 | 500 | 28![[thin space (1/6-em)]](https://www.rsc.org/images/entities/char_2009.gif) 434 434 |
0.381 |
| 1.5 | 500 | 460 | 490 | 31![[thin space (1/6-em)]](https://www.rsc.org/images/entities/char_2009.gif) 546 546 |
0.893 |
2.3 Effect of pH on the fluorescence response of the probe ChC16 toward SO2-derivatives
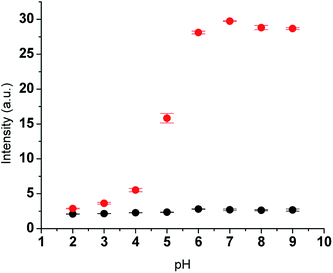
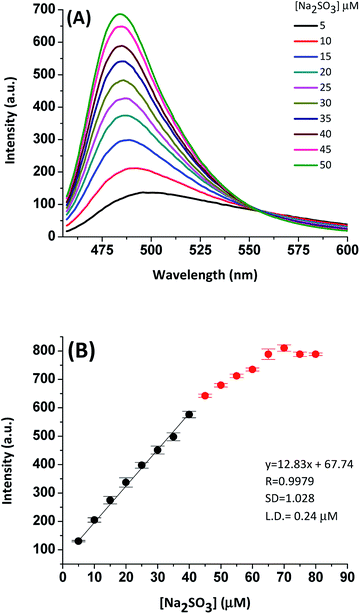
To ensure the optimal conditions to efficiently detect SO2 derivatives (HSO3−/SO32−) with the tested derivative (ChC16), we evaluated the changes in the fluorescence intensity associated with it. The latter was carried out in the presence of Na2SO3, at different pH values. As it can be seen in Fig. 1, the fluorescence response of probe ChC16 alone was almost pH insensitive, whereas upon the interaction with Na2SO3 important changes were observed depending on the pH values, showing a high fluorescence response from pH 6 to 9. In fact, a pH value of 7 was found to be appropriate for the bisulfite/sulfite detection by probe ChC16. The latter suggests that this probe can successfully react with HSO3−/SO32 and allow for them to be detected in physiological conditions.Considering these results, we assessed the effect of adding increasing concentrations of Na2SO3 on the intensity of the emission band of ChC16 at 490 nm, in the presence of CPB. As shown in Fig. 2(A), the emission band peak of probe in the presence of different concentrations of Na2SO3 (0–10 equivalent) gradually increased. The intensity of emission changed from 110 to 700 arbitrary units (see quantum yields in Table 1) and the reaction could be completed in 15 min. As a result, a good linear relationship between them was observed; thus, based on this linearity (Fig. 2(B)), the detection limit was determined to be 240 nM (S/N = 3). This value was lower to those reported in the literature for other probes for sulfite in the absence of the micellar medium.21,27
Regarding the stability of the method, this was mentioned in the Experimental section. The relative standard deviation (RSD) of the detection associated with the probe in the presence of the cationic micelle was 2%. It is important to mention that lesser values to 5% are accepted.28
2.4 Selectivity and competition studies of the probe ChC16 toward SO2-derivatives over other analytes
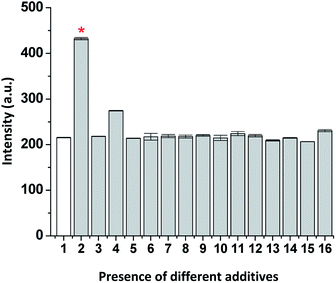
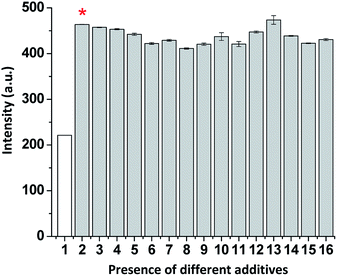
With the aim to evaluate the selectivity of the tested probe (ChC16) toward SO2 derivatives, we investigate its fluorescence response to typical interfering anions such as F−; Cl−; Br−; I−; NO3−; NO2−; SO42−; SCN−; S2O32−; S2O42−; S2−; CH3COO−; HCO3−; H2PO4− and biothiols (i.e. cysteine (Cys) and glutathione (GSH)). As illustrated in Fig. 3, no significant variations in the fluorescence emission associated to the probe were observed, for most of these anions, even in the presence of 10 eq. of the anions mentioned above. Except a slight change in the probe intensity was observed when the biothiol (GSH) was assessed.Furthermore, a competitive analysis of the different tested anions with HSO3−/SO32− was conducted. As shown in Fig. 4, after adding SO2 derivatives into the solution containing other anions, no significant variation in fluorescence intensity associated with ChC16 was found. It can be noted that all the tested anions have no interference with the fluorescence response of ChC16 toward HSO3−/SO32−, thereby indicating its high selectivity.
2.5 Sensing mechanism of the probe ChC16 toward SO2-derivatives
Considering that both HSO3−/SO32− can be acting as nucleophiles, we proposed that their addition to the double bond (C![[double bond, length as m-dash]](https://www.rsc.org/images/entities/char_e001.gif) C) of the probe could be responsible for the change in the fluorescence emission.
C) of the probe could be responsible for the change in the fluorescence emission.
In order to confirm the proposed mechanism for the response of the probe after its interaction with HSO3−/SO32−, first we carried out experiments using high resolution mass spectroscopy (HRMS-ESI).
Results from the HRMS-ESI (Fig S6; ESI†) show a major ion peak found at m/z 435.1598 which is nearly identical to the theoretical molecular mass of the ChC16–bisulfite adduct ([ChC16–H]+ calcd 435.0858). These data strongly support the 1![[thin space (1/6-em)]](https://www.rsc.org/images/entities/char_2009.gif) :
:![[thin space (1/6-em)]](https://www.rsc.org/images/entities/char_2009.gif) 1 adduct formation of probe ChC16 mainly with bisulfite (ChC16–SO3H).
1 adduct formation of probe ChC16 mainly with bisulfite (ChC16–SO3H).
Subsequently, we assessed the interaction mode between ChC16 and bisulfite using 1H-NMR spectroscopy. As shown in Fig. 5A, the spectrum of ChC16 in the absence of Na2SO3 depicts two important signals at 7.93 and 7.75 ppm, which could be attributed to the vinylic protons Hb and Ha, respectively. Upon the addition of Na2SO3 to a solution containing the probe, the resulting spectrum presents a new signal that appears at 5.08 ppm (Fig. 5(B)), which is attributed to the proton Hb that was upfield shifted. These data suggest that the reaction between bisulfite and ChC16 is a Michael addition in the β-carbon of the ketone α,β-unsaturated. This result is consistent with the formation of the ChC16–SO3H adduct.
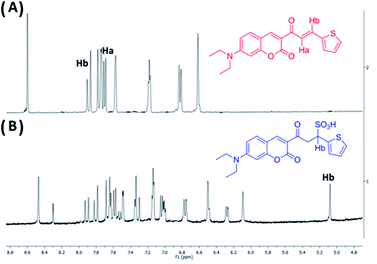 | ||
Fig. 5 1H-NMR partial of ChC16 in the absence (A) and in the presence (B) of Na2SO3 (10 eq.), solvent used DMSO-d6![[thin space (1/6-em)]](https://www.rsc.org/images/entities/char_2009.gif) : :![[thin space (1/6-em)]](https://www.rsc.org/images/entities/char_2009.gif) D2O (4 D2O (4![[thin space (1/6-em)]](https://www.rsc.org/images/entities/char_2009.gif) : :![[thin space (1/6-em)]](https://www.rsc.org/images/entities/char_2009.gif) 1). 1). | ||
2.6 Validation and application to real samples
In order to demonstrate the applicability of the tested probe, compound ChC16 was assessed to detect HSO3− in real samples. In the first case, the real sample included white wines, which were analyzed using probe ChC16 in the presence of CPB as a fluorometric method and a reported method to determine the total sulfite concentration.29 As shown in Table 2, the obtained results using these two detection methods for bisulfite perfectly fit (error range 4–9%). Thus, these results suggest that probe ChC16, in the presence of a cationic micelle as CPB, can be used for quantitative detection of HSO3− in a real sample.| Sample | Fluorometric method using ChC16 + CPB | AOAC Official Method29 |
|---|---|---|
| Wine 1 | 104.7 [mg L−1] | 100.3 [mg L−1] |
| Wine 2 | 115.3 [mg L−1] | 119.6 [mg L−1] |
Furthermore, bearing in mind evidence on the production of sulfur dioxide in cytosols and mitochondria of cells30 we also assessed whether the probe can determine SO2 derivatives in biological systems. As shown in Fig. 6(A), when SH-SY5Y neuroblastoma cells were incubated with ChC16 (5 μM) for about 20 min at 37 °C, a low intracellular fluorescence was observed, with cytoplasmic accumulation. After treatment of cells with Na2SO3 (30 μM) for an additional 45 min at 37 °C, a slight increase in the fluorescence signal was detected (not shown).
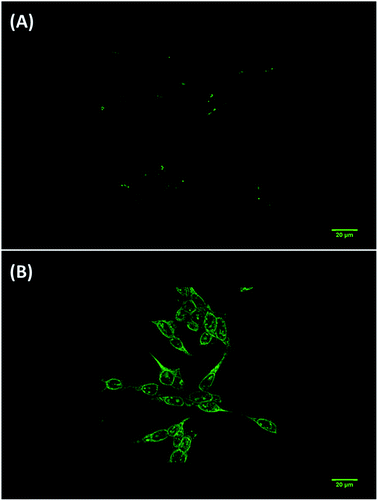 | ||
| Fig. 6 Fluorescence images of SH-SY5Y cells. (A) Cells were incubated with probe ChC16 (5 μM) for 20 min; (B) image of cells after subsequent treatment with CPB (1 mM) and Na2SO3 (30 μM) for 15 min. | ||
However, other experiments demonstrated that, when SH-SY5Y cells were incubated with ChC16 (5 μM) in the presence of the cationic micelle CPB (1 mM) and Na2SO3 for an additional 15 min at 37 °C, a large increase in fluorescent intensity could be observed. Thus, demonstrating that the compound ChC16 acts as a probe “turn on” induced by the mixture CPB-SO2 derivatives. Finally, it is important to mention that the ChC16 compound has a diethylamino group at the C-7 of the coumarin and this group have shown affinity for the cell membrane.25 However, in this study it was observed that the compound have no affinity by cell membrane. Moreover, an accumulation in cytoplasmic structures was observed.
3. Conclusions
In this work, we synthesized and characterized a new chalco-coumarin derivative and we assessed its photo-physical behavior as a sensor for SO2 derivatives. We found that this probe, in the presence of a cationic micellar medium, displays a high selectivity for sulfite over the other typical interferents (biothiols) with a detection limit next to 10−9 M. Finally, we were able to carry out experiments in real samples of white wine and cell imaging to visualize bisulfite by the proposed fluorometric method, using ChC16 in a micellar cationic media.4. Experimental
4.1 Synthetic procedures
![[thin space (1/6-em)]](https://www.rsc.org/images/entities/char_2009.gif) :
:![[thin space (1/6-em)]](https://www.rsc.org/images/entities/char_2009.gif) AcOEt 15
AcOEt 15![[thin space (1/6-em)]](https://www.rsc.org/images/entities/char_2009.gif) :
:![[thin space (1/6-em)]](https://www.rsc.org/images/entities/char_2009.gif) 1. The product obtained is a yellow solid (0.478 g, 1.35 mmol) in 71.0% yield. 1H-NMR (400 MHz, DMSO-d6) δ 8.57 (s, 1H), 7.93 (d, 1H, J = 20 Hz, Ar-CH, H3′), 7.75 (d, 1H, J = 20 Hz, CO–CH=, H2′), 7.73 (s, 1H, Ar–H, H4), 7.68 (d, 1H, J = 12 Hz, Ar–H, H4′′), 7.56 (d, 1H, J = 12 Hz, Ar–H, H6, H8), 7.17 (t, 1H, J = 4.0 Hz, Ar–H, H6), 6.80 (d, 1H, J = 4.0 Hz, Ar–H, H6), 6.59 (s, 1H), 3.50 (dd, 4H, J = 8.0, –CH2–), 1.15 (s, 6H, J = 8.0, –CH3). 13C-NMR (100 MHz, DMSO-d6) 12.8, 44.9, 96.3, 108.4, 110.7, 115.6, 124.0, 129.2, 130.2, 133.0, 133.4, 135.5, 140.7, 148.9, 153.3, 158.7, 160.5, 185.3. The m/z observed value was 354.1148 positive mode, and the calculated value for C20H19NO3S was 353.1085 (Fig. S3†).
1. The product obtained is a yellow solid (0.478 g, 1.35 mmol) in 71.0% yield. 1H-NMR (400 MHz, DMSO-d6) δ 8.57 (s, 1H), 7.93 (d, 1H, J = 20 Hz, Ar-CH, H3′), 7.75 (d, 1H, J = 20 Hz, CO–CH=, H2′), 7.73 (s, 1H, Ar–H, H4), 7.68 (d, 1H, J = 12 Hz, Ar–H, H4′′), 7.56 (d, 1H, J = 12 Hz, Ar–H, H6, H8), 7.17 (t, 1H, J = 4.0 Hz, Ar–H, H6), 6.80 (d, 1H, J = 4.0 Hz, Ar–H, H6), 6.59 (s, 1H), 3.50 (dd, 4H, J = 8.0, –CH2–), 1.15 (s, 6H, J = 8.0, –CH3). 13C-NMR (100 MHz, DMSO-d6) 12.8, 44.9, 96.3, 108.4, 110.7, 115.6, 124.0, 129.2, 130.2, 133.0, 133.4, 135.5, 140.7, 148.9, 153.3, 158.7, 160.5, 185.3. The m/z observed value was 354.1148 positive mode, and the calculated value for C20H19NO3S was 353.1085 (Fig. S3†).4.2 Materials and methods
Solvents and reagents utilized were Sigma-Aldrich. All solutions employed in this study were prepared in Britton–Robinson (BR) buffer solution (20 mM, pH = 7) and the reagents utilized were Suprapur®. The stock dissolution of the probe was conducted in DMSO. Absorption and fluorescence spectra were obtained HP-8453 diode array spectrophotometer and Cary Eclipse fluorescence spectrophotometer, respectively.
 | (1) |
Conflicts of interest
There are no conflicts to declare.Acknowledgements
This work was supported by FONDECYT postdoc grant #3150196, FONDECYT grants #1170753 and #11170701, and by COLCIENCIAS Grants #130774559056 Colombia.References
- R. F. McFeeters and A. O. Barish, J. Agric. Food Chem., 2003, 51, 1513–1517 CrossRef PubMed.
- C. Wang, S. Feng, L. Wu, S. Yan, C. Zhong, P. Guo, R. Huang, X. Weng and X. Zhou, Sens. Actuators, B, 2014, 190, 792–799 CrossRef.
- X. Ma, C. Liu, Q. Shan, G. Wei, D. Wei and Y. Du, Sens. Actuators, B, 2013, 188, 1196–1200 CrossRef.
- S. L. Bahna and J. G. Burkhardt, Allergy Asthma Proc., 2018, 39, 3–8 CrossRef PubMed.
- M.-Y. Wu, T. He, K. Li, M.-B. Wu, Z. Huang and X.-Q. Yu, Analyst, 2013, 138, 3018–3025 RSC.
- U.S. Food and Drug Adminitration, 1986, 51, 25012–25020.
- J. M. Vahl and J. E. Converse, J. –Assoc. Off. Anal. Chem., 1980, 63, 194–199 Search PubMed.
- D. R. Migneault, Anal. Chem., 1989, 61, 273–275 CrossRef.
- Z. Zhong, G. Li, B. Zhu, Z. Luo, L. Huang and X. Wu, Food Chem., 2012, 131, 1044–1050 CrossRef.
- Ü. T. Yilmaz and G. Somer, Anal. Chim. Acta, 2007, 603, 30–35 CrossRef PubMed.
- A. Isaac, J. Davis, C. Livingstone, A. J. Wain and R. G. Compton, TrAC, Trends Anal. Chem., 2006, 25, 589–598 CrossRef.
- M. H. Pournaghi-Azar, M. Hydarpour and H. Dastangoo, Anal. Chim. Acta, 2003, 497, 133–141 CrossRef.
- C. Ruiz-Capillas and F. Jimenez-Colmenero, Food Addit. Contam., Part A, 2008, 25, 1167–1178 CrossRef PubMed.
- S. S. M. Hassan, M. S. A. Hamza and A. H. K. Mohamed, Anal. Chim. Acta, 2006, 570, 232–239 CrossRef PubMed.
- J. Chao, X. Wang, Y. Liu, Y. Zhang, F. Huo, C. Yin, M. Zhao, J. Sun and M. Xu, Sens. Actuators, B, 2018, 272, 195–202 CrossRef.
- J. Chao, H. Wang, Y. Zhang, C. Yin, F. Huo, J. Sun and M. Zhao, New J. Chem., 2018, 42, 3322–3333 RSC.
- J. Chao, Y. Liu, Y. Zhang, Y. Zhang, F. Huo, C. Yin, Y. Wang and L. Qin, Spectrochim. Acta, Part A, 2015, 146, 33–37 CrossRef PubMed.
- J. Chao, Y. Zhang, H. Wang, Y. Zhang, F. Huo, C. Yin, L. Qin and Y. Wang, Sens. Actuators, B, 2013, 188, 200–206 CrossRef.
- Y. Yang, F. Huo, J. Zhang, Z. Xie, J. Chao, C. Yin, H. Tong, D. Liu, S. Jin, F. Cheng and X. Yan, Sens. Actuators, B, 2012, 166–167, 665–670 CrossRef.
- H. Tian, J. Qian, Q. Sun, H. Bai and W. Zhang, Anal. Chim. Acta, 2013, 788, 165–170 CrossRef PubMed.
- M. Gómez, E. G. Perez, V. Arancibia, C. Iribarren, C. Bravo-Díaz, O. García-Beltrán and M. E. Aliaga, Sens. Actuators, B, 2017, 238, 578–587 CrossRef.
- O. García-Beltrán, C. González, E. G. Pérez, B. K. Cassels, J. G. Santos, D. Millán, N. Mena, P. Pavez and M. E. Aliaga, J. Phys. Org. Chem., 2012, 25, 946–952 CrossRef.
- M. E. Aliaga, W. Tiznado, B. K. Cassels, M. T. Nuñez, D. Millán, E. G. Pérez, O. García-Beltrán and P. Pavez, RSC Adv., 2014, 4, 697–704 RSC.
- K. Peter, T. Stefan, S. Hans-Günther and A. Andreas, Eur. J. Org. Chem., 2004, 1577–1583 Search PubMed.
- O. García-Beltrán, N. Mena, O. Yañez, J. Caballero, V. Vargas, M. T. Nuñez and B. K. Cassels, Eur. J. Med. Chem., 2013, 67, 60–63 CrossRef PubMed.
- O. García-Beltrán, N. Mena, E. G. Pérez, B. K. Cassels, M. T. Nuñez, F. Werlinger, D. Zavala, M. E. Aliaga and P. Pavez, Tetrahedron Lett., 2011, 52, 6606–6609 CrossRef.
- J. Wang, Y. Hang, H. Tan, T. Jiang, X. Qu and J. Hua, J. Photochem. Photobiol., A, 2017, 346, 265–272 CrossRef.
- D. Jiang, H. Jiang, J. Ji, X. Sun, H. Qian, G. Zhang and L. Tang, J. Agric. Food Chem., 2014, 62, 6473–6480 CrossRef PubMed.
- AOAC Official Method 990.28, Sulfites in Foods, Optimized Monier-Williams Method, AOAC Official Methods of Analysis, Sec. 47.3.43, 2000.
- D.-P. Li, Z.-Y. Wang, J. Cui, X. Wang, J.-Y. Miao and B.-X. Zhao, Sci. Rep., 2017, 7, 45294 CrossRef PubMed.
- G. A. Crosby and J. N. Demas, J. Phys. Chem., 1971, 75, 991–1024 CrossRef.
Footnote |
| † Electronic supplementary information (ESI) available. See DOI: 10.1039/c8ra04526g |
| This journal is © The Royal Society of Chemistry 2018 |

