 Open Access Article
Hot pressing-induced alignment of hexagonal boron nitride in SEBS elastomer for superior thermally conductive composites†
Cuiping Yuabc,
Wenbin Gongb,
Jun Zhangb,
Weibang Lvb,
Wei Tian*a,
Xiaodong Fana and
Yagang Yao *bc
*bc
aThe Key Laboratory of Space Applied Physics and Chemistry, Ministry of Education and Shaanxi Key Laboratory of Macromolecular Science and Technology, School of Science, Northwestern Polytechnical University, Xi'an 710072, PR China. E-mail: happytw_3000@nwpu.edu.cn
bDivision of Advanced Nanomaterials, Key Laboratory of Nanodevices and Applications, Joint Key Laboratory of Functional Nanomaterials and Devices, CAS Center for Excellence in Nanoscience, Suzhou Institute of Nano-tech and Nano-bionics, Chinese Academy of Sciences, Suzhou 215123, PR China. E-mail: ygyao2013@sinano.ac.cn
cDivision of Nanomaterials, Suzhou Institute of Nano-Tech and Nano-Bionics, Chinese Academy of Sciences, Nanchang 330200, PR China
First published on 18th July 2018
Abstract
Styrene–ethylene–butylene–styrene (SEBS) composite films containing well-dispersed and highly aligned hexagonal boron nitride (hBN) platelets were achieved by a ball milling process followed by hot-pressing treatment. An ultrahigh in-plane thermal conductivity of 45 W m−1 K−1 was achievable in the SEBS composite film with 95 wt% hBN. The corresponding out-of-plane thermal conductivity was also as high as 4.4 W m−1 K−1. The hBN/SEBS composite film was further used to cool a CPU connected to a computer, resulting in a decrease by about 4 °C in the stable temperature. Percolation thresholds over 40 wt% and 60 wt% in the hBN/SEBS composites were obtained in the in-plane and out-of-plane directions, respectively. This phenomenon has rarely been reported in polymer composites. Molecular dynamics simulations were also conducted to support this percolation threshold. The linear coefficients of the thermal expansion value of the hBN/SEBS composite with 95 wt% hBN was as low as 16 ppm K−1. This was a significant decrease compared to that of pure SEBS (149 ppm K−1). The proposed strategy provides valuable advice about the heat-transfer mechanism in polymer composites containing oriented two-dimensional materials.
Introduction
Thermally conductive while electrically insulating polymer-based composite films are highly desirable for their applications in aircraft, motor control, automobiles, and household applications because of their wide range of utilization, ease of processing, and low cost.1,2 However, the thermal conductivity of current polymer-based composites is below 10 W m−1 K−1, and so hardly able to satisfy the growing demand for high-performance materials.3–5 Therefore, there is an urgent need to develop a new strategy to prepare desired materials with high thermal conductivity. Inorganic fillers, such as aluminum nitride,6,7 alumina,8,9 or boron nitride,1–5,10–17 have been added to polymer matrices to improve the thermal performance because of their high thermal conductivity and electric insulation.Hexagonal boron nitride (hBN), also called white graphite, has attracted much attention due to its high thermal conductivity, relatively lower density, and a large band gap (nearly 5.9 eV), which make it suitable for applications in thermally conductive and insulating composites.1–4,10,13,18,19 In recent years, much effort has been directed to the rational design and controlled preparation of hBN-filled polymer composites.1,3–5,13,20–24 As reported previously, the thermal property of hBN-filled composites is mainly influenced by the interface and dispersion state of hBN in polymer composites.1,4,5,20–23,25,26 The interface is mainly influenced by the compatibility between the fillers and matrix. Modification by hBN can enhance the affinity of the hBN/polymer interface. This is an efficient strategy to optimize the thermal conductivity of composites via reducing the interfacial thermal resistance.21,25 For example, Gu et al. fabricated polyhedral oligomeric silsesquioxane (POSS)-functionalized hBN. The as-made POSS-hBN was filled into bismaleimide/diallylbisphenol A27 and polyphenylene sulfide28 to improve the thermal conductivity. Besides, designing a new polymer matrix is beneficial for increasing the combination between hBN fillers and the matrix. For example, thiol–epoxy elastomers29 and bisphenol A dicyanate ester/dicyclopentadiene bisphenol cyanate ester hybrid resin30 were fabricated and the composites were endowed with excellent thermal conductivity. However, the modification unavoidably destroyed the crystal structure of hBN and reduced its thermal performance. Also, the fabrication process was complex due to the introduction of many monomers, which limited its uses in practical applications. In addition, the enhancement efficiency was still low. To reach a high thermal conductivity, a high hBN loading is necessary due to the construction of more thermally conductive channels of hBN.4,31 Therefore, it is desirable to develop a strategy to reach a high filler loading.
Besides, since hBN exhibits an in-plane thermal conductivity of 600 W m−1 K−1, almost 20 times higher than that of the through-plane thermal conductivity,20 it is widely accepted that a significant enhancement in the in-plane thermal conductivity could be achieved by controlling the alignment of hBN via enabling the constructing of heat conductive networks. Therefore, it is desirable to develop a novel, facile, straightforward strategy to fabricate hBN-filled composites with a highly aligned structure. Recently, many novel methods have been reported to assist the orientation, including doctor blading,21 magnetic field alignment,22,23 oscillatory shearing,5 and electric field.26 However, these methods are just suitable for low filler loadings because a large amount of the hBN causes an increase in the viscosity, which interferes with the hBN orientation, albeit the proposed methods showed significant thermal conductivity enhancements. However, the thermal conductivity was marginal compared to that expected for systems with a high filler loading fraction, and still insufficient for the increasing demands for higher thermally conductive composites. Thus, a route to achieve high filler loading while maintaining the oriented structure is desirable to improve the thermal conductivity. To date, vacuum filtration has been shown to be able to achieve this goal.1,10 For example, Zhu et al. fabricated an aligned boron nitride nanosheet (BNNS) paper wired by nanofibrillated cellulose.1 This paper exhibited an ultrahigh thermal conductivity of 145.7 W m−1 K−1 at 50 wt% BNNS loading. This could be ascribed to the gravity force brought about by vacuum filtration, which tended to horizontally orient the hBN microplatelets.12,32,33 However, the size of the hBN paper under vacuum filtration was limited by the size of the funnel, making it difficult to produce larger sizes. Therefore, it is still challenging to design and obtain hBN-filled composite films at a large range of filler loadings via a facile and effective process in an oriented fashion.
In this work, we fabricated hBN/styrene–ethylene–butylene–styrene (SEBS) composite films with hBN aligned in parallel through a hot pressing-induced-alignment technique. SEBS was chosen as the matrix, because it is an elastomer that can be used without vulcanization and it resists high-temperature. This was beneficial for the hot-forming procedure. Since the composites were fabricated by solvent mixing, by which the concentrations of the dispersion could be precisely controlled, various filler loadings were designed (0–95 wt%). The fabricated hBN/SEBS composites exhibited a superior thermal conductivity of 45 W m−1 K−1 at 95 wt% hBN loading. Based on this aligned structure, the thermal conductivity was tested and analyzed by molecular dynamics simulations. This was constructive for exploring the heat-transfer mechanism of the composites containing oriented two-dimensional (2D) fillers.
Experimental
Materials
hBN powder (sizes ranging from 10 μm to 30 μm, purity > 99.5%) was purchased from Dandong Rijin Science and Technology Co., Ltd. (Liaoning, China). The SEBS used was Kraton G1652 (American). Tetrahydrofuran (THF) and ethanol were purchased from Sinopharm Chemical Reagent Co., Ltd. (Beijing, China). All the chemicals were analytical grade and were used as received without further treatments.Preparation of hBN/SEBS composite films
SEBS matrix and hBN filler were dried under in a vacuum oven at 60 °C for at least 12 h. A typical example of the preparation of 95 wt% hBN/SEBS composite film is as follows: 0.5 g dried SEBS was dispersed into 4.5 g THF by stirring for 3 h at 40 °C to obtain a SEBS solution with 10 wt% hBN. 9.5 g dried hBN powder was added into the SEBS solution. The hBN/SEBS solution was subjected to ball milling for 24 h in a planetary ball mill at a rotational speed of 400 rpm at room temperature. This resulted in a homogeneous hBN/SEBS dispersion. A solid-state hBN/SEBS mixture was obtained after the dispersion was added to excessive ethanol. The coagulated polymer composites were then isolated via subsequent settlement and dried in a vacuum at 50 °C for 24 h. The as-made hBN/SEBS mixtures were pressed between brass plates to form 0.1 mm thin films using 0.1 mm thick spacers in a hydraulic hot press at 150 °C under a pressure of 10 MPa for 15 min. Various mass fractions of hBN in the composites were achieved via controlling the feed ratio before the ball milling process.Molecular dynamics simulations
Molecular dynamics simulations were performed via the large-scale atomic/molecular dynamic package (LAMMPS),34 with a time step of 0.1 fs. The intramolecular interaction of the thermoplastic elastomer was described by its Airebo potential,35 while the Tersoff potential was used to simulate the B–N bonds in hBN.36 The intermolecular interaction between the thermoplastic elastomer and the hBN was described by the Lennard-Jones potential, and the intermolecular interaction of the hBN was modeled with the coulombic potential to obtain its ionic characteristic. The cutoff of these long-range interactions was set at 15 Å. The charges of the boron and the nitrogen atoms were calculated to be −0.6e and 0.6e by charge equilibration calculations. The force-field settings are summarized in Table S1.† Several pieces of hBN were added into the thermoplastic elastomer matrix, which consisted of 22 SEBS chains with 1100 atoms in each molecule, to simulate different hBN contents. Beginning with a 20 ps running in the NVT ensemble at 300 K, the equilibrium structures at a pressure of 10 atm were obtained within a 26.3 × 156.6 × 74.2 Å3 simulation box, by performing 30 ps simulations in the NPT ensembles. The thermal conductivity calculations were then performed by equilibrating the structures at constant volume and temperature (300 K). This was followed by a 200 ps run to establish a steady heat flux via the reverse non-equilibrium molecular dynamics method (rNEMD), as shown in Fig. S1.†37Characterization
The sample morphologies were measured with scanning electron microscopy (SEM, SU8010, 2 kV). Thermogravimetric analysis (TGA) was performed on a thermogravimetric analyzer TG 209 F1 (NETZSCH, Germany) under air atmosphere with a heating rate of 10 °C min−1 from room temperature to 900 °C. The thermal diffusivities (α) of the composite films were measured with a laser flash thermal analyzer (LFA 447, NETZSCH) with 12.7 mm diameter samples. The composites were sprayed with graphite powder on both sides before characterization. The thermal conductivity (λ) was obtained with the equation λ(T) = α(T) × Cp(T) × ρ(T). The densities (ρ) of the composite films were calculated from the weight and dimensions of the composite films. The specific heat capacities (Cp) of the composites were measured by differential scanning calorimetry (DSC, 200 F3, NETZSCH, Germany). The thermal diffusivities, densities, and specific heats were all characterized at 25 °C. The linear coefficient of thermal expansion (CTE) of the composites was measured using a thermomechanical analyzer (TMA, 402 F3, NETZSCH) at a heating rate of 5 K min−1 to 80 °C in a nitrogen atmosphere. The tensile property was measured on the hydraulic universal material testing machine Instron 3365 (Instron Corporation, USA) with a cross-head speed of 2 mm min−1. The CPU used was an Intel® Pentium® CPU G4560 @ 3.5 GHz. The CPU output power was fixed at 60%.Results and discussion
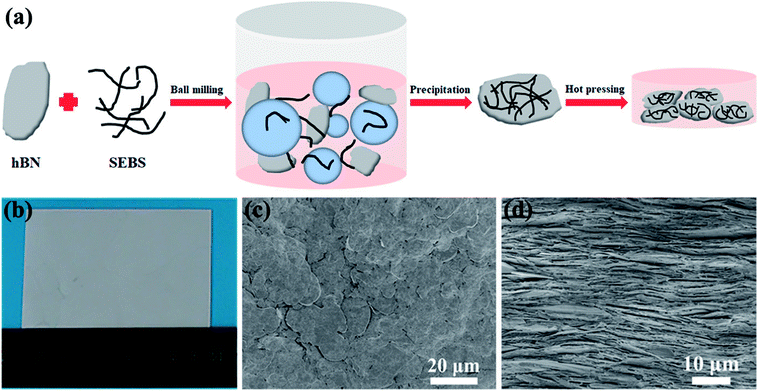
Fig. 1a schematically exhibits the preparation process of the hBN/SEBS composite films via the ball milling process followed by the hot-pressing treatment. Wet ball milling was used in this process to disperse hBN in the SEBS solution. Compared to the traditional mixing strategy of mechanical stirring, ball milling had a better dispersion effect due to the shear force and compression force generated by balls of various diameters. The preparation process is shown in Fig. 1a, where a mixture of hBN and SEBS solution was ball milled in a grinding chamber. The obtained hBN/SEBS dispersion was precipitated in ethanol, resulting in hBN/SEBS coagulation solids. These were hot pressed to fabricate a freestanding, large-scale composite film (Fig. 1b). The SEM images of 95 wt% hBN/SEBS composite film depicted a well-packed layers configuration (Fig. 1c and d). The formation of this highly ordered structure was facilitated by the shear forces of the hot-pressing process and the rigidity of the 2D hBN. This structure makes a great contribution to the heat transferring in the in-plane direction. By controlling the solution concentration and hBN feeds, various filler loadings could be achieved.The presence of SEBS in THF during the hBN dispersion step not only prevented hBN aggregating together but also helped maintain the perfect structure of the hBN. This was supported by the SEM image of hBN in the hBN/SEBS composites after ball milling (Fig. 2b). The hBN microplatelets were rarely damaged after the ball milling procedure. The sizes and thicknesses of hBN in the hBN/SEBS composites were in the range of 5–25 μm (Fig. 2b) and about 180–270 nm (Fig. 2c), respectively. These values were similar to the pristine hBN powders (Fig. 2a). The subsequent coagulation in ethanol led to hBN/SEBS solids with uniformly dispersed hBN, in which the newly obtained hBN was wrapped up by SEBS (Fig. 2d).
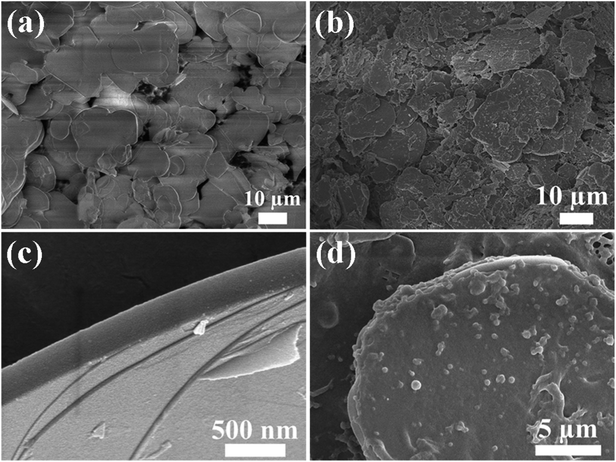 | ||
| Fig. 2 SEM images of (a) pristine hBN powder, (b and d) hBN/SEBS coagulated solids, (c) hBN platelets in the hBN/SEBS coagulated solids. | ||
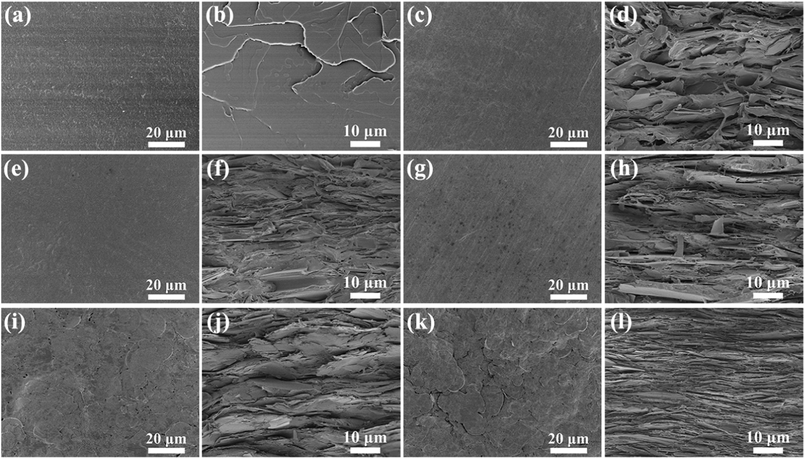
The representative SEM images are revealed in Fig. 3a–l. As shown in Fig. 3a, c, e, g, i and k, the surface morphologies of hBN/SEBS composites depicted an increased number of hBN with increasing the filler loadings. The hBN microplatelets on the composite surface were parallel to the polymer flow direction and were not curved even after the hot-pressing treatment. This could be ascribed to the superior stiffness of hBN. The detailed examinations about the orientation of hBN in the composites were verified by the cross-sectional SEM morphologies (Fig. 3b, d, f, h, j and l). hBN was highly aligned in all the samples. There were micrometer-wide gaps between the hBN sheets edges in the composites with loadings lower than 40 wt%. However, an obvious hBN overlap was observed in the 60 wt% hBN/SEBS composites. With the further addition of hBN to 80 wt% and 95 wt%, a tightly packed and layered structure was revealed in the corresponding cross-sectional SEM images. This structure facilitated the construction of heat-transfer networks, which are beneficial for heat conductivity. The unique layered arrangement of hBN in the matrix dramatically increased the thermal conductivity.
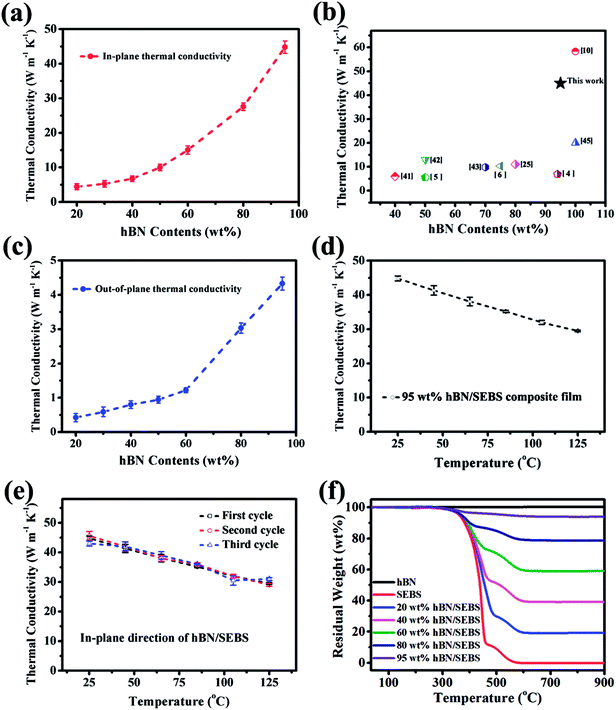
The hBN contents in the composite films were quantified by TGA measurements. The TGA curves of hBN, SEBS, hBN/SEBS composites with various hBN contents are shown in Fig. 4f. Pristine hBN powder exhibited almost no significant weight loss until 800 °C. However, there were two significant drops in the weight loss curves of the composites. The first drop from about 250 °C to 400–500 °C should be ascribed to the decomposition of SEBS. The second obvious weight loss happened from 400–500 °C to about 600 °C and was assigned to the combustion of the residual carbon of SEBS in the air atmosphere. Up to this temperature, all the organic compounds were completely decomposed and volatilized. hBN contents could be obtained by the residual weight at 800 °C and were approximately 20 wt%, 40 wt%, 60 wt%, 80 wt%, and 95 wt%. The corresponding weight loss temperature and THeat resistance index (THRI)38,39 values of the pristine SEBS and hBN/SEBS composites with various filler loadings are presented in Table 1. The corresponding THRI values of the hBN/SEBS composites were about 200 °C, showing relatively high thermal stability. The THRI values of the hBN/SEBS composites were gradually enhanced with the increasing addition of hBN, presenting the improved thermal stabilities. This revealed that the addition of hBN was beneficial for the heat resistance of the hBN/SEBS composites. This could be ascribed to the relatively higher thermal conductivity of hBN compared to that of pure SEBS, which was apt to absorb the outside heat. Besides, hBN could effectively hinder the effusion of pyrolysis volatiles. Thus, the thermal stabilities of the hBN/SEBS composites were improved accordingly.
| THRI = 0.49 × [T5 + 0.6 × (T30 − T5)] | (1) |
| Samples | Weight loss temperature/°C | THRIa/°C | ||
|---|---|---|---|---|
| T5 | T30 | T50 | ||
| a The THRI of the samples were calculated by eqn (1).38,39 | ||||
| Pure SEBS | 361.1 | 420.8 | 438.6 | 194.5 |
| 20 wt% hBN/SEBS | 367.7 | 430.1 | 455.6 | 198.5 |
| 40 wt% hBN/SEBS | 369.0 | 437.1 | 510.0 | 200.8 |
| 60 wt% hBN/SEBS | 370.9 | 499.7 | — | — |
| 80 wt% hBN/SEBS | 371.2 | — | — | — |
| 95 wt% hBN/SEBS | 533.0 | — | — | — |
The in-plane thermal conductivity of the hBN/SEBS composite film is shown in Fig. 4a. The thermal conductivity of the hBN/SEBS composite film increased to 4.4 W m−1 K−1 with 20 wt% hBN. This enhancement was significant compared to the pure SEBS film (0.2 W m−1 K−1). When the filler loadings were 30 wt% and 40 wt%, the hBN/SEBS composite films exhibited thermal conductivity of about 5.2 and 6.7 W m−1 K−1, respectively. The thermal conductivity changed slightly at filler loadings from 20 wt% to 40 wt%. However, the values were about 10 W m−1 K−1 and 15 W m−1 K−1 with 50 wt% and 60 wt% hBN, respectively. This enhancement was very obvious compared to that of the composites with 20–40 wt% hBN. The thermal conductivity of the hBN/SEBS composite reached 27.5 W m−1 K−1 and 45 W m−1 K−1 when 80 wt% and 95 wt% hBN were added. Such excellent thermal conductivity was much higher than those of the hBN-filled composites (Fig. 4b). Fig. 4c exhibits the out-of-plane thermal conductivity of the hBN/SEBS composite films. The 20 wt% hBN/SEBS composite film exhibited a thermal conductivity of 0.4 W m−1 K−1. The hBN/SEBS composite films showed thermal conductivities of 0.6 W m−1 K−1, 0.8 W m−1 K−1, and 0.94 W m−1 K−1 when the hBN loadings were 30 wt%, 40 wt%, and 50 wt%, respectively. The changes were small at this filler loading range (20–50 wt%). However, with the further addition of hBN to 60 wt%, the thermal conductivity improved to 1.3 W m−1 K−1, while 80 wt% and 90 wt% hBN/SEBS composite films exhibited thermal conductivity of about 3 W m−1 K−1 and 4.4 W m−1 K−1, respectively.
Fig. 4d shows the temperature-dependent thermal conductivity of the 95 wt% hBN/SEBS composite film. The thermal conductivity of the samples decreased as the temperature increased from 25 °C to 125 °C. Since the number of collisions that occurring between phonons increase when the temperature rises,40 the decreased thermal conductivity could originate from the decrease in the average free path of the phonons. As shown in Fig. 4e, the thermal conductivity values demonstrated reproducible results without any change over three heating/cooling cycles ranging from 25 °C to 125 °C. This suggested good thermal stability in this temperature range.
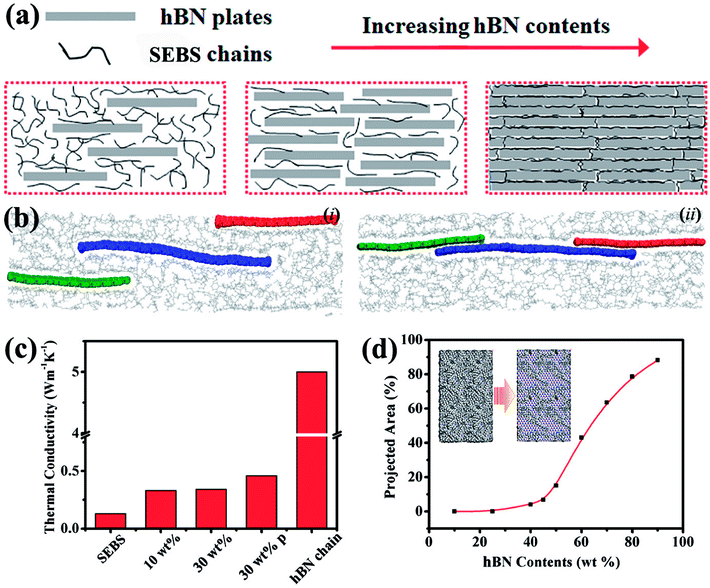
Thermal conduction in electrically insulated materials is dominated by a phonon transferring from a particle to its adjacent particles. The polymer matrix among these particles could be compared to a “river” to cross. It was thought that building a “bridge” was an ideal way to cross the river. The bridge was composed of many boards, where one could cross the river by jumping from one board to another. Thus, the construction of “bridges”, also called thermally conductive pathways, had a great effect on the heat transfer. As shown in Fig. 5a, when increasing the hBN content, more “floated wooden boards” were observed, which could slow down the jumping time and thus increase the thermal diffusivity, resulting a composite with higher thermal conductivity.
In the in-plane direction, a sudden jump happened in the thermal conductivity of the composites when they reached 40 wt% hBN loading; this value is the percolation threshold. This also depended on the filler' orientation.48 To account for the observed behavior, molecular dynamics simulations were performed to investigate the underlying mechanisms of the enhanced thermal conductivity. To simplify the calculation process and obtain the thermal conductivity enhancement trends qualitatively, the hBN sheets that were used in the simulation had a width of 2.5 nm and a length of 7.5 nm. The thermal conductivity was calculated to be 186 W m−1 K−1 with an rNEMD. The thermal conductivity of layered materials (including hBN) typically increased as the size increased. This resulted in the small-sized hBN having a smaller thermal conductivity than obtained from the experiments. Hence, the calculated thermal conductivity from the hBN-related systems did not map to the experimental results quantificationally, but only qualitatively.
The effects of the content and geometry configurations of hBN were investigated by calculating the thermal conductivity of various hBN/SEBS systems (Fig. 5c). The thermal conductivity of pure SEBS was 0.13 W m−1 K−1 when hBN was not present. When 10 wt% hBN was introduced into the SEBS matrix, the thermal conductivity increased to 0.33 W m−1 K−1. The hBN was separated from each other by SEBS (Fig. 5b(i)). When the content of hBN increased to 30 wt% while the hBN was isolated in the matrix, the thermal conductivity became 0.34 W m−1 K−1. The difference of 0.01 W m−1 K−1 was within statistical error. This suggested that a simple increment of the isolated hBN in the matrix would not sufficiently enhance the thermal conductivity of the hBN/SEBS systems. Nevertheless, the hBN in the matrix had the capability of connecting to each other to form an hBN chain for thermal conduction within the experiments. Hence, a model containing a thermal conduction chain formed by the 30 wt% hBN was constructed (Fig. 5b(ii)). The thermal conductivity increased markedly to 0.46 W m−1 K−1. With the content remaining at 30 wt%, the 35% enhancement of thermal conductivity indicated that the experimental observation of high thermal conductivity at high hBN content was a result of the establishment of heat-transfer networks. Since a previous study found that the heat was mainly conducted in the layered material in a composite,49 the thermal conductivity of the hBN chain could be estimated as about 5.01 W m−1 K−1 by calculating its volume. With continuously increasing the content of hBN to a very high content (such as 90 wt%), the thermal conductivity of the hBN/SEBS system should be around the value of the hBN chain with the size configurations in this simulation. It was now clear that the addition of a small amount hBN could significantly enhance the thermal conductivity. The thermal conductivity improved by a small amount when additional hBN was present before the construction of the heat-transfer networks. When the content was high enough to form heat-transfer networks, the corresponding thermal conductivity increased markedly. The possibility of forming the thermally conductive pathways by hBN was described quantitatively by calculating the corresponding relationship between the projected areas from the top-view occupied by hBN with its contents (Fig. 5d). The heat-transfer networks were established by this curve when the hBN content was greater than 40 wt%. This was in accordance with our experimental results about the thermal conductivity. A similar phenomenon was observed in the hBN/SEBS composites in the out-of-plane direction. However, the percolation in the out-of-plane direction was about 60 wt%, different from 40 wt% in the in-plane direction.
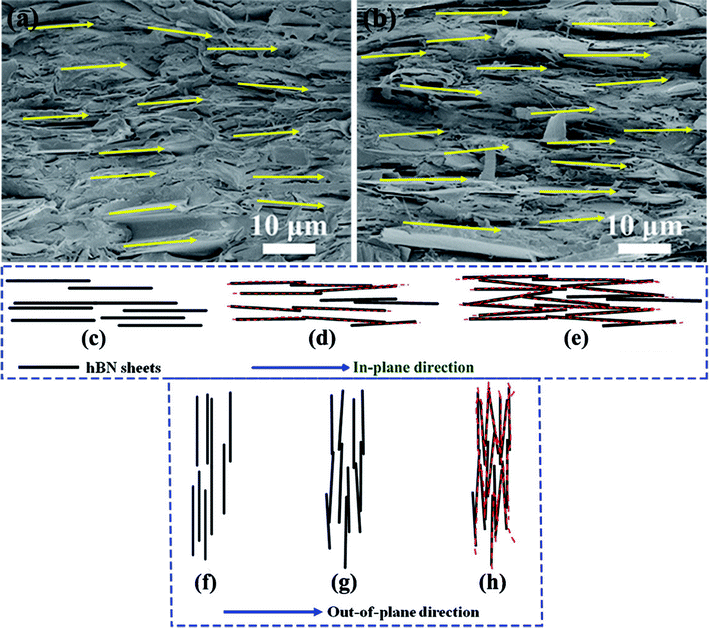
The difference in percolation in the in-plane direction and out-of-plane direction relied on the arrangement and orientation of hBN in the composite films. Since micro-sized hBN with a 2D plates structure was aligned in the composite films at all hBN loadings due to the hot-compression induced alignment, the fillers preferred to form thermally conductive pathways in the in-plane direction in this structure. This could be explained by the perfectly aligned hBN being tilted over slightly in the samples. As shown in the cross-sectional SEM images of 40 wt% and 60 wt% hBN/SEBS composite films (Fig. 6a and b), almost all the hBN was aligned in the in-plane direction. However, these 2D sheets were tilted over slightly more or less and the tilt angle was very small (revealed by the bright yellow arrow in the figures). To explain the mechanism of constructing thermally conductive pathways, the schematic models are exhibited in Fig. 6c–h. The perfectly aligned hBN structure was shown in Fig. 6c and f. The sheets were separated from each other in the matrix, and thus there was no thermally conductive pathways formed by the 2D fillers. The slight tilt of hBN induced contact between two sheets and thus several thermally conductive pathways were initially formed, as shown in the red dotted line in Fig. 6d. However, the slight tilt of hBN was not enough to form thermally conductive pathways in the out-of-plane direction at these hBN loadings (Fig. 6g). This indicated that a small amount of tilted hBN could facilitate the formation of thermally conductive pathways in the in-plane direction, but could not achieve this goal in the out-of-plane direction. With the further addition of hBN, thermally conductive pathways were constructed in the out-of-plane direction initially (Fig. 6h), with the numbers of thermally conductive pathways increasing in the in-plane direction simultaneously (Fig. 6e). This indicated that the formation of initial thermally conductive pathways needed a greater hBN content in the out-of-plane direction than that needed in the in-plane direction. Therefore, the percolation in the out-of-plane direction was higher than that in the in-plane direction theoretically. The percolation in the out-of-plane direction was about 60 wt%, while this value was about 40 wt% in the in-plane direction in the hBN/SEBS composites prepared by our method. This was in accordance with the theoretical trend.
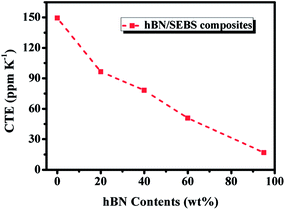
The dimensional stability of polymer composites has a great impact on the reliability of electronic devices and is indicated by CTE values. The linear CTE of hBN/SEBS composites along the alignment direction was tested by TMA. As shown in Fig. 7, the CTE values for the composites decreased with increasing the hBN loading. The CTE of pure SEBS was 149 ppm K−1, whereas that of the composites were 96 ppm K−1, 78 ppm K−1, 50 ppm K−1, and 16 ppm K−1 for 20 wt%, 40 wt%, 60 wt%, and 95 wt% loadings, respectively. This could be ascribed to the embedding of low expansion hBN effectively restricting the mobility of the polymer chains.50,51 Besides, since hBN possesses an anisotropic property (the in-plane CTE of hBN is as low as −2.7 ppm K−1, but the out-of-plane CTE is 38 ppm K−1),51,52 the alignment of hBN is more effective to limit the motion of the molecular chain of SEBS, especially along the alignment direction. The negative in-plane CTE of hBN also contributed to the CTE reduction of the composites.
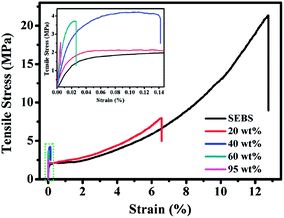
The mechanical properties of SEBS film and hBN/SEBS composite films with varying hBN loadings are shown in Fig. 8 and summarized in Table 2. Compared to pure SEBS film, the Young's modulus of the composites was enhanced, because the high filler-loaded and aligned hBN could efficiently resist deformation. However, the breaking stress and breaking strain were all found to decrease with increasing hBN loading. The breaking stress and breaking strain of pure SEBS were 21.4 ± 2.1 MPa and 12.779 ± 3.067%, respectively. These values decreased to 8.1 ± 0.5 MPa and 6.592 ± 0.751% at 20 wt% hBN loading, respectively. With the further addition of hBN, the breaking strain of the hBN/SEBS composites decreased and reached 0.142 ± 0.017%, 0.026 ± 0.003%, and 0.005 ± 0.0005% at 40 wt%, 60 wt%, and 95 wt% hBN loading. The corresponding breaking stress decreased slightly and reached 4.2 ± 0.2 MPa, 3.7 ± 0.2 MPa, and 2.6 ± 0.1 MPa, respectively. The reason for this decrease could be ascribed to the large aspect ratio of hBN and the alignment structure restricted the movement of the polymer chains, and this influence was more significant at a relatively higher filler loading.53 In addition, the concentration of stress at the hBN sheets increased at a higher hBN loading and led to the breaking of the composites during the stretching process.54
| Sample | Young's modulus (MPa) | Strain-at-break (%) | Stress-at-break (MPa) |
|---|---|---|---|
| SEBS | 72.8 ± 13.1 | 12.779 ± 3.067 | 21.4 ± 2.1 |
| 20 wt% hBN/SEBS | 88.4 ± 10.1 | 6.592 ± 0.751 | 8.1 ± 0.5 |
| 40 wt% hBN/SEBS | 176 ± 12 | 0.142 ± 0.017 | 4.2 ± 0.2 |
| 60 wt% hBN/SEBS | 313 ± 31 | 0.026 ± 0.003 | 3.7 ± 0.2 |
| 95 wt% hBN/SEBS | 636 ± 81 | 0.005 ± 0.0005 | 2.6 ± 0.1 |
The heat-dissipation property of the as-made hBN/SEBS composite film was evaluated by using a CPU connected to a computer. The CPU output power was fixed at 60%. The tested sample strip was 20 mm (length) × 20 mm (width) × 0.25 mm (thickness) and set on the same CPU for 3200 s. The samples were heated from room temperature to ensure that the CPU temperature reached a steady state for comparison. The ambient temperature remained stable at 25 °C during the experiment. Table 3 illustrated the stable temperatures of pure SEBS and 95 wt% hBN/SEBS composites. For the SEBS-embedded CPU device, the temperature of the CPU reached about 58 °C. On the other hand, the 95 wt% hBN/SEBS composite film exhibited a significantly improved thermal dissipation property. After 3200 s, the hBN/SEBS-based CPU stabilized at about 54 °C. The typical temperature variation of the working CPU is shown in Fig. S2.† These results confirmed the excellent heat-dissipation ability of the hBN/SEBS composite film.
| Stable temperature/°C | |||||
|---|---|---|---|---|---|
| a Tp represents the stable temperature of pure SEBS; Tc represents the stable temperature of the 95 wt% hBN/SEBS composites; ΔT represents the decrease in stable temperature from pure SEBS to the 95 wt% hBN/SEBS composites. | |||||
| Tp | 58.1 | 58.2 | 57.8 | 57.9 | 58.0 |
| Tc | 54.2 | 54.3 | 54.0 | 53.8 | 53.8 |
| ΔT | 3.9 | 3.9 | 3.8 | 4.1 | 4.2 |
Conclusions
In summary, hBN oriented in the SEBS matrix at a large range of filler loadings (0–95 wt%) was achieved via a hot pressing-induced alignment. The as-prepared SEBS composite films exhibited a superior thermal conductivity of about 45 W m−1 K−1 at 95 wt% hBN loading. The CTE values for the composites decreased with increasing the hBN loading. The Young's modulus of the composites was enhanced while the corresponding breaking stress and breaking strain decreased with the increasing addition of hBN loading. Based on the controlled structure in the composites at this filler loading ranges, the heat-transfer mechanism was demonstrated in detail by schematic models and molecular dynamics simulations. The percolation threshold was discovered in the in-plane (40 wt%) and out-of-plane (60 wt%) directions. This was instructive to study the thermal performance of composites.Conflicts of interest
There are no conflicts of interest to declare.Acknowledgements
This work was supported by the National Key R&D Program of China (No. 2017YFB0406000), the Key Research Program of Frontier Science of Chinese Academy of Sciences (No. QYZDB-SSW-SLH031), the Thousand Youth Talents Plan, the Postdoctoral Foundation of China (No. 2016M601905 and 2017M621855), the Natural Science Foundation of Jiangsu Province, China (No. BK20160399), the Postdoctoral Foundation of Jiangsu Province (No. 1601065B), and the Science and Technology Project of Nanchang (2017-SJSYS-008).References
- H. Zhu, Y. Li, Z. Fang, J. Xu, F. Cao, J. Wan, C. Preston, B. Yang and L. Hu, ACS Nano, 2014, 8, 3606–3613 CrossRef PubMed.
- W. Meng, Y. Huang, Y. Fu, Z. Wang and C. Zhi, J. Mater. Chem. C, 2014, 2, 10049–10061 RSC.
- J. Chen, X. Huang, Y. Zhu and P. Jiang, Adv. Funct. Mater., 2017, 27, 1604754 CrossRef.
- X. Zeng, L. Ye, S. Yu, H. Li, R. Sun, J. Xu and C. P. Wong, Nanoscale, 2015, 7, 6774–6781 RSC.
- Z. Kuang, Y. Chen, Y. Lu, L. Liu, S. Hu, S. Wen, Y. Mao and L. Zhang, Small, 2015, 11, 1655–1659 CrossRef PubMed.
- Y. Xu and D. D. L. Chung, Compos. Interfaces, 2000, 7, 243–256 CrossRef.
- Y. Xu, D. D. L. Chung and C. Mroz, Composites, Part A, 2001, 32, 1749–1757 CrossRef.
- J. Xia, J. Li, G. Zhang, X. Zeng, F. Niu, H. Yang, R. Sun and C. Wong, Composites, Part A, 2016, 80, 21–27 CrossRef.
- C. P. Wong and R. S. Bollampally, J. Appl. Polym. Sci., 1999, 74, 3396–3403 CrossRef.
- L. Fu, T. Wang, J. H. Yu, W. Dai, H. Sun, Z. Liu, R. Sun, N. Jiang, A. Yu and C. T. Lin, 2D Mater., 2017, 4, 025047 CrossRef.
- D. Golberg, Y. Bando, Y. Huang, T. Terao, M. Mitome, C. Tang and C. Zhi, ACS Nano, 2010, 4, 2979–2993 CrossRef PubMed.
- C. Zhi, Y. Bando, T. Terao, C. Tang, H. Kuwahara and D. Golberg, Adv. Funct. Mater., 2009, 19, 1857–1862 CrossRef.
- W. L. Song, P. Wang, L. Cao, A. Anderson, M. J. Meziani, A. J. Farr and Y. P. Sun, Angew. Chem., Int. Ed., 2012, 51, 6498–6501 CrossRef PubMed.
- F. Yuan, W. C. Jiao, F. Yang, W. B. Liu, Z. H. Xu and R. G. Wang, RSC Adv., 2017, 7, 43380–43389 RSC.
- O. S. Kwon, D. Lee, S. P. Lee, Y. G. Kang, N. C. Kim and S. H. Song, RSC Adv., 2016, 6, 59970–59975 RSC.
- A. Permal, M. Devarajan, H. L. Hung, T. Zahner, D. Lacey and K. Ibrahim, J. Mater. Sci., 2016, 51, 7415–7426 CrossRef.
- F. F. Wang, Y. M. Yao, X. L. Zeng, T. Huang, R. Sun, J. B. Xu and C. P. Wong, RSC Adv., 2016, 6, 41630–41636 RSC.
- X. Zeng, J. Sun, Y. Yao, R. Sun, J. Xu and C. P. Wong, ACS Nano, 2017, 11, 5167–5178 CrossRef PubMed.
- X. Huang, C. Zhi, P. Jiang, D. Golberg, Y. Bando and T. Tanaka, Adv. Funct. Mater., 2013, 23, 1824–1831 CrossRef.
- Z. Lin, Y. Liu, S. Raghavan, K. S. Moon, S. K. Sitaraman and C. P. Wong, ACS Appl. Mater. Interfaces, 2013, 5, 7633–7640 CrossRef PubMed.
- H. Shen, J. Guo, H. Wang, N. Zhao and J. Xu, ACS Appl. Mater. Interfaces, 2015, 7, 5701–5708 CrossRef PubMed.
- C. Yuan, B. Duan, L. Li, B. Xie, M. Huang and X. Luo, ACS Appl. Mater. Interfaces, 2015, 7, 13000–13006 CrossRef PubMed.
- H. S. Lim, J. W. Oh, S. Y. Kim, M. J. Yoo, S. D. Park and W. S. Lee, Chem. Mater., 2013, 25, 3315–3319 CrossRef.
- X. Zeng, Y. Yao, Z. Gong, F. Wang, R. Sun, J. Xu and C. P. Wong, Small, 2015, 11, 6205–6213 CrossRef PubMed.
- T. Morishita and H. Okamoto, ACS Appl. Mater. Interfaces, 2016, 8, 27064–27073 CrossRef PubMed.
- H.-B. Cho, T. Nakayama, Y. Tokoi, S. Endo, S. Tanaka, T. Suzuki, W. Jiang, H. Suematsu and K. Niihara, Compos. Sci. Technol., 2010, 70, 1681–1686 CrossRef.
- J. Gu, C. Liang, J. Dang, W. Dong and Q. Zhang, RSC Adv., 2016, 6, 35809–35814 RSC.
- X. Yang, L. Tang, Y. Guo, C. Liang, Q. Zhang, K. Kou and J. Gu, Composites, Part A, 2017, 101, 237–242 CrossRef.
- X. Yang, Y. Guo, X. Luo, N. Zheng, T. Ma, J. Tan, C. Li, Q. Zhang and J. Gu, Compos. Sci. Technol., 2018, 164, 59–64 CrossRef.
- Y. Li, G. Xu, Y. Guo, T. Ma, X. Zhong, Q. Zhang and J. Gu, Composites, Part A, 2018, 107, 570–578 CrossRef.
- Y. Yao, X. Zeng, F. Wang, R. Sun, J. Xu and C. P. Wong, Chem. Mater., 2016, 28, 1049–1057 CrossRef.
- C. Yu, J. Zhang, Z. Li, W. Tian, L. Wang, J. Luo, Q. Li, X. Fan and Y. Yao, Composites, Part A, 2017, 98, 25–31 CrossRef.
- R. M. Erb, R. Libanori, N. Rothfuchs and A. R. Studart, Science, 2012, 335, 199–204 CrossRef PubMed.
- S. Plimpton, J. Comput. Phys., 1995, 117, 1–19 CrossRef.
- S. J. Stuart, A. B. Tutein and J. A. Harrison, J. Chem. Phys., 2000, 112, 6472–6486 CrossRef.
- A. Kınacı, J. B. Haskins, C. Sevik and T. Çağın, Phys. Rev. B, 2012, 86, 115410 CrossRef.
- F. Müller-Plathe, J. Chem. Phys., 1997, 106, 6082–6085 CrossRef.
- Y. Tang, W. Dong, L. Tang, Y. Zhang, J. Kong and J. Gu, Compos. Commun., 2018, 8, 36–41 CrossRef.
- J. Gu, W. Dong, Y. Tang, Y. Guo, L. Tang, J. Kong, S. Tadakamalla, B. Wang and Z. Guo, J. Mater. Chem. C, 2017, 5, 6929–6936 RSC.
- S. Berber, Y. K. Kwon and D. Tománek, Phys. Rev. Lett., 2000, 84, 4613–4616 CrossRef PubMed.
- X. B. Wang, Q. Weng, X. Wang, X. Li, J. Zhang, F. Liu, X. F. Jiang, H. Guo, N. Xu, D. Golberg and Y. Bando, ACS Nano, 2014, 8, 9081–9088 CrossRef PubMed.
- R. C. Zhang, D. Sun, A. Lu, S. Askari, M. Macias-Montero, P. Joseph, D. Dixon, K. Ostrikov, P. Maguire and D. Mariotti, ACS Appl. Mater. Interfaces, 2016, 8, 13567–13572 CrossRef PubMed.
- J. Yu, H. Mo and P. Jiang, Polym. Adv. Technol., 2015, 26, 514–520 CrossRef.
- T. Morishita and H. Okamoto, ACS Appl. Mater. Interfaces, 2016, 8, 27064–27073 CrossRef PubMed.
- J. C. Zheng, L. Zhang, A. V. Kretinin, S. V. Morozov, Y. B. Wang, T. Wang, X. Li, F. Ren, J. Zhang, C. Y. Lu, J. C. Chen, M. Lu, H. Q. Wang, A. K. Geim and K. S. Novoselov, 2D Mater., 2016, 3, 011004 CrossRef.
- L. Fu, T. Wang, J. Yu, W. Dai, H. Sun, Z. Liu, R. Sun, N. Jiang, A. Yu and C. T. Lin, 2D Mater., 2017, 4, 025047 CrossRef.
- X. Zeng, L. Ye, S. Yu, H. Li, R. Sun, J. Xu and C. P. Wong, Nanoscale, 2015, 7, 6774–6781 RSC.
- Z. Kuang, Y. Chen, Y. Lu, L. Liu, S. Hu, S. Wen, Y. Mao and L. Zhang, Small, 2015, 11, 1655–1659 CrossRef PubMed.
- L. Hu, T. Desai and P. Keblinski, J. Appl. Phys., 2011, 110, 033517 CrossRef.
- C. Zhi, Y. Bando, C. Tang, H. Kuwahara and D. Golberg, Adv. Mater., 2009, 21, 2889–2893 CrossRef.
- Z. Lin, Y. Liu, S. Raghavan, K. S. Moon, S. K. Sitaraman and C. P. Wong, ACS Appl. Mater. Interfaces, 2013, 5, 7633–7640 CrossRef PubMed.
- X. Zeng, Y. Yao, Z. Gong, F. Wang, R. Sun, J. Xu and C. P. Wong, Small, 2015, 11, 6205–6213 CrossRef PubMed.
- J. T. Kim, B. K. Kim, E. Y. Kim, S. H. Kwon and H. M. Jeong, Eur. Polym. J., 2013, 49, 3889–3896 CrossRef.
- X. Zhao, Q. Zhang, D. Chen and P. Lu, Macromolecules, 2010, 43, 2357–2363 CrossRef.
Footnote |
| † Electronic supplementary information (ESI) available. See DOI: 10.1039/c8ra04700f |
| This journal is © The Royal Society of Chemistry 2018 |

