 Open Access Article
Significant improvement in TiO2 photocatalytic activity through controllable ZrO2 deposition†
Xiaofeng Wang ,
Rajankumar L. Patel‡
 and
Xinhua Liang
 *
*
Department of Chemical and Biochemical Engineering, Missouri University of Science and Technology, Rolla, MO 65409, USA
First published on 18th July 2018
Abstract
ZrO2 was deposited on anatase TiO2 nanoparticles using 5–80 cycles of atomic layer deposition (ALD). The photocatalytic activity of all samples was evaluated based on the degradation of methylene blue (MB) solution under UV light. The TiO2 sample with 45 cycles of ZrO2 deposition (45c-Zr/TiO2, 1.1 wt% ZrO2) was proved to be the most efficient catalyst with a degradation kinetic constant 10 times larger than that of the pure TiO2 sample. All samples were characterized using inductively coupled plasma atomic emission spectroscopy (ICP-AES), nitrogen adsorption–desorption, X-ray diffraction (XRD), transmission electron microscopy (TEM), UV-vis diffuse reflectance spectra analysis (UV-DRS), Raman and photoluminescence (PL) techniques. The high photocatalytic activity of 45c-Zr/TiO2 can be attributed to stronger adsorption in the ultraviolet region and a reduction in the recombination rate of electron/hole pairs.
1. Introduction
Nowadays, TiO2 has been widely studied as an effective photocatalyst for the degradation of organic pollutants due to its relatively high activity, chemical stability, nontoxicity and low cost.1 However, the high recombination rate of photo-generated electrons (e−) and holes (h+) and slow reaction rate of pure TiO2 have hindered its further application. Thus, the photocatalytic efficiency of TiO2 needs to be further improved for practical and commercial use.2It is well known that ZrO2 is an n-type semiconductor with similar physico-chemical properties to those of TiO2,3 and therefore it has been used to prepare ZrO2 doped TiO2 photocatalysts because of these similar properties in order to improve the photocatalytic activity of TiO2.3,4 Through ZrO2 doping, the band gap of the photocatalyst increases and the recombination rate subsequently decreases, which leads to an improvement of the photocatalytic activity. However, almost all previous studies adopted sol–gel and other similar methods to prepare ZrO2/TiO2, as shown in Table S1,† and thereby the crystal structure and phase composition of the samples were changed due to the mixture of Zr and Ti precursors. High ZrO2 content would lead to poor anatase crystallinity of TiO2 and decrease the photocatalytic efficiency; in contrast, ZrO2 loading that is too low does not ensure an obvious increase in the band gap, and thereby the e−/h+ recombination rate cannot be reduced effectively. Thus, the enhancement of TiO2 photocatalytic performance by ZrO2 doping is restricted, and solving this dilemma is the key to further improving the activity of ZrO2/TiO2.
In this work, we deposited ZrO2 on anatase TiO2 nanoparticles (NPs) via different numbers of cycles (5–80) of atomic layer deposition (ALD) to investigate the effect of ZrO2 in the photocatalytic degradation of methylene blue (MB). The samples were labeled xc-Zr/TiO2, where x refers to the number of cycles of ZrO2. ALD is a surface controlled layer-by-layer coating process based on self-limiting surface reactions, and it has been utilized to deposit uniform metal oxide films with sub-nanometer control of film thickness and well controlled film compositions.5 Through making full use of the advantages of ALD, the ZrO2 content was controlled at a low level to retain the anatase crystallinity of TiO2 and the e−/h+ recombination rate decreased due to the high dispersion of ZrO2 on the surface of TiO2.
2. Experimental section
2.1. Preparation of ZrO2/TiO2 nanoparticles
ZrO2 was deposited on TiO2 NPs via ALD using tetrakis(dimethylamido)zirconium(IV) (TDMAZ) (electronic grade, ≥99.99%, Sigma-Aldrich) and deionized water as precursors in a fluidized bed reactor, as described in detail elsewhere.6 Anatase TiO2 NPs with an average particle size of 20 nm were purchased from US Research Nanomaterials Inc. For a typical run, 5 g of TiO2 NPs was loaded into the reactor. The reaction temperature was 250 °C. Before the reaction, the particles were first degassed at 250 °C for 3 hours. The particle substrates were fully fluidized with a gas flow rate controlled with mass flow controllers. N2 was used as a flush gas to remove unreacted precursors and any byproducts during the reaction. A typical half deposition cycle used the following sequence: precursor dose, N2 purge and evacuation. This sequence was repeated alternately for both precursors. 5 (5c-Zr/TiO2), 25 (25c-Zr/TiO2), 45 (45c-Zr/TiO2), 60 (60c-Zr/TiO2), and 80 (80c-Zr/TiO2) cycles of ZrO2 ALD were applied on anatase TiO2 NPs.2.2. Characterization
Inductively coupled plasma-atomic emission spectroscopy (ICP-AES) was used to measure the Zr mass fraction in the ZrO2/TiO2 samples. The surface area of the pure TiO2 and ZrO2-deposited TiO2 NPs was calculated using the Brunauer–Emmett–Teller (BET) method in a relative pressure range (0.05–0.25) of nitrogen adsorption and desorption isotherms obtained using a Quantachrome Autosorb-1. The photoluminescence (PL) spectra were recorded with a HORIBA FL3-22 spectrometer (HORIBA, Edison, NJ) to evaluate the recombination rate of e−/h+ pairs in the samples. The morphology of ZrO2 deposited on TiO2 was directly observed using FEI Tecnai F20 transmission electron microscopy/energy-dispersive X-ray spectroscopy (TEM/EDS). The crystal structure of the TiO2 and ZrO2/TiO2 samples was analyzed with X-ray diffraction (XRD), and the Raman spectra of the samples were recorded using a Horiba-Jobin Yvon LabRam spectrometer. UV-visible absorbance and diffuse reflectance spectra (DRS) of TiO2 and ZrO2/TiO2 samples were obtained with a UV-visible spectrophotometer (Varian Cary 5). BaSO4 was used as an absorbance standard. Details of the characterization are described in the ESI.†2.3. Photocatalytic activity measurement
Degradation of MB was used to evaluate the photocatalytic performance of the TiO2 and ZrO2/TiO2 samples, as described in detail previously.7 Briefly, 0.1 g of sample was added to a 100 ml, 10 ppm MB solution. First, the solution was stirred in the dark for 60 min to ensure adsorption/desorption equilibrium. Then, the solution was irradiated using a UV lamp (360 nm UV light) and about 1 ml test sample was collected from the main solution at certain time intervals and filtered through a Millipore filter to make it particle-free for analysis using a UV-vis spectrometer (Varian Cary 50-Bio) at a 664 nm wavelength.8 The change in concentration of MB in the main solution was recorded over a period of irradiation time.3. Results and discussion
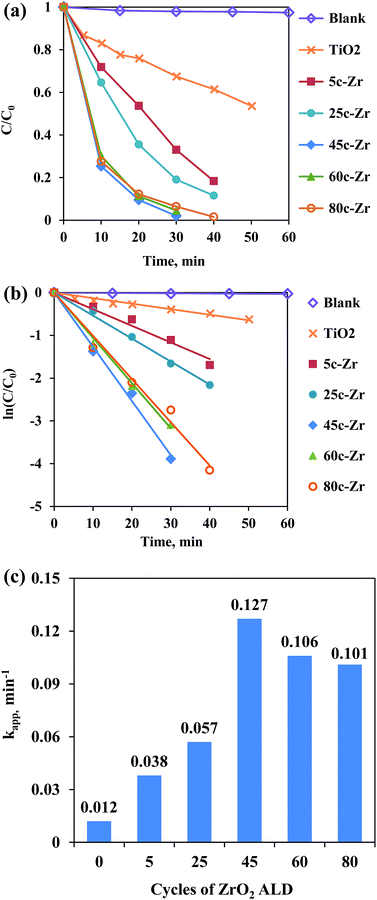
As shown in Fig. 1, the photodegradation efficiency of all ZrO2/TiO2 samples was higher than that of the pure TiO2, and with an increasing number of ALD cycles, the photoactivity of the samples kept increasing below 45 ALD cycles of ZrO2, then it decreased slightly with further increases in the number of ALD cycles. According to the Langmuir–Hinshelwood kinetic equation (pseudo-first-order reaction),9 the apparent kinetic constant (kapp) of the 45c-Zr/TiO2 sample reached a maximum value (0.127 min−1), and its activity exceeded that of pure TiO2 (0.012 min−1) by a factor of more than ten. As shown in Table S1,† Pt ALD and CeO2 ALD have been applied to the improvement of TiO2 photoactivity, and they showed, at most, only a 3.0 and 3.3 times increase in photocatalytic activity compared to that of pure TiO2, respectively.7,10 More importantly, ZrO2 is much cheaper and more economical for large-scale production compared to Pt. Compared to previously reported ZrO2/TiO2 photocatalysts,4 the ALD prepared 45c-Zr/TiO2 sample improved the photocatalytic activity of pure TiO2 significantly, which proved that ZrO2 ALD was one promising strategy to enhance ZrO2/TiO2 photocatalytic performance (Table S1†). The reasons for the much higher photoactivity of 45c-Zr/TiO2 than that of TiO2 in this work were investigated.Firstly, the ZrO2 ALD process did not affect the bulk properties of the TiO2 NPs (e.g., crystal structure and surface area). As shown in Fig. 2, the ZrO2 content of the samples increased steadily (from 0 to 1.5 wt%) with an increasing number of ALD cycles. This is one characteristic of the ALD process. This indicates a constant growth rate of ZrO2. The ZrO2 loading was 0.1, 0.5, 1.1, 1.2 and 1.5 wt% in 5c-Zr/TiO2, 25c-Zr/TiO2, 45c-Zr/TiO2, 60c-Zr/TiO2, and 80c-Zr/TiO2 samples, respectively. Since the loading of ZrO2 deposited on the TiO2 NPs was very low, it did not lead to an increase in particle size (decrease of surface area) or poor anatase crystallinity, which would affect the photocatalytic efficiency of the samples. In order to verify this hypothesis, the BET surface area and crystal structure of all samples were analyzed. The BET surface area remained almost constant (∼70 m2 g−1) even after 80 cycles of ZrO2 ALD (Fig. 2). The large surface area can provide a lot of surface sites for the adsorption of reactant molecules.
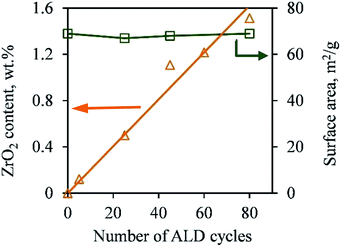 | ||
| Fig. 2 ZrO2 content and BET surface area of pure TiO2 nanoparticles and TiO2 nanoparticles deposited with ZrO2 over different numbers of cycles of ALD. | ||
Moreover, based on calculation, 1 g of 80c-Zr/TiO2 contained 0.015 g ZrO2 (5.68 g cm−3) and the thickness of ZrO2 should be around 0.038 nm (0.015/5.68/70 × 1000 nm) if ZrO2 formed as a film on the TiO2 NPs.11 The thickness is much thinner than that of a real layer of ZrO2 (>0.1 nm). Thus, ZrO2 was highly dispersed on TiO2 without forming a film. As shown in Fig. 3, the TEM images of 45c-Zr/TiO2 and 80c-Zr/TiO2 are similar to that of pure anatase TiO2 NPs, and the lattice fringes of 0.35 nm, 0.24 nm, and 0.19 nm correspond to the (101), (004), and (200) planes of anatase, respectively.12 No ZrO2 film was observed, but the ICP-AES (Fig. 2) and EDS (Fig. S1†) verified the existence of Zr on the TiO2. It seems that ZrO2 ALD follows an island growth mechanism (Volmer–Weber mechanism) during the initial stages of the ALD process, which could be similar to that of some metal ALD processes.13
As presented in Fig. 4, the XRD patterns of all samples show peaks appearing at 2θ = 25.3°, 37.8°, 48.1°, 53.9°, 55.2°, 62.8° and 75.2°, corresponding to the diffraction patterns of (101), (004), (200), (105), (211), (204) and (215), respectively, of the pure tetragonal phase of anatase TiO2.14 There was no significant difference in any sample. The TiO2 in all samples retained the anatase structure after ZrO2 ALD and no peak corresponded to reflections from ZrO2, which could be due to the low loading and amorphous structure of ZrO2 on TiO2. According to the XRD analysis, the TiO2 crystal size was around 19 nm for all samples, which is close to the actual particle size of TiO2 (∼20 nm). Raman analysis was also performed, and all samples showed three major Raman bands at 397, 517, and 640 cm−1 (Fig. 5), which are attributed to the Raman-active modes of the TiO2 anatase phase with symmetries of B1g, A1g, and Eg, respectively.15 Thus, our hypothesis that the surface area and anatase crystallinity of TiO2 did not change after the ALD process was proved.
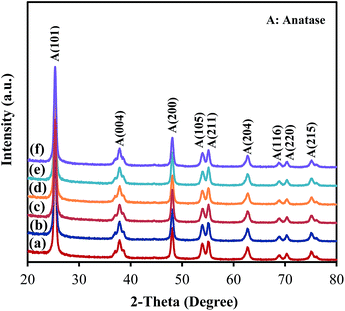 | ||
| Fig. 4 XRD patterns of (a) TiO2, (b) 5c-Zr/TiO2, (c) 25c-Zr/TiO2, (d) 45c-Zr/TiO2, (e) 60c-Zr/TiO2 and (f) 80c-Zr/TiO2. | ||
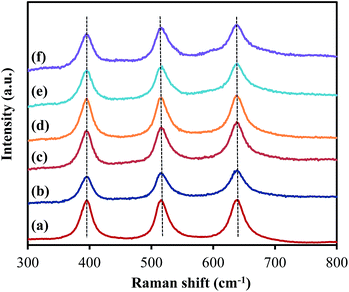 | ||
| Fig. 5 Raman spectra of (a) TiO2, (b) 5c-Zr/TiO2, (c) 25c-Zr/TiO2, (d) 45c-Zr/TiO2, (e) 60c-Zr/TiO2 and (f) 80c-Zr/TiO2. | ||
Secondly, a larger band gap corresponds to stronger redox ability, which leads to a reduction in the e−/h+ recombination rate and an improvement in photocatalytic activity. Since the band gap of ZrO2 is around 4.6 eV and is larger than that of anatase TiO2 (3.2 eV),16 the band gap of ZrO2/TiO2 samples was enlarged after ZrO2 ALD.17 As shown in Fig. 6, S2 and S3,† the band gap of the samples kept increasing along with increasing numbers of ALD cycles, which is consistent with previous reports.4d,18 Because the photocatalytic degradation process can be considered an electrochemical cell, the increase in band gap results in an enhanced oxidation–reduction potential.19 However, the photocatalytic activity of 60c-Zr/TiO2 and 80c-Zr/TiO2 was lower than that of 45c-Zr/TiO2, despite the band gaps of 60c-Zr/TiO2 and 80c-Zr/TiO2 being larger than that of the 45c-Zr/TiO2 sample. This can be explained by samples with too large a band gap being unable to take full advantage of UV light and therefore being unable to generate enough e− and h+ pairs for MB degradation.
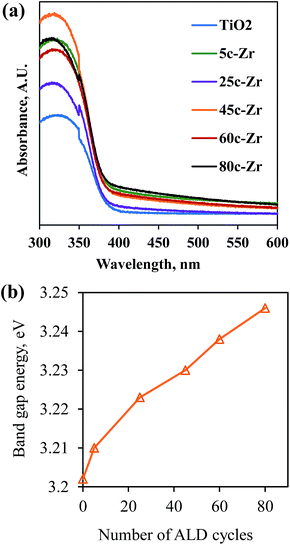 | ||
| Fig. 6 (a) UV-visible absorption spectra, and (b) the band gap energy of the TiO2 and ZrO2/TiO2 samples. | ||
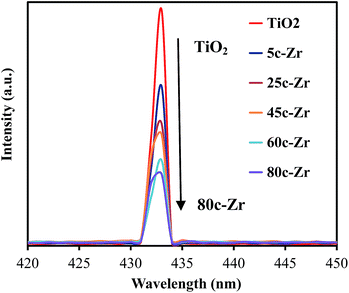
Thirdly, there is a fast transfer of the photo-formed electrons from the conduction band (CB) of ZrO2 to that of TiO2, when ZrO2 was deposited on TiO2 under UV irradiation, since the bottom of the CB edge of ZrO2 is about 1.3 eV, which is higher than that of TiO2.4d,16 This electron transfer prevented radiative electron/hole recombination and thereby improved the photocatalytic activity of the 45c-Zr/TiO2 sample. In order to evaluate the separation rate of the e−/h+ pairs, photoluminescence (PL) analysis was carried out. As shown in Fig. 7, there is only one peak at 433 nm, corresponding to the reflection from the anatase phase of TiO2. No other peak was observed in the wavelength range of 300–600 nm. With an increase in the number of ZrO2 ALD cycles, the PL intensity decreased greatly, which indicated that the separation efficiency of the e−/h+ pairs was enhanced for the ZrO2/TiO2 samples. In other words, the existence of ZrO2 helped trap the photo-generated charge carriers and inhibited the recombination of the e−/h+ pairs. As shown in Fig. 8, e− and h+ separation may occur between TiO2 and ZrO2 in ZrO2/TiO2 since the energy level of TiO2, for both the valence band (VB) and CB, falls within the band gap of ZrO2. When the electrons were generated from TiO2 and ZrO2, most of the electrons from the CB of ZrO2 automatically drifted to the CB of TiO2. Therefore, the e−/h+ pair recombination could be inhibited and the photocatalytic activity improved. All factors mentioned above worked collectively and resulted in improved photocatalytic activity of 45c-Zr/TiO2.
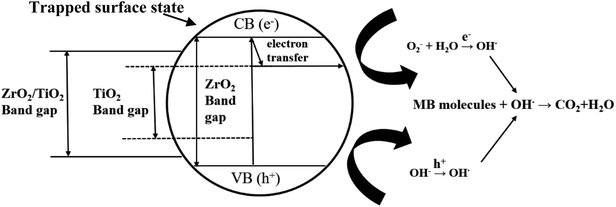 | ||
| Fig. 8 Proposed mechanism for the photoexcited electron–hole separation and transport processes at the ZrO2/TiO2 interface under UV irradiation. | ||
It was also noted that the TiO2 catalyst containing 1.1 wt% ZrO2 (45c-Zr/TiO2) enhanced the photocatalytic activity the most and it was the optimal amount of deposition for the degradation of MB in this study. However, the optimal ZrO2 amount is not consistent with that reported in the literature, which reported that the optimal ZrO2 loading was more than 5%. This could be due to the different preparation methods for the ZrO2/TiO2 samples.4a–c Higher optimal ZrO2 loading was needed via traditional ZrO2 doping methods because some ZrO2 was inserted into the interior matrix of the TiO2 particles and could not work with TiO2 synergistically. In contrast, in this study, ZrO2 was highly dispersed on the surface of TiO2 NPs via ALD and thereby the optimal ZrO2 content was significantly lower. On the other hand, the enlarged band gap of the ZrO2/TiO2 samples in this work becomes a limitation and hinders their practical applications under visible light, although ZrO2 deposition improved the photocatalytic performance of anatase TiO2 under UV light. N,20 S,21 CeO222 and Au/Pd23 doped TiO2 catalysts have been reported, and they could decompose organic pollutants under visible light. It is vital and valuable to expand the practical use of TiO2-based photocatalysts. The optimization and enhancement of ZrO2/TiO2 photoactivity under visible light are being pursued by this group.
4. Conclusions
In summary, different numbers of cycles of ALD were used to deposit ZrO2 on TiO2 powders. The 45c-Zr/TiO2 catalyst showed the highest photocatalytic activity and had a more than ten-fold photocatalytic activity enhancement over pure TiO2 for the degradation of MB under UV light due to the fact that the fast electron transfer from the CB of ZrO2 to that of TiO2 prevented radiative electron/hole recombination. This factor worked collectively with another two factors, the maintained high surface area and the larger band gap of ZrO2/TiO2, and thus resulted in the significantly improved photocatalytic activity of the samples under UV light. ZrO2 ALD is a novel and effective strategy to significantly improve the photocatalytic activity of TiO2, and it is a potentially promising way to enhance the activity of other photocatalysts.Conflicts of interest
The authors declare no competing financial interest.Acknowledgements
Acknowledgment is made to the donors of the American Chemical Society Petroleum Research Fund for partial support of this research. The authors thank Dr Jingjing Qing at the Materials Research Center at Missouri University of Science and Technology for TEM analysis. The authors also thank Naveen K. Mahenderkar and Prof. Jay A. Switzer in the Department of Chemistry for their assistance with diffuse reflectance UV-vis measurement, and Prof. Richard Brow in the Department of Materials Science and Engineering for the assistance with Raman and photoluminescence analysis.Notes and references
- (a) M. R. Hoffmann, S. T. Martin, W. Choi and D. W. Bahnemann, Chem. Rev., 1995, 95, 69 CrossRef; (b) A. L. Linsebigler, G. Lu and J. T. Yates Jr, Chem. Rev., 1995, 95, 735 CrossRef; (c) Y. Wang, H. Cheng, Y. Hao, J. Ma, W. Li and S. Cai, J. Mater. Sci., 1999, 34, 3721 CrossRef; (d) M. Cao, P. Wang, Y. Ao, C. Wang, J. Hou and J. Qian, Chem. Eng. J., 2015, 264, 113 CrossRef; (e) R. Liu, P. Wang, X. Wang, H. Yu and J. Yu, J. Phys. Chem. C, 2012, 116, 17721 CrossRef.
- (a) X. Wang, T. Li, R. Yu, H. Yu and J. Yu, J. Mater. Chem. A, 2016, 4, 8682 RSC; (b) M. Cao, P. Wang, Y. Ao, C. Wang, J. Hou and J. Qian, J. Colloid Interface Sci., 2016, 467, 129 CrossRef PubMed.
- H. Liu, Y. Su, H. Hu, W. Cao and Z. Chen, Adv. Powder Technol., 2013, 24, 683 CrossRef.
- (a) Y. Gnatyuk, N. Smirnova, A. Eremenko and V. Ilyin, Adsorpt. Sci. Technol., 2005, 23, 497 CrossRef; (b) M. Li, X. Li, G. Jiang and G. He, Ceram. Int., 2015, 41, 5749 CrossRef; (c) B. Neppolian, Q. Wang, H. Yamashita and H. Choi, Appl. Catal., A, 2007, 333, 264 CrossRef; (d) X. Qu, D. Xie, L. Cao and F. Du, Ceram. Int., 2014, 40, 12647 CrossRef; (e) C. Sun, L. Liu, L. Qi, H. Li, H. Zhang, C. Li, F. Gao and L. Dong, J. Colloid Interface Sci., 2011, 364, 288 CrossRef PubMed.
- R. L. Puurunen, J. Appl. Phys., 2005, 97, 121301 CrossRef.
- X. Liang and R. L. Patel, Ceram. Int., 2014, 40, 3097 CrossRef.
- X. Wang, Y. Jin and X. Liang, Nanotechnology, 2017, 28, 505709 CrossRef PubMed.
- X. Wang, M. Bayan, M. Yu, D. Ludlow and X. Liang, Int. J. Environ. Sci. Technol., 2017, 14, 1825 CrossRef.
- K. Naeem and F. Ouyang, Phys. B, 2010, 405, 221 CrossRef.
- Y. Zhou, D. M. King, X. Liang, J. Li and A. W. Weimer, Appl. Catal., B, 2010, 101, 54 CrossRef.
- J. Cao, C. Rambo and H. Sieber, Ceram. Int., 2004, 30, 1967 CrossRef.
- H. B. Wu, H. H. Hng and X. W. D. Lou, Adv. Mater., 2012, 24, 2567 CrossRef PubMed.
- S. M. George, Chem. Rev., 2010, 110, 111 CrossRef PubMed.
- X. Wang, A. R. Donovan, R. L. Patel, H. Shi and X. Liang, J. Environ. Chem. Eng., 2016, 4, 3767 CrossRef.
- T. Cao, Y. Li, C. Wang, L. Wei, C. Shao and Y. Liu, Mater. Res. Bull., 2010, 45, 1406 CrossRef.
- G. Ramakrishna, A. K. Singh, D. K. Palit and H. N. Ghosh, J. Phys. Chem. B, 2004, 108, 4775 CrossRef.
- A. Kambur, G. S. Pozan and I. Boz, Appl. Catal., B, 2012, 115, 149 CrossRef.
- B. M. Pirzada, N. A. Mir, N. Qutub, O. Mehraj, S. Sabir and M. Muneer, Mater. Sci. Eng., B, 2015, 193, 137 CrossRef.
- C. Zuo, S. Dorris, U. Balachandran and M. Liu, Chem. Mater., 2006, 18, 4647 CrossRef.
- (a) R. Asahi, T. Morikawa, H. Irie and T. Ohwaki, Chem. Rev., 2014, 114, 9824 CrossRef PubMed; (b) G. Wang, X. Xiao, W. Li, Z. Lin, Z. Zhao, C. Chen, C. Wang, Y. Li, X. Huang and L. Miao, Nano Lett., 2015, 15, 4692 CrossRef PubMed; (c) Z. Li, F. Wang, A. Kvit and X. Wang, J. Phys. Chem. C, 2015, 119, 4397 CrossRef; (d) A. Eslami, M. M. Amini, A. R. Yazdanbakhsh, A. Mohseni-Bandpei, A. A. Safari and A. Asadi, J. Chem. Technol. Biotechnol., 2016, 91, 2693 CrossRef.
- (a) X. Yan, K. Yuan, N. Lu, H. Xu, S. Zhang, N. Takeuchi, H. Kobayashi and R. Li, Appl. Catal., B, 2017, 218, 20 CrossRef; (b) T. Boningari, S. N. R. Inturi, M. Suidan and P. G. Smirniotis, Chem. Eng. J., 2018, 339, 249 CrossRef; (c) S. M. El-Sheikh, G. Zhang, H. M. El-Hosainy, A. A. Ismail, K. E. O’Shea, P. Falaras, A. G. Kontos and D. D. Dionysiou, J. Hazard. Mater., 2014, 280, 723 CrossRef PubMed.
- D. Tomova, V. Iliev, A. Eliyas and S. Rakovsky, Sep. Purif. Technol., 2015, 156, 715 CrossRef.
- A. Cybula, G. Nowaczyk, M. Jarek and A. Zaleska, J. Nanomater., 2014, 2014, 2 Search PubMed.
Footnotes |
| † Electronic supplementary information (ESI) available: Data on photocatalytic activity, Raman and UV-visible diffuse reflectance data and a comparison of the photocatalytic activity of various photocatalysts. See DOI: 10.1039/c8ra03423k |
| ‡ Current address: Energy and Environmental Directorate, Pacific Northwest National Laboratory, Richland, Washington 99354, USA. |
| This journal is © The Royal Society of Chemistry 2018 |

