 Open Access Article
Walnut-structure Si–G/C materials with high coulombic efficiency for long-life lithium ion batteries†
Chengmao Xiao,
Peng He *,
Jianguo Ren*,
Min Yue,
Youyuan Huang and
Xueqin He
BTR New Energy Materials Inc, Shenzhen 518106, P. R. China. E-mail: hepeng@btrchina.com; renjianguo@btrchina.com
First published on 2nd August 2018
Abstract
Nano-sized silicon is a potential high energy density anode material for lithium ion batteries. However, the practical use of a nano-Si anode is still challenging due to its low coulombic efficiency, poor scalability and cycling stability. Herein, a Si/graphite/carbon (Si–G/C) composite with a core–shell structure was fabricated by a facile two-step chemical process, stirring–evaporating followed by heat treatment. The composite structure consists of a graphite core, coated first by silicon and then amorphous carbon, which was decomposed by pitch. The as-prepared Si–G/C composite anode demonstrates a first cycle capacity of about 650 mA h g−1, over 90% coulombic efficiency, and high capacity retention of 96.7% after 50 cycles. When paired with a commercial NCA cathode, superior cycling stability with more than 81% capacity retention was achieved for 1200 cycles. These results demonstrate that such a core–shell Si–G/C composite is a promising anode material for high energy Li-ion batteries.
1. Introduction
With the increasing demands for powering mobile and electric vehicles for long life driving, there has been extensive research on the development of new materials for high energy density and long life lithium ion batteries (LIBs). Silicon (Si) has been regarded as one of the most promising anode materials for the next-generation lithium ion battery, due to its high theoretical specific capacity (∼4200 mA h g−1) and abundance on earth.1–3 However, there are several scientific and technical challenges for Si anodes,4–7 such as the huge volume change during lithium insertion, which is up to 300%. The stress induced by the volume change leads to cracks and pulverization of silicon, and peeling off the electrodes, finally accompanied by irreversible capacity loss. Another challenge for Si anodes is the relatively low coulombic efficiency, which is related to the unstable solid electrolyte interface (SEI). The repetitive volume expansion and contraction constantly shift the interface between Si and the electrolyte, preventing the formation of a stable SEI.8,9 Besides, Si anodes always require good electrical contact between Si material and the current collector during lithium insertion and extraction.Many studies have demonstrated that using nano-structured Si materials,10–14,32–34 such as nano-particles,32 nanowires, and nanotubes, would be effective ways to solve the problems above by relieving strain. Among them, Si nanoparticles are the most promising and show excellent performance, and the synthesis of Si nanoparticles is relatively cheap and scalable compared with other Si nano-structures.15 Si nanoparticles have been industrialized for a few years, regardless of their relative high cost compared to graphite.16
As for the practical application of silicon, it demands some important characteristics, such as low cost, acceptable capacity (400–1000 mA h g−1), and high coulombic efficiency (CE) during cycles.17 The requirement of high CE is very important especially when the silicon anode was used in the full cell (e.g., LiCoO2 versus Si–C).18 The first coulombic efficiency (ICE) of anode materials should be as high as possible, otherwise it will consume Li+ provided by the cathode in practical application, which leads to the unstable cycle performance.19 Among all the anode materials, graphite shows the highest first coulombic efficiency (92–94%),20–22 thus combining of silicon and graphite is an effective way to realize the high coulombic efficiency. In the Si-graphite composite, the graphite offers high electrical conductivity to the electrode components and enhances the initial coulombic efficiency while mitigating the electrode volume expansion. A lot of Si–G/C composites23–29 have been applied as industrial anode materials. Min Li et al.23 reported a core–shell structure Si–G–C composite synthesized by spray-drying/pyrolysis synthesis, which demonstrated an initial capacity of 723.8 mA h g−1 and a reversible capacity of approximately 600 mA h g−1 for 100 cycles. Y. N. Jo et al.27 reported a Si–G/C composite fabricated by a mechanical milling, which delivered a reversible specific capacity of 655 mA h g−1 with a high first cycle CE of 86%. However, the first coulombic efficiency and the cycle performance of Si–G/C composites still remains a challenge, for example, the first CE of Si–G/C composite should be higher than 90% to satisfy industrial applications.
Herein, we introduced a new and scalable way to synthesize Si–G/C anode materials with moderate capacity (∼650 mA h g−1) and high first CE (90.6%). The Si–G/C composites were prepared by a evaporating and heat treatment process. With the optimized structure, the surface area of Si–G/C composite was decreased to from 18.6 to 4.8 m2 g−1. Both the graphite and silicon served as the active components of the anode, while the carbon layer produced from the organic carbon source acting as a barrier to prevent silicon from direct contact with electrolyte. As a result, the Si–G/C composite demonstrated excellent reversible capacity and capacity retention of 81% even after 1200 cycles in the full cell.
2. Experiment
2.1 Synthesis of Si–G/C composite
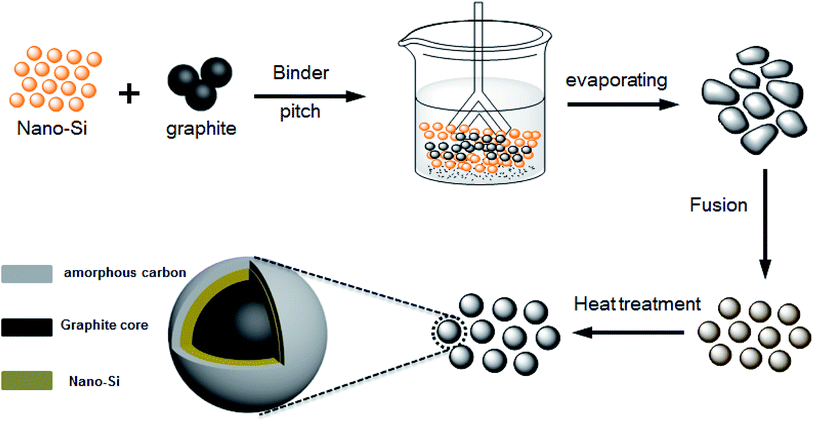
The preparation procedure for the high coulombic efficiency Si–G/C material was illustrated in Scheme 1. Firstly, nano-Si particles and polyvinyl pyrrolidone (PVP) were mixed together in ethanol under violent agitation for 1 h to form a homogeneous suspension. Then, graphite and pitch were added into the solution slowly. The resulting colloid was dried to form a Si/graphite precursor under continuous stirring at the temperature of 80 °C. After the evaporating process, the production was collected and then put into a fusion machine to form spheres.For carbon coating of the Si–G precursors, the Si/graphite precursors were put into a furnace, and then they were heated at 900 °C for 3 hours under a gas of N2 to obtain Si–G/C composites. To achieve different carbon content (marked as sample A, B and C), the content of the amorphous carbon layer was optimized by controlling the additive amount of pitch.
2.2 Materials characterization
The crystal structure, cross-sectional morphology and microstructure of the as-prepared Si–G/C composites were characterized by X-ray diffraction (XRD: PANalyticalX'Pert PRO, Cu/Kα radiation, 1.5406 nm), scanning electron microscopy (SEM: Hitachi S4800) and transmission electron microscopy (TEM: JEM-2100HR). The carbon content in the composites was determined by TGA method.2.3 Electrochemical test
Cyclic volumetric measurements were carried out using a scan rate of 0.1 mV s−1. The cell was assembled in the Braun glove box. The charge–discharge performance of the cells was tested in a voltage range of 0.001–1.5 V vs. Li/Li+ as a constant current of 500 mA g−1. The electrode was made by mixing 80% Si–G/C composite, 10% Super P as the conducting agent and 10% LA132 as the binder. The electrode slurry was dispersed and spread onto copper foil. After dried at 100 °C in vacuum, the copper foil was pressed and punched. CR2016 cells were assembled in an Ar-filled glove box using 1 M LiPF6 in a mixture of EC/DEC/EMC (1![[thin space (1/6-em)]](https://www.rsc.org/images/entities/char_2009.gif) :
:![[thin space (1/6-em)]](https://www.rsc.org/images/entities/char_2009.gif) 1
1![[thin space (1/6-em)]](https://www.rsc.org/images/entities/char_2009.gif) :
:![[thin space (1/6-em)]](https://www.rsc.org/images/entities/char_2009.gif) 1 by volume) as the electrolyte, using Celgard-2400 as the separator, and metallic lithium foil as the counter and reference electrode. The anode material of the full cell was designed to a capacity of 480 mA h g−1 using the synthesized Si–G/C material mixed with graphite. The full cell performance of Si–G/C was characterized by paring with a NCA cathode (LiNi0.815Co0.1Al0.05O2) with a designed cell capacity of 3000 mA h. The N/P ratio, defined by total capacity ratio between anode and cathode was chosen to be 1.05
1 by volume) as the electrolyte, using Celgard-2400 as the separator, and metallic lithium foil as the counter and reference electrode. The anode material of the full cell was designed to a capacity of 480 mA h g−1 using the synthesized Si–G/C material mixed with graphite. The full cell performance of Si–G/C was characterized by paring with a NCA cathode (LiNi0.815Co0.1Al0.05O2) with a designed cell capacity of 3000 mA h. The N/P ratio, defined by total capacity ratio between anode and cathode was chosen to be 1.05![[thin space (1/6-em)]](https://www.rsc.org/images/entities/char_2009.gif) :
:![[thin space (1/6-em)]](https://www.rsc.org/images/entities/char_2009.gif) 1.
1.
3. Results and discussion
3.1 Design principle
In order to implement Si into full cells for practical application, they are expected to possess several aspects as follows:(1) Higher specific capacity than graphite with long cycle life. The high energy density requirement is motivated by the electric vehicles. Nowadays, an anode with 5–10% Si blended with graphite has already been used in industry. Actually, the content of Si in the anode materials used in the companies was hardly higher than 10%. Form this point of view, the theoretical maximum capacity of a-moderate anode capacity was about 700–800 mA h g−1, which calculated as follows:
| Capacity = x% × 4200 + y% × 372 (x: Si, y: graphite) |
In the practical lithium ion batteries, volume deformation for device has limitation; usually, it should be not more than 20%.31 As mentioned in the ref. 30, the maximum electrode swelling for such anode was 13.2%, which is slightly higher than graphite (8%). Low electrode swelling is conducive to long-life cell cycle life, especially in the full cell. The content of silicon (Si%) in the designed composite should be controlled around ∼10%.
(2) High coulombic efficiency requirement. For practical application, coulombic efficiency is a key factor to influence the cycle performance. Based on the theoretical calculation,31 coulombic efficiency should be higher than 99.95% to achieve long cyclic performance of 400 cycles with 80% retention. The coulombic efficiency (CE) of Si is not satisfied due to the unstable SEI film. A surface modification of nano-Si is necessary. In the other hand, the CE of the composite is determined by the host materials used in the composite. From this point of view, high coulombic efficiency graphite is used as the core, which is conductive to achieve high coulombic efficiency.
(3) Low cost. One of the most important factors for practical application is the cost of the anode materials. As for the Si–G/C, graphite is a commercial material. Nano-Si is an expensive raw material compared with graphite, but due to the low content used in the composite, the cost of nano-Si is decreased. For instance, the cost of commercial graphite is ∼10 $ per kg. By comparison, the cost of nano-Si is ten times higher than graphite. However, with only ≤10% additive, the cost of nano-Si is comparative to graphite. Such cost is acceptable for commercial application.
According to these considerations, graphite is chosen as the host materials, while nano-Si serves as additive. The structure of the composite was optimized.
3.2 Morphologies and characterization of the samples
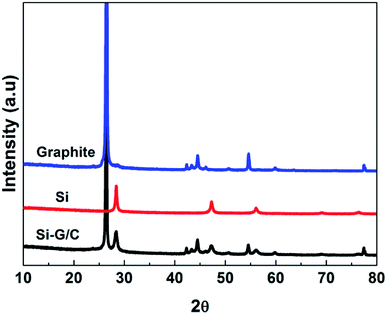
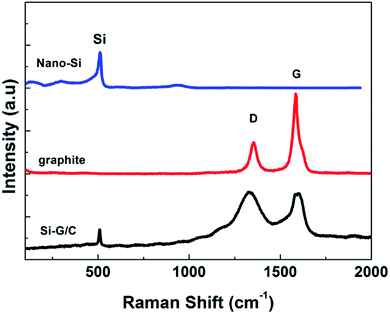
The XRD patterns of the nano-Si, graphite and as-prepared composite were showed in the Fig. 1. The peaks in the patterns at 28, 47, 56, 69 and 76 degree could be well matched with the diffraction pattern of the crystal Si (JCPDS card no. 27-1402). For the graphite pattern, strong peaks around at 20–30, 45–50 and 55 degree can be found, which represented the two hexagonal phases. The diffraction peaks of the as-prepared composite were indexed based on a mixture of graphite and silicon crystalline phase. The strong peak at 26.5 degree is belonging to the graphite. The weak intensity of the silicon diffraction peaks in the composite was due to the relatively low content of silicon. No peaks corresponding to SiC were detected, suggesting chemical reaction between Si and carbon were not happened during the thermal treatment.To further verify the co-presence of Si, graphite and amorphous carbon in the composite, the Raman spectroscopy was carried out, as shown in Fig. 2. As can be seen, the Raman spectrum of nano-Si demonstrated a main sharp adsorption band at a Raman shift around 515 cm−1, with another two weak peaks at ∼295 and ∼950 cm−1, while the graphite showed two characteristic bands around 1350 and 1601 cm−1, which were attributed to the D band and G band, respectively. The ratio of the integrated area of the D band and G band (R = ID/IG) reflects the graphitization degree of the samples. The value of the R was as low as 0.35, suggesting a high degree of graphitization. Three Raman shifts were observed for the as-prepared composite. Meanwhile, the intensity of the D band in the composite was enhanced compared to the pure graphite, suggesting the increased disorder of the carbon in the composite, which was due to the deposited carbon from pitch.
The morphologies of the samples were observed by SEM and TEM. Fig. 3a and b showed typical TEM images of the silicon nanoparticles. The particles were around 30–50 nm in diameter and aggregated due to the high surface energy. According to the HRTEM image, it was evident that the Si nanoparticles were coated with a thin layer of silicon dioxide because of natural oxidation in the air. The spacing calculated from the HRTEM was 0.315 nm, representing the Si(111) plane, which was consist with other report.28 The graphite had an irregular shape with a large size up to 3–6 μm (Fig. 3c). As for the composite, the main particles showed a larger particulate shape with much rougher surface compared to the graphite, and the size of the composite was 8–15 μm as shown in the Fig. 3e.
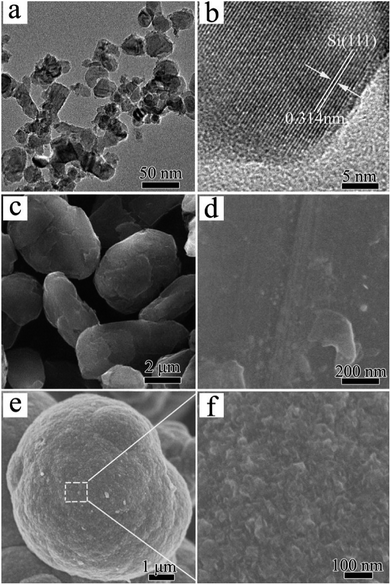 | ||
| Fig. 3 (a and b) Typical TEM profiles of nano-silicon; (c and d) typical SEM images of graphite; (e and f) typical SEM and TEM images of the Si–G/C composite. | ||
To further investigate the structure, a cross profile of the Si–G/C composite was prepared, as shown in Fig. 4. Clearly, a core–shell structure was presented which composed of a core and an amorphous carbon shell. Through EDS mapping analysis (Fig. 4c and S2†), it was confirmed that the coating layer was carbon on the nano-Si layer (Fig. 4b). Over the core surface, a narrow shell with several hundred of nanometer was observed, which was identified as the silicon layer according to the EDS mapping result. The carbon coating layer was uniformly formed on the outmost surface of the nano-Si layer, where the thickness of the amorphous carbon was 100–500 nm. The Si layer on the inner pores of Si–G/C possessed sufficient room for Si volume expansion during the lithiation, which can improve the cycling performance. And also, the post-coated dense carbon layer decreased the specific surface area of the particles resulting in enhanced cycling efficiency.
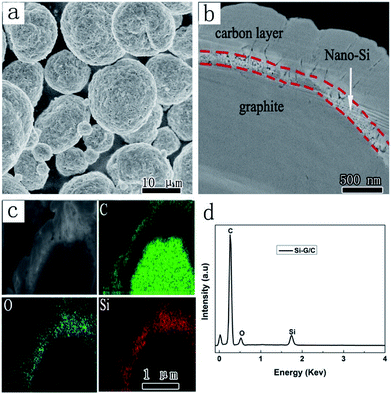 | ||
| Fig. 4 (a) SEM images of the Si–G/C; (b) the cross profile image of a single Si–G/C particle; (c) energy mapping images of the Si–G/C; (d) EDX spectrum of the Si–G/C. | ||
3.3 Electrochemical performance of Si–G/C electrodes
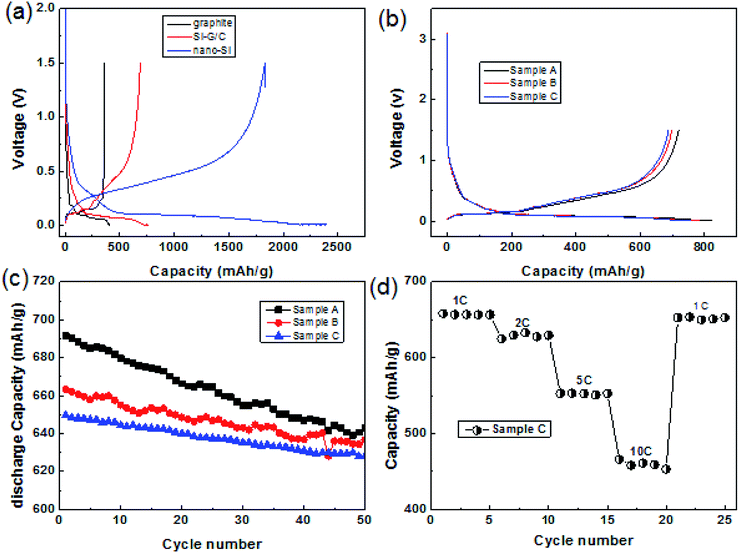
The as-prepared core–shell structured composite was used as an anode material in the lithium ion battery. Fig. 5a presented the typical voltage vs. capacity curves of nano-Si, graphite and the composite sample A at a current density of 0.5 A g−1 between 0.001 and 1.5 V. As can be seen, the specific reversible capacity of the three composite was 1768, 719 and 355 mA h g−1, respectively. The charge and discharge capacity of nano-Si were 1767 and 2326 mA h g−1, indicating low first coulombic efficiency (ICE) of 76%. At the same time, the ICE of the graphite was ∼93%, whose charge and discharge capacity were 355 and 381 mA h g−1. Compared with the graphite and nano-Si, the Si–G/C presented a moderate discharge capacity of 820.8 mA h g−1 due to the low content of silicon, but the first coulombic efficiency increased from 76% to 87.6% with a reversible capacity of 719 mA h g−1. The first coulombic efficiency of the Si-based anode was enhanced by the graphite core.To further optimize the capacity and the first coulombic efficiency of Si–G/C, a series of carbon layer with different coated-thickness were carried out by controlling the experimental conditions. Fig. 4b illustrated the first discharge–charge curves of the composite with different carbon contents. As shown in Fig. 4b, the carbon content of the sample A, B and C was 10.5%, 21.9% and 34.3%, respectively (calculated by the TGA analysis, shown in the ESI Table S2†). The three samples delivered a discharge capacity of 820.8, 784 and 759.2 mA h g−1 and a charge capacity of 719, 693.8 and 687.7 mA h g−1 at a current of 0.5 A g−1, indicating a high CE of 87.6%, 88.5%, and 90.6%, respectively. It is obvious that the initial efficiency was great affected by the amorphous carbon coating. The BET surfaces of the sample A, B and C were 18.8, 8.2 and 4.8 m2 g−1, respectively (shown in Table S1†). A thinker carbon layer would lead to a higher ICE, since thicker carbon layer resulted denser surface coating, thus the state of the interface between the composite and the electrolyte was enhanced, resulting in less irreversibly capacity loss. At the same time, the composites resulted in lower capacity because of the higher content of carbon and the lower theoretical capacity of carbon. Furthermore, the swelling of the Si–G/C electrode was demonstrated by cross-section scanning electron microscopy images of the electrodes before and after cycling, showed in the Fig. S3.† As can be seen, the thickness of the layer before cycled was around 38.8 μm, while it was ∼48.7 μm after 50 cycle number. The end of life swelling (after 50 cycles) is ∼25.5%, which was very promising for practical applications.
Fig. 5c showed the cycling performance of the three samples with different carbon content at a current of 1 A g−1. All the samples presented stable cycling stability. As shown in the patterns, after 50 cycles at a current of 1 A g−1, the capacity retention of sample A, B, and C were 93%, 95.6% and 96.7%, respectively. It was apparent that the as fabricated Si–G/C with thicker amorphous carbon maintains better cycling stability, which was due to the stronger function of the amorphous carbon. The amorphous carbon layer could not only prevent silicon particles from directly contacting with electrolyte to form a stable SEI film, but also act as an buffer layer to release the huge expansion produced by silicon.
More exciting results were obtained for the electrode kinetics of the sample C electrodes when their charge current densities were increased from 1C to 10C (1C = 1000 mA h g−1). For current densities of 1C, 2C, 5C and 10C, the charge capacity of the electrode was 650, 625, 511 and 460 mA h g−1, respectively.
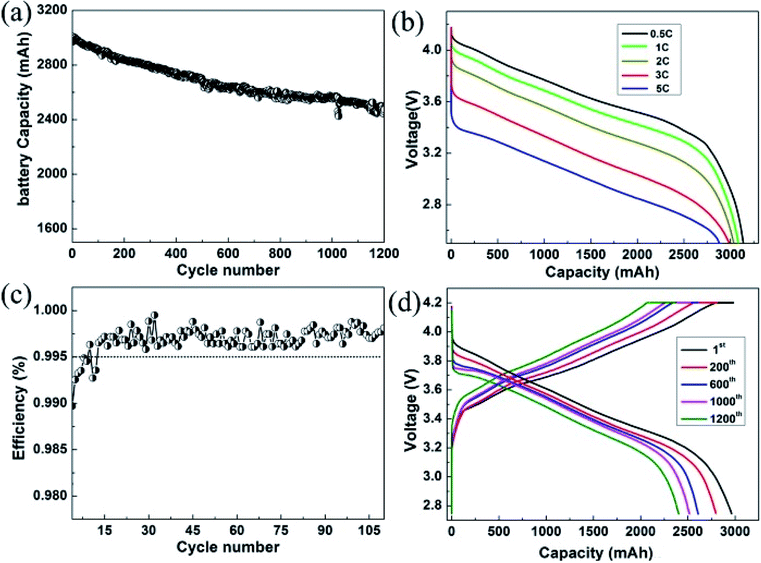
Furthermore, to investigate the commercial viability, a full cell using the individual graphite blended samples as the anodes was assembled to evaluate the battery performance in the potential rang of 2.7–4.2 V at room temperature. We adopted the NCA as the cathode material due to its high capacity. With this high capacity cathode, the full cells can be evaluated under higher capacity and higher energy density condition. In Fig. 6a, it showed that the full cell delivers a cell capacity ∼3000 mA h. High cycling CE is commonly regarded as an important factor in the full-cell system, since the CE affects the available capacity of the practicable cell. Fig. 6b demonstrated a prolonged cycling performance of the full cell for 1200 cycles. As can be seen, the Si–G/C anode based cell exhibited 81% capacity retention even after 1200 cycles. To interpret the excellent cycling behaviour, a lot of reversible cycling CE are provided in the Fig. 6c. As shown in the figure, the Si–G/C exhibited high initial CE with a rapid increase to exceed 99.5% in only 15 cycles. S. Chae et al.28 reported that a low initial CE below 99.5% in the first or subsequent cycles will lead to dramatic capacity degradation in the full cell. In this case, the average efficiency of the full cell was recorded to ∼99.6% calculated from the first 100 cycles. In addition, the rate capacity of the full cell was also shown in the Fig. 6d. A 10 times C-rate increased from 0.5C to 5C and it was still retained at ∼90% of the initial capacity, which implied that the Si–G/C composites also exhibited excellent rate performance.
The excellent electrochemical performance of the composite electrode can be ascribing to the well-designed structure. Firstly, the silicon source used in the composite was Si nanoparticles less than 100 nm, which can prevent the pulverization of Si during Li+ insertion and extraction; secondly, the graphite-core framework functioned as an isolated layer to suppress the aggregation of nano-Si, and also it improved the electrical conductivity; thirdly, the carbon layer provided a buffer to accommodate the volume charge during the charge–discharge process, which stabilized the SEI film during cycling numbers, moreover, the whole carbon shell prevented the exposure of nano-Si from direct contacting with electrolyte; finally, the internal void space (Fig. S5†) accommodated the huge volume expansion of Si.
4. Conclusions
In conclusion, to assess the commercial silicon anode materials for the lithium ion battery, we designed a novel Si–G/C material with high CE and moderate capacity. The specific reversible capacity of the Si–G–C composite is 650 mA h g−1 and the first coulombic efficiency is as high as 90.6%. In addition, the full-cell battery comprising NCA and Si–G/C also demonstrated the high first cycle CE of 88.9% and a cell capacity of ∼3000 mA h at the first formation cycle. The full cell battery with Si–G/C showed stable cycling behavior with capacity retention of 81% even after 1200 cycles and the cycling CE exceeded 99.5% after only 15 of cycles.Conflicts of interest
The authors declared that they have no conflicts of interest to this work. We declare that we do not have any commercial or associative interest that represents a conflict of interest in connection with the work submitted.Notes and references
- J. R. Szczech and S. Jin, Energy Environ. Sci., 2011, 4, 56 RSC.
- M. L. Terranova, S. Orlanducci, E. Tamburri, V. Guglielmotti and M. Rossi, J. Power Sources, 2014, 167–177 CrossRef.
- M. R. Zamfir, H. T. Nguyen, E. Moyen, Y. H. Lee and D. Pribat, J. Mater. Chem. A, 2016, 1, 9566 RSC.
- T. Kennedy, M. Brandon and K. M. Ryan, Adv. Mater., 2016, 28, 5696–5704 CrossRef PubMed.
- L. Lin, X. Xu, C. Chu, M. K. Majeed and J. Yang, Angew. Chem., Int. Ed., 2016, 55, 14063–14066 CrossRef PubMed.
- M. L. Urquiza, M. Otero, G. L. Luque, D. Barraco and E. P. M. Leiva, Electrochim. Acta, 2015, 208, 92–101 CrossRef.
- J. Lang, B. Ding, T. Zhu, H. Su, H. Luo, L. Qi, K. Liu, K. Wang, N. Hussain, C. Zhao, X. Li, H. Gao and H. Wu, Adv. Mater., 2016, 28, 10236–10243 CrossRef PubMed.
- M. A. Rahman, G. Song, A. I. Bhatt, Y. C. Wong and C. Wen, Adv. Funct. Mater., 2016, 26, 647–678 CrossRef.
- M. T. Mcdowell, I. Ryu, S. W. Lee, C. Wang, W. D. Nix and Y. Cui, Adv. Mater., 2012, 24, 6034–6041 CrossRef PubMed.
- K. Q. Peng, X. Wang, L. Li, Y. Hu and S. T. Lee, Nano Today, 2013, 8, 75–97 CrossRef.
- Y. Cui, Z. H. Zhong, D. L. Wang, W. U. Wang and C. M. Lieber, Nano Lett., 2003, 3, 149 CrossRef.
- B. M. Bang, J. I. Lee, H. Kim, J. Cho and S. Park, Adv. Energy Mater., 2012, 2, 878–883 CrossRef.
- D. Y. Kang, C. Kim, D. Gueon, G. Park, J. S. Kim, J. K. Lee and J. H. Moon, ChemSusChem, 2015, 8, 3414–3418 CrossRef PubMed.
- D. S. Jung, T. K. Hwang, S. B. Park and J. W. Choi, Nano Lett., 2013, 13, 2092–2097 CrossRef PubMed.
- H. Wu, G. Zheng, N. Liu, T. J. Carney, Y. Yang and Y. Cui, Nano Lett., 2012, 12, 904–909 CrossRef PubMed.
- Q. Xu, J. Y. Li, Y. Yin, Y. Kong, Y. Guo and L. Wan, Chem.–Asian J., 2016, 11, 1205–1209 CrossRef PubMed.
- S. Chae, M. Ko, S. Park, N. KKKim, J. Ma and J. Cho, Energy Environ. Sci., 2016, 9, 1251–1257 RSC.
- J. Zhang, C. Zhang, S. Wu, X. Zhang, C. Li, C. Xue and B. Cheng, Nanoscale Res. Lett., 2015, 10, 395 CrossRef PubMed.
- Y. He, X. Yu, Y. Wang, H. Li and X. Huang, Adv. Mater., 2011, 23, 4938–4941 CrossRef PubMed.
- M. Yoshio, H. Wang and K. Fukuda, J. Electrochem. Soc., 2000, 147(4), 1245–1250 CrossRef.
- E. Peled, C. Menachem and D. Bartow, J. Electrochem. Soc., 1996, 143(1), L4–L7 CrossRef.
- H. Wang and M. Yoshio, J. Power Sources, 2001, 93(1), 123–129 CrossRef.
- M. Li, X. Hou, Y. Sha, J. Wang, S. Hu, X. Liu and Z. Shao, J. Power Sources, 2014, 248, 721–728 CrossRef.
- Y. S. Yoon, S. H. Jee, S. H. Lee and S. C. Nam, Surf. Coat. Technol., 2011, 206, 553 CrossRef.
- E. H. Lee, B. O. Jeong, S. H. Jeong, T. J. Kim, Y. S. Kim and Y. Jung, Bull. Korean Chem. Soc., 2013, 34, 1435 CrossRef.
- M. Ko, S. Chae, J. Ma, N. Kim, H.-W. Lee, Y. Cui and J. Cho, Nat. Energy, 2016, 1, 16113 CrossRef.
- Y. N. Jo, Y. Kim, J. S. Kim, J. H. Song, K. J. Kim, C. Y. Kwag, D. J. Lee, C. W. Park and Y. J. Kim, J. Power Sources, 2010, 195, 6031 CrossRef.
- S. Chae, N. Kim, J. Ma, J. Cho and M. Ko, Adv. Energy Mater., 2017, 1700071 CrossRef.
- Y. S. Hu, R. D. Cakan, M. M. Titirici, J. O. Muller, R. Schlogl, M. Antonietti and J. Maier, Angew. Chem., Int. Ed., 2008, 47, 1645–1649 CrossRef PubMed.
- X. Li, P. Yan, X. Xiao, J. H. Woo, C. Wang, J. Liu and J. Zhang, Energy Environ. Sci., 2017, 10, 1427–1434 RSC.
- F. Luo, B. Liu, J. Zheng, G. Chu, K. Zhong, H. Li, X. Huang and L. Chen, J. Electrochem. Soc., 2015, 162, A2509–A2528 CrossRef.
- Y. Zhou, H. Guo, G. Yan, Z. Wang, X. Li, Z. Yang, A. Zheng and J. Wang, Chem. Commun., 2018, 54(30), 3755–3758 RSC.
- Y. Zhou, Y. Yong, Z. Wang, X. Li and R. Zhou, Mater. Lett., 2017, 195, 164–167 CrossRef.
- M. Su, H. Wan, Y. Liu, W. Xiao, A. Dou, Z. Wang and H. Guo, Powder Technol., 2018, 323, 294–300 CrossRef.
Footnote |
| † Electronic supplementary information (ESI) available. See DOI: 10.1039/c8ra04804e |
| This journal is © The Royal Society of Chemistry 2018 |

