 Open Access Article
EEG characteristic analysis of coach bus drivers based on brain connectivity as revealed via a graph theoretical network
Fuwang Wang *a,
Xiaolei Zhanga,
Rongrong Fub and
Guangbin Sun
 c
c
aSchool of Mechanic Engineering, Northeast Electric Power University, Jilin 132012, China. E-mail: wangfuwangfeixue@163.com; 20152622@neepu.edu.cn; wangfuwangbaiyang@126.com; Tel: +86-432-64807382
bCollege of Electrical Engineering, Yanshan University, Qinhuangdao 066004, China
cTechnology and Engineering Center for Space Utilization, Chinese Academy of Sciences, Beijing 100094, China. E-mail: gbsun@csu.ac.cn
First published on 23rd August 2018
Abstract
This study describes the detection of driving fatigue using the characteristics of brain networks in a real driving environment. First, the θ, β and 36–44 Hz rhythm from the EEG signals of drivers were extracted using wavelet packet decomposition (WPD). The correlation between EEG channels was calculated using a Pearson correlation coefficient and subsequently, the brain networks were built. Furthermore, the clustering coefficient (C) and global efficiency (G) of the complex brain networks were calculated to analyze the functional differences in the brains of drivers over time. Combined with the relative power spectrum ratio (β/θ) of EEG signals and the mean value from questionnaires, the correlation of data characteristics between brain networks and subjective and objective data was analyzed. The results show that changes in the fatigue state of drivers can be effectively detected by calculating the data characteristics of brain networks in a real driving environment.
1 Introduction
Research shows that driver fatigue has become one of the major causes of fatal road accidents.1,2 Therefore, it is particularly important to accurately and rapidly detect the mental state of drivers when he/she is driving a vehicle for a long time. Researchers mainly study this problem from subjective and objective aspects. The subjective aspect mainly determines the fatigue state of a driver mainly according to the drivers' and researchers' subjective judgment.3,4 The objective aspect is mainly based on the characteristics of human physiological signals to analyze driver fatigue. These physiological signals of the human body include those derived from electroencephalogram (EEG),5–9 electromyogram (EMG),10 electrocardiogram (ECG),11,12 electrocardiogram (EOG)13 and facial movement.14 However, subjective detection results are mainly affected by the subjective judgments of drivers and researchers; thus, it was commonly used only as an auxiliary method. Currently, researchers mainly focus on the objective aspects of fatigue. EEG has been considered to be the most reliable indicator of fatigue state in humans.15,16Several methods are used to analyze the characteristics of EEG signals. These quantifications involve the analysis of features such as energy17,18 and entropy19 in different bands of EEG signal. The most commonly used method to quantify EEG signal is based on power spectral analysis. This type of analysis generally involves several EEG frequency components, which are δ (0–4 Hz), θ (4–8 Hz), α (8–13 Hz), and β (13–35 Hz). The frequency band 36–44 Hz of EEG signals mainly reflects human vision and cognitive activities.20 In recent years, many studies have used complex brain networks to analyze brain functional characteristics. Haitao et al. used the features of functional brain networks to analyze cranial nerve diseases.21,22 Mental fatigue characteristics of the human brain were studied by using complex brain networks.23–26 In addition, research based on brain networks in the field of human brain cognition has also been carried out.27–29
Researches have shown that the methods using the main brain region enable the study the characteristics of brain function have been gradually adopted in research. Yu Haitao et al. used 16-channel signals of EEG to analyze the characteristics of Alzheimer's disease.21 Schindler et al. used 18-channel signals of EEG to evaluate the therapeutic effect of epilepsy.30 Kar et al. used 16-channel signals of EEG to study driver fatigue during simulated driving with long driving times.31 Ahmadlou et al. used 16-channel signals of EEG to analyze cognition as well as the pathology of brain disorders.32 In these studies, relatively few EEG electrodes, which only involved major brain regions, were used; however, the results of these studies were satisfactory. In our study, we attempted to use Emotiv equipment with 14 conductive poles to analyze driver fatigue characteristics in a real driving environment.
It is worth mentioning that research studies on driver fatigue generally use simulated driving environments, which are different from real driving environments (such as driving on highways). This research usually utilizes features of several typical channels of EEG signals to analyze driver fatigue, which may ignore some important information contained in other channels. In this study, EEG data from 14 channels were collected from coach bus drivers in a real driving environment. Furthermore, we used the clustering coefficient and global efficiency of complex brain networks to analyze the functional differences in the brains of the drivers over time, followed by an analysis of the characteristics of driver fatigue.
2 Experiments and data preprocessing
2.1 Subjects
A total of 10 healthy subjects [8 males and 2 females; aged 32 ± 1.6 (S.D)] were chosen for the experiment. All subjects were reported to have no sleep-related disorders. They were free of medication during the experiment. They were also asked to refrain from consuming any type of stimulants such as alcohol, tea or coffee during the experiment. They have no history of neurological diseases.2.2 Procedure and EEG recording
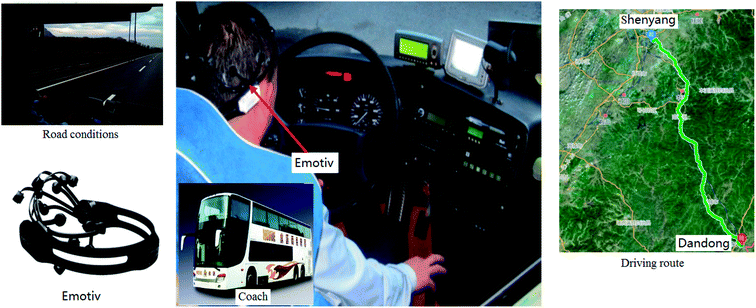
This experiment utilized a real driving environment. Drivers drove along the highway from Shenyang to Dandong, China. Fig. 1 shows the course where A is the starting place (Shenyang) and B is the destination (Dandong). All participants continuously drove a coach bus for two hours (13:00–15:00) and nine sets of data were collected for each participant. Data acquisition was divided into nine stages: stage 1, 13:00; stage 2, 13:15; stage 3, 13:30; stage 4, 13:45; stage 5, 14:00; stage 6, 14:15; stage 7, 14:30; stage 8, 14:45; and stage 9, 15:00. Each data acquisition took three minutes. We collected EEG data using EEG acquisition equipment called Emotiv, whose sampling frequency was 128 Hz in this experiment. Electrodes (Ag/AgCl) were attached to the scalp according to the international 10–20 system (14 channels: AF3, AF4, F3, F4, FC5, FC6, F7, F8, T7, T8, P7, P8, O1 and O2). The EEG data recording for each stage lasted 3 minutes. Nine sets of data were collected for every participant. Recordings were performed with mastoids (right and left) used as the common reference. Fig. 1 shows the experimental set-up.Emotiv is a portable EEG acquisition device with a sampling rate of 128 Hz; it provides wireless Bluetooth communication via a USB dongle. In addition, the sensors of the Emotiv EPOC are 16 moist felt-tipped electrodes (including reference and ground) that are attached to the scalp with a simple spring-like design and are very convenient for use in actual driving conditions. In addition, its electrodes press against the scalp according to the international 10–20 system (14 channels: AF3, AF4, F3, F4, FC5, FC6, F7, F8, T7, T8, P7, P8, O1 and O2), which can detect the brain activity features reflected in the frontal, central and posterior regions of the human brain.
All subjects were informed about the research background and the study protocol. Additionally, they were free to choose to participate in the experiment or give up. Moreover, all participants gave their written informed consent to be included in the study. The Ethics Committee at the Northeast Electric Power University Hospital endorsed the study protocol according to The Code of Ethics of the World Medical Association (Declaration of Helsinki).
3 Methods
The processing method involves decomposition into different bands by wavelet packet decomposition (WPD), network formation using correlation coefficient, computation of network parameters and other characteristics of EEG using the classical methods. The detailed methodology is explained in the following sections.3.1 Data preprocessing
EEG recordings from drivers in a real driving environment are considerably influenced by artifacts and noise than recordings performed in the laboratory; thus, elimination of noise was initially performed. In this study, we used WPD to eliminate noise.WPD can provide a more sophisticated analysis of the signals. It can also choose the appropriate band to match with the signal spectrum according to the characteristics of signal analysis, which can reflect the essential characteristics of the signals. These advantages are not possessed by the wavelet decomposition (WD). Therefore, we used WPD to decompose the EEG signals in our study. We used 4 layer decomposition to extract θ (4–8 Hz), β (12–32 Hz) and 36–44 Hz rhythms. The formula of WPD is shown as follows:
f(t) represents the source signals. We obtained 2i sub-bands in the i points class after wavelet packet decomposition. The source signal f(t) can be expressed as:
 | (1) |
 | (2) |
The θ wave (4–8 Hz) was obtained by reconstructing the sub-band s(4,1). The β wave (12–32 Hz) was obtained by reconstructing the sub-bands s(4,3), s(4,4), s(4,5), s(4,6) and s(4,7). The 36–44 Hz rhythm was obtained by reconstructing the sub-bands s(4,9) and s(4,10) using WPD.
3.2 Correlation coefficient and formation of the network
In this study, we used the Pearson correlation coefficient to analyze the relationship between any two channels of the EEG signals. The Pearson correlation coefficient is defined as follows:
 | (3) |
 | (4) |
![[x with combining macron]](https://www.rsc.org/images/entities/i_char_0078_0304.gif) and ȳ are series means and σX and σY are the standard values of deviation.
and ȳ are series means and σX and σY are the standard values of deviation.
The correlation coefficient between electrodes was stored in a 14 × 14 symmetric matrix. This matrix was converted into an unweighted graph with an edge between two nodes when the corresponding correlation coefficient was greater than the threshold value. The matrix containing this connectivity information is known as the ‘adjacency’ matrix. The threshold selection depends on the application area.33
3.3 The complex brain networks
Nodes and edges are the two important elements of a figure. The method based on graph theory takes every region of the brain as a “node” and the connection between brain regions as an “edge”, so as to build the brain networks. The area of graph theory is an established mathematical field. Moreover, this type of brain connectivity analysis has been proven as a very effective and informative way to explore brain function and mental state.34–36 In this study, we used the clustering coefficient and global efficiency of the complex brain networks to analyze the brain functional differences of the drivers.
 | (5) |
 | (6) |
 | (7) |
 | (8) |
From eqn (8), we can conclude that networks with a highly integrated organization that are characterized by a short minimum path length between any pair of regional nodes will have high global efficiency.38,39 Combining with eqn (6), we can conclude that the smaller the value of Li,j, the faster is the information transmission speed of a node with others.
In this study, a two-dimensional coordinate system for electrodes was established in order to conveniently calculate the global efficiency of brain network nodes. The relative positions of the electrodes of the EEG acquisition device (Emotiv) are shown in Fig. 2a.
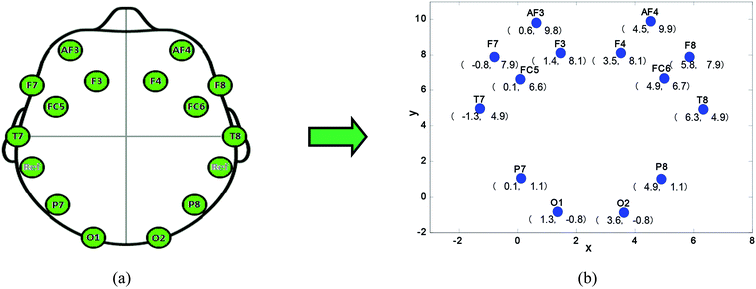 | ||
| Fig. 2 Relative position of the electrode, (a) electrode division of Emotiv, (b) electrode coordinates in a two-dimensional coordinate system. | ||
Fig. 2b shows the coordinate values of the electrodes in a two-dimensional coordinate system. In this study, the relationship between pairs of 14 channel (14 channels: F7, F3, F4, F8, FT7, FT8, C3, C4, TP7, TP8, P3, P4, O1 and O2) signals were calculated using eqn (4). In our study, the steps of brain network construction were as follows.
First, the EEG data, as shown in Fig. 3a, was collected using the acquisition device (Emotiv). The sub-band (36–44 Hz) was extracted from the EEG signals. Then, the adjacent matrix, displayed in Fig. 3b, was computed using eqn (4). It was determined that there is an edge connection between node i and node j if the corresponding correlation coefficient is greater than the fixed threshold value T, otherwise no edge exists between i and j. Finally, the networks were formed using the adjacent matrix and a threshold value.
3.4 The relative power spectrum
The four EEG frequency components, namely, δ (0–4 Hz), θ (4–8 Hz), α (8–13 Hz), and β (13–35 Hz), were widely applied in the analysis of driver fatigue. Their power spectrum ratios have different combinations, such as θ/β, θ/α + β, θ + α/β, θ + α/α + β and β/α, all of which show different characteristics of driver fatigue over time.17,40,41 In this study, we used the ratio θ/β of the relative power spectrum of the channels O1, O2, FC5 and FC6 to analyze the fatigue of drivers over time. Combined with the relevant data of brain networks, the ratio θ/β was changed to β/θ for ease of comparison.3.5 Subjective questionnaire
In this study, we used a questionnaire to obtain the final fatigue assessments of the drivers. All participants were required to complete a battery of psychological questionnaires: lack of energy, physical exertion, physical discomfort, lack of motivation and sleepiness.42 These questionnaires were used to assess their personality, mood-state, anxiety and lifestyle. We set scores of 0–10 for the five indicators in the psychological questionnaires, where 0 indicates no feeling and 10 indicates feeling serious. All these questionnaires have been shown to be reliable and have acceptable validity. Participants completed the subjective questionnaires before they completed the monotonous driving task and they also completed their self-report outcome questionnaires.4 Results
4.1 Network analysis
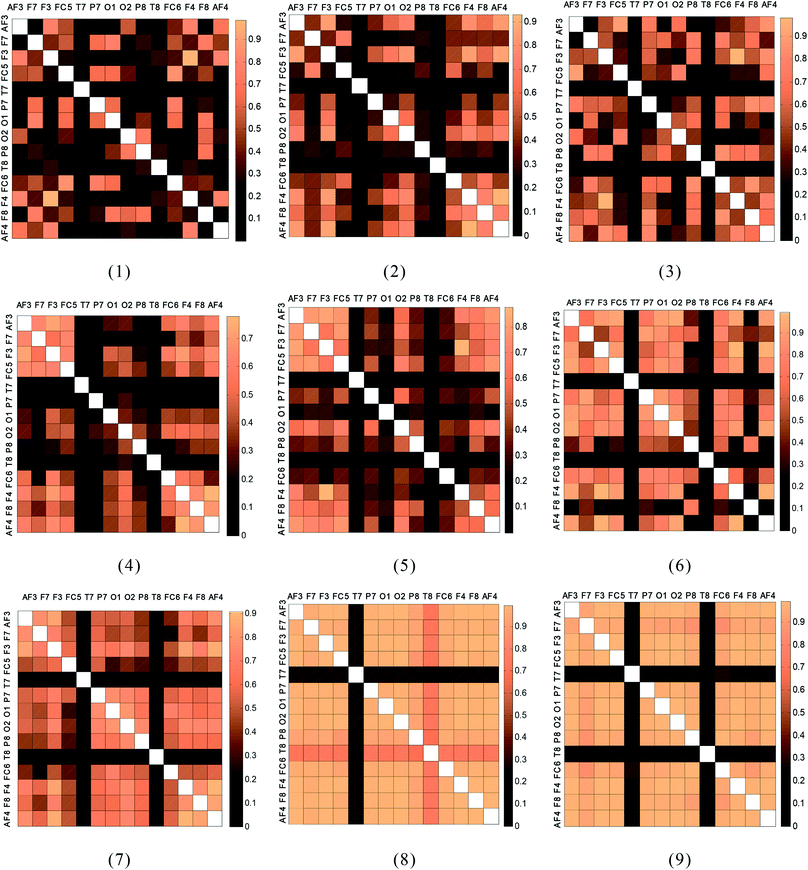
The analysis was performed on 3 min-EEG records (during driving) of 20 subjects at 9 stages (stages 1–9). The temporal values of the correlation coefficient between a pair of electrodes were evaluated for the 36–44 Hz band. The time-averaged correlation coefficient values were used to construct the correlation coefficient matrix. The mean correlation coefficient matrices of all subjects at all stages, which are graphically represented as color blocks, are shown in Fig. 4.Fig. 4 indicates that the color block corresponding to the driving time of the drivers gradually deepens, which indicates that the EEG correlation values between the 14 channels are gradually getting larger over time (stages 1–9).
| Threshold values | ||||||||||||||||
|---|---|---|---|---|---|---|---|---|---|---|---|---|---|---|---|---|
| 0.05 | 0.10 | 0.15 | 0.20 | 0.25 | 0.30 | 0.35 | 0.40 | 0.45 | 0.50 | 0.55 | 0.60 | 0.65 | 0.70 | 0.75 | ||
| a Stage 1: driver's initial driving experiment stage.; stage X: the driving stages corresponding to the five highest scores of the driver's subjective questionnaire. | ||||||||||||||||
| Subject 1 | Stage 1 | 0.95 | 0.90 | 0.88 | 0.82 | 0.73 | 0.59 | 0.55 | 0.49 | 0.45 | 0.43 | 0.37 | 0.30 | 0.26 | 0.21 | 0.14 |
| Stage X | 0.97 | 0.94 | 0.91 | 0.89 | 0.85 | 0.78 | 0.75 | 0.71 | 0.63 | 0.56 | 0.47 | 0.39 | 0.33 | 0.30 | 0.25 | |
| Subject 2 | Stage 1 | 0.90 | 0.88 | 0.87 | 0.80 | 0.62 | 0.55 | 0.53 | 0.47 | 0.46 | 0.43 | 0.36 | 0.31 | 0.25 | 0.23 | 0.15 |
| Stage X | 0.98 | 0.93 | 0.92 | 0.88 | 0.88 | 0.76 | 0.70 | 0.62 | 0.59 | 0.55 | 0.46 | 0.35 | 0.34 | 0.27 | 0.26 | |
| Subject 3 | Stage 1 | 0.94 | 0.85 | 0.79 | 0.75 | 0.67 | 0.56 | 0.52 | 0.43 | 0.40 | 0.33 | 0.29 | 0.25 | 0.19 | 0.15 | 0.11 |
| Stage X | 0.98 | 0.96 | 0.92 | 0.82 | 0.81 | 0.77 | 0.73 | 0.65 | 0.59 | 0.55 | 0.46 | 0.43 | 0.39 | 0.33 | 0.27 | |
| Subject 4 | Stage 1 | 0.86 | 0.85 | 0.83 | 0.77 | 0.66 | 0.55 | 0.52 | 0.47 | 0.41 | 0.41 | 0.39 | 0.34 | 0.33 | 0.25 | 0.19 |
| Stage X | 0.95 | 0.94 | 0.90 | 0.86 | 0.78 | 0.76 | 0.73 | 0.60 | 0.53 | 0.50 | 0.50 | 0.44 | 0.42 | 0.35 | 0.28 | |
| Subject 5 | Stage 1 | 0.90 | 0.89 | 0.87 | 0.75 | 0.69 | 0.57 | 0.54 | 0.47 | 0.42 | 0.41 | 0.35 | 0.30 | 0.25 | 0.22 | 0.13 |
| Stage X | 0.98 | 0.97 | 0.90 | 0.83 | 0.82 | 0.77 | 0.73 | 0.69 | 0.65 | 0.62 | 0.55 | 0.41 | 0.30 | 0.27 | 0.22 | |
| Subject 6 | Stage 1 | 0.88 | 0.86 | 0.86 | 0.77 | 0.64 | 0.58 | 0.54 | 0.48 | 0.45 | 0.43 | 0.36 | 0.35 | 0.28 | 0.22 | 0.19 |
| Stage X | 0.94 | 0.90 | 0.90 | 0.85 | 0.81 | 0.77 | 0.65 | 0.61 | 0.55 | 0.52 | 0.45 | 0.39 | 0.33 | 0.29 | 0.22 | |
| Subject 7 | Stage 1 | 0.95 | 0.93 | 0.89 | 0.82 | 0.77 | 0.65 | 0.56 | 0.43 | 0.40 | 0.40 | 0.35 | 0.30 | 0.24 | 0.23 | 0.17 |
| Stage X | 0.96 | 0.94 | 0.90 | 0.85 | 0.81 | 0.75 | 0.71 | 0.63 | 0.61 | 0.53 | 0.47 | 0.39 | 0.33 | 0.28 | 0.23 | |
| Subject 8 | Stage 1 | 0.92 | 0.91 | 0.89 | 0.85 | 0.70 | 0.63 | 0.57 | 0.53 | 0.49 | 0.43 | 0.39 | 0.23 | 0.20 | 0.17 | 0.13 |
| Stage X | 0.97 | 0.95 | 0.95 | 0.89 | 0.80 | 0.75 | 0.71 | 0.66 | 0.64 | 0.59 | 0.48 | 0.47 | 0.35 | 0.29 | 0.21 | |
| Subject 9 | Stage 1 | 0.96 | 0.90 | 0.88 | 0.73 | 0.65 | 0.57 | 0.51 | 0.45 | 0.43 | 0.40 | 0.38 | 0.35 | 0.28 | 0.24 | 0.19 |
| Stage X | 0.97 | 0.96 | 0.95 | 0.88 | 0.78 | 0.73 | 0.71 | 0.65 | 0.63 | 0.59 | 0.57 | 0.49 | 0.40 | 0.34 | 0.27 | |
| Subject 10 | Stage 1 | 0.94 | 0.90 | 0.87 | 0.83 | 0.75 | 0.58 | 0.56 | 0.47 | 0.46 | 0.42 | 0.37 | 0.31 | 0.27 | 0.22 | 0.16 |
| Stage X | 0.96 | 0.93 | 0.90 | 0.87 | 0.82 | 0.79 | 0.73 | 0.70 | 0.68 | 0.55 | 0.47 | 0.38 | 0.34 | 0.31 | 0.24 | |
For each subject, we selected the five thresholds with the largest difference between the C values of the brain network parameters in these two stages, which are shown in bold font form in Table 1. The mean value of the thresholds corresponding to the bold font data was calculated. The average threshold value is 0.41. According to the same abovementioned method, the threshold value corresponding to G was calculated. The average threshold value was found to be 0.29. We calculate the average value of the thresholds corresponding to G and C. Finally, the average threshold value was 0.35. In our study, the mean value of the threshold (T = 0.35) was chosen as the fixed threshold. With the fixed threshold, the network parameters C and G for all subjects at different stages were computed.
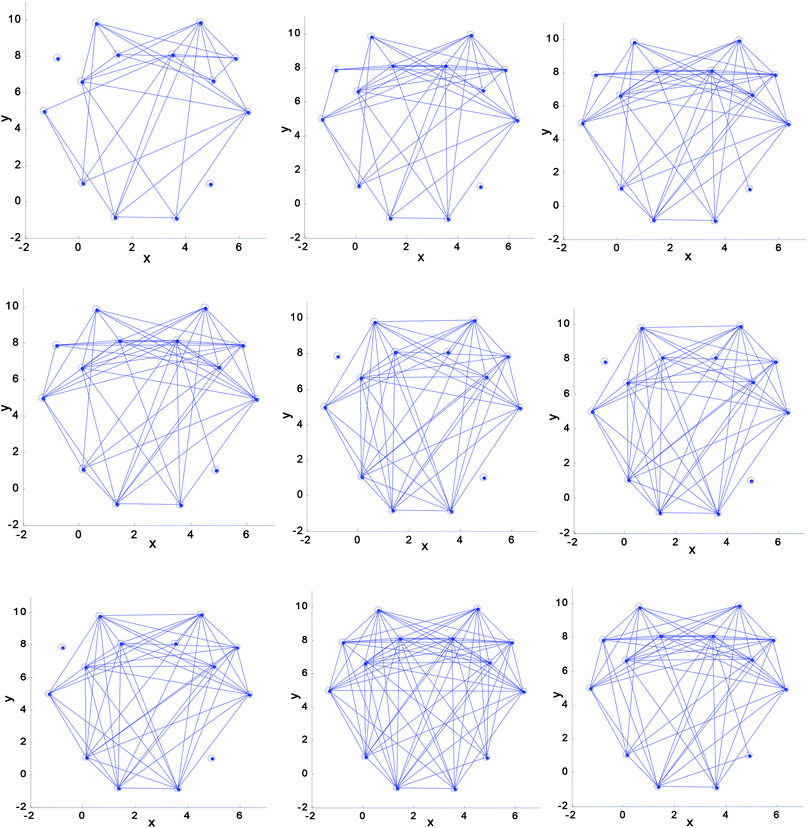
Fig. 5 shows that the density of the brain network connectivity is sparse in the initial driving stage. The degree of connection of the brain networks gradually increases with time. The brain network parameters C and G can be calculated using eqn (5) and (7), respectively. The change tendency of the mean value of the two parameters is shown in Fig. 6.
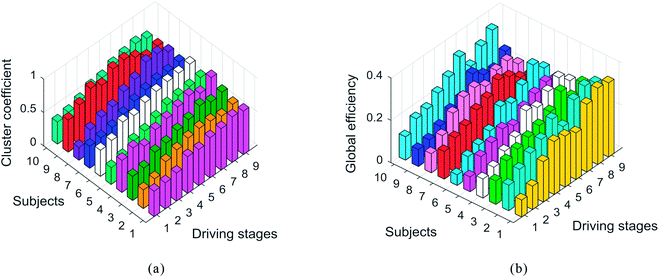 | ||
| Fig. 6 Variation tendency of the cluster coefficient (C) and the global efficiency (G) at 9 driving stages, (a) cluster coefficient of the brain networks, (b) global efficiency of the brain networks. | ||
From Fig. 6, we can clearly see that these two brain network parameters (C and G) increase with driving time. Previous studies on brain networks showed that upward changes of the two parameters (C and G) of the brain networks indicated a lack of alertness.44,45 Therefore, the increase in values of the two parameters (C and G) over time can demonstrate that there is an increase in driver fatigue at successive stages in our experiment.
4.2 The relative power spectrum ratio
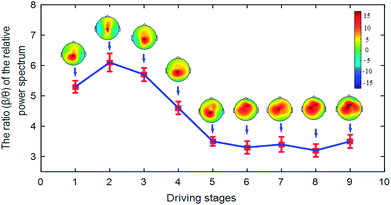
Research shows that it is a very common method to analyze driver fatigue using the relative power spectrum ratio method of EEG signals. In our experiment, the variation tendency of the relative power spectrum ratio (β/θ) over time is shown in Fig. 7.Fig. 7 shows that the ratio (β/θ) of the relative power spectrum presents a downward tendency over time. This indicates that brain activity is reduced with time. The degree of fatigue of the subjects deepens gradually. In addition, the brain topography shown in Fig. 7 can indicate the nerve activity of the drivers. For brain topography, low activity is indicated by the blue-shaded areas, while high activity is indicated by the red-shaded areas. Hence, we can draw the conclusion that the degree of brain nerve activity gradually decreased in the brain regions (C3, C4, P3, and P4) in driving stages 1 to 9.
4.3 Subjective questionnaire
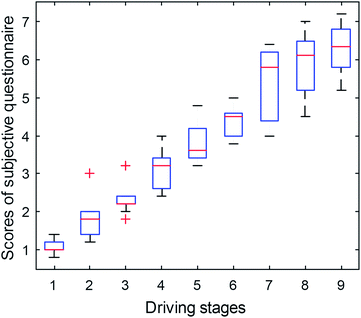
Research has shown that the subjective questionnaire is a common way to detect human fatigue.46,47 In this paper, Fig. 8 shows the variation tendency of the average score of questionnaires for 20 subjects at the 9 stages.As clearly shown in Fig. 8, the average scores of the questionnaires for the subjects present an increasing trend, which indicates that the degree of subjective fatigue degrees of subjects increases gradually with the progress of the experiment.
4.4 Correlation coefficient
The correlation coefficient between C, G, score and β/θ can be calculated using the eqn (4). The results are shown in Table 2.| C | G | Score | β/θ | |
|---|---|---|---|---|
| C | 1.0000 | 0.9480 | 0.9723 | −0.9498 |
| G | 0.9480 | 1.0000 | 0.8977 | −0.9287 |
| Score | 0.9723 | 0.8977 | 1.0000 | −0.8921 |
| β/θ | −0.9498 | −0.9287 | −0.8921 | 1.0000 |
Table 2 shows that the value of the correlation coefficients between variables C, G, score and β/θ is greater than 0.85, which indicates that these variables have a high correlation. Thus, it is concluded that the analysis based on the characteristics of complex brain networks is as effective at detecting driver fatigue as the relative power spectrum and the subjective questionnaire methods.
5 Discussion
Research shows that driver fatigue can lead to traffic accidents.2,5,6,12–14 Considerable research has been carried out on driver fatigue.5–14 The changes in EEG characteristics, which are sensitive to neural activity,48,49 are recognized as the most reliable indicators of driver fatigue.50,51 In this study, we used the characteristics of complex brain networks to evaluate driver fatigue.5.1 Previous studies
Research shows that great progress has been made in evaluating driver fatigue by using physiological signals such as EEG and EOG. In addition, the subjective questionnaire is recognized as an effective method for analyzing driver fatigue.46,47 However, EEG acquisition devices are relatively expensive and inconvenient to carry, which could limit the future popularization and applications in real driving conditions. Additionally, the subjective questionnaire method may be inconvenient for real-time detection of driver fatigue in actual driving.In previous studies, structural, functional and effective connectivity were the three most commonly used types of connectivity in the field of nerve connection research. Guo et al. investigated the effective connectivity of neuronal circuits activated by manual acupuncture.52 In the study of nerve activity, the synchronization algorithms for network reconstruction were effectively used.53,54 In our study, the activities of the neuronal clusters suppressed when a driver was in a state of mental fatigue. At this time, their activities were relatively consistent. Therefore, the signal correlation between different brain regions is relatively strong, which can be easily expressed by the simple algorithm: the Pearson correlation coefficient. In addition, we found that excess EEG data selected in each channel can result in false connections to the brain network. On the contrary, the change in driver fatigue characteristics is evident if we select 16–32 data points in the data set per second for each channel.
5.2 Novel findings of this study
In this study, the brain network was used to investigate driver fatigue. The results show that the brain network connections of drivers become increasingly dense with the increase in driver fatigue at successive stages. This indicates that the neuron clusters in major regions of the brain, when a driver is in a state of non-mental fatigue, are in a relatively independent active state. At this time, their activities are not consistent. Therefore, the signal correlation between different brain regions is poor, which leads to a sparse brain network connection. However, the activities of the neuronal clusters are suppressed when a driver is in a state of mental fatigue. At this time, their activities show relative consistency. Therefore, the signal correlation between different brain regions is relatively strong, which leads to a relatively dense network connection. Furthermore, this method could identify driver fatigue as effectively as the conventional methods (the relative power spectrum ratio and subjective questionnaire). Based on the discovery of the above features, we think that this method can be used to detect diver fatigue. Additionally, the acquisition equipment (Emotiv), which has a lower price than the traditional EEG equipment, is convenient and practical for use in actual driving. Moreover, the EEG data can be collected and analyzed online, which is of great significance for future practical application.In addition, in these studies, the relatively few EEG electrodes, which only involved major brain regions, were used. However, the results of these studies were satisfactory. In our study, we used the Emotiv equipment with 14 conductive poles to analyze the driving fatigue characteristics in a real driving environment. The result showed that the characteristics of brain networks in our study show some regular changes with the increase in driving time.
5.3 Limitations and future research lines
In this study, we used scalp-level connectivity to study driver fatigue characteristics. However, this method has some limitations. For example, dandruff and other scalp attachments can affect the connection of the acquisition electrodes. In order to reduce the influence of such factors on the experimental results, we asked each subject to wash their hair one hour before the experiment. In addition, the signal from the scalp-level is relatively weak and is easily interfered by electromagnetic signals. Thus, we avoided a strong electromagnetic environment in the experiment. In future research, portable equipment that can accurately detect driver fatigue and alleviate fatigue with time will be developed and popularized.6 Conclusion
The EEG signals of coach bus drivers were collected using portable acquisition equipment (Emotiv) in a real driving environment. We used the clustering coefficient (C) and the global efficiency (G) of the complex brain networks to analyze the brain functional differences of drivers over time combined with the relative power spectrum ratio of EEG signals and the subjective questionnaire of the drivers. Then, we analyzed the characteristics of driver fatigue. The results show that changes in driver fatigue can be effectively detected by calculating the data characteristics of brain networks in a real driving environment.Conflicts of interest
The authors declare no conflicts of interest.Acknowledgements
We gratefully acknowledge the financial support by the National Natural Science Foundation of China (51605419), Northeast Electric Power University (BSJXM-201521), the Jilin City Science and Technology Bureau (20166012) and the Project Agreement for Science and Technology Development of Jilin Province (20170520099JH). We also thank Professor Hong Wang for her help in the experiment.References
- A. Williamson and R. Friswell, The effect of external non-driving factors, payment type and waiting and queuing on fatigue in long distance trucking, Accid. Anal. Prev., 2013, 58, 26–34 CrossRef PubMed.
- R. Fu, H. Wang and W. Zhao, Dynamic driver fatigue detection using hidden Markov model in real driving condition, Expert Syst. Appl., 2016, 63, 397–411 CrossRef.
- P. A. Desmond and G. Matthews, Individual differences in stress and fatigue in two field studies of driving, Transp. Res. Part F Traffic Psychol. Behav., 2009, 12, 265–276 CrossRef.
- E. A. Schmidt, M. Schrauf, M. Simon, A. Buchner and W. E. Kincses, The short-term effect of verbally assessing drivers' state on vigilance indices during monotonous daytime driving, Transp. Res. Part F Traffic Psychol. Behav., 2011, 14, 251–260 CrossRef.
- J. M. Morales, C. Díazpiedra, H. Rieiro, J. Roca-González, S. Romero, A. Catena, L. J. Fuentes and L. L. di Stasi, Monitoring driver fatigue using a single-channel electroencephalographic device: A validation study by gaze-based, driving performance, and subjective data, Accid. Anal. Prev., 2017, 109, 62–69 CrossRef PubMed.
- A. Vakulin, A. D'Rozario, J. W. Kim, B. Watson, N. Cross, D. Wang, A. Coeytaux, D. Bartlett, K. Wong and R. Grunstein, Quantitative sleep EEG and polysomnographic predictors of driving simulator performance in obstructive sleep apnea, Clin. Neurophysiol., 2016, 127, 1428–1435 CrossRef PubMed.
- R. Chai, S. H. Ling, P. P. San, G. R. Naik, T. N. Nguyen, Y. Tran, A. Craig and H. T. Nguyen, Improving EEG-Based Driver Fatigue Classification Using Sparse-Deep Belief Networks, Front. Neurosci., 2017, 11, 103 CrossRef PubMed.
- R. Chai, G. R. Naik, T. N. Nguyen, S. H. Ling, Y. Tran, A. Craig and H. T. Nguyen, Driver Fatigue Classification with Independent Component by Entropy Rate Bound Minimization Analysis in an EEG-Based System, IEEE J. Biomed. Health Inform., 2017, 21, 715–724 Search PubMed.
- C. S. Wei, Y. T. Wang, C. T. Lin and T. P. Jung, Toward Drowsiness Detection Using Non-Hair-Bearing EEG-Based Brain-Computer Interfaces, IEEE Trans. Neural Syst. Rehabil. Eng., 2018, 26, 400–406 Search PubMed.
- R. N. Khushaba, S. Kodagoda, D. Liu and G. Dissanayake, Muscle computer interfaces for driver distraction reduction, Comput. Methods Programs Biomed., 2013, 110, 137–149 CrossRef PubMed.
- C. Zhao, M. Zhao, J. Liu and C. Zheng, Electroencephalogram and electrocardiograph assessment of mental fatigue in a driving simulator, Accid. Anal. Prev., 2012, 45, 83–90 CrossRef PubMed.
- Z. Piotrowski and M. Szypulska, Classification of falling asleep states using HRV analysis, Biocybern. Biomed. Eng., 2017, 37, 290–301 CrossRef.
- S. Benedetto, M. Pedrotti, L. Minin, T. Baccino, A. Re and R. Montanari, Driver workload and eye blink duration, Transp. Res. Part F Traffic Psychol. Behav., 2011, 14, 199–208 CrossRef.
- X. Fan, Y. Sun and B. Yin, et al., Gabor-based dynamic representation for human fatigue monitoring in facial image sequences, Pattern Recognit. Lett., 2010, 31(3), 234–243 CrossRef.
- S. K. L. Lal and A. Craig, A critical review of the psychophysiology of driver fatigue, Biol. Psychol., 2001, 55(3), 173–194 CrossRef PubMed.
- P. Artaud, S. Planque and C. Lavergne, et al., An on-board system for detecting lapses of alertness in car driving, Proceedings Of The Fourteenth International Technical Conference On Enhanced Safety Of Vehicles, 1995, (94-S2-O-08) Search PubMed.
- B. T. Jap, S. Lal and P. Fischer, et al., Using EEG spectral components to assess algorithms for detecting fatigue, Expert Syst. Appl., 2009, 36(2), 2352–2359 CrossRef.
- V. Siemionow, Y. Fang and L. Calabrese, et al., Altered central nervous system signal during motor performance in chronic fatigue syndrome, Clin. Neurophysiol., 2004, 115(10), 2372–2381 CrossRef PubMed.
- C. Papadelis, C. Kourtidou-Papadeli and P. D. Bamidis, et al., Indicators of sleepiness in an ambulatory EEG study of night driving, Engineering in Medicine and Biology Society, 2006, EMBS'06. 28th Annual International Conference of the IEEE, IEEE, 2006, pp. 6201–6204 Search PubMed.
- A. W. Keizer, R. S. Verment and B. Hommel, Enhancing cognitive control through neurofeedback: A role of gamma-band activity in managing episodic retrieval, NeuroImage, 2010, 49(4), 3404–3413 CrossRef PubMed.
- Y. Haitao, et al., Functional brain connectivity in Alzheimer's disease: An EEG study based on permutation disalignment index, Phys. A, 2018, 506, 1093–1103 CrossRef.
- J. Wang, et al., Functional brain networks in Alzheimer's disease: EEG analysis based on limited penetrable visibility graph and phase space method, Phys. A, 2016, 460, 174–187 CrossRef.
- G. Zhong-Ke, et al., Wavelet multiresolution complex network for decoding brain fatigued behavior from P300 signals, Phys. A, 2018, 506, 221–228 CrossRef.
- S. Kar, A. Routray and B. P. Nayak, Functional network changes associated with sleep deprivation and fatigue during simulated driving: Validation using blood biomarkers, Clin. Neurophysiol., 2011, 122(5), 966–974 CrossRef PubMed.
- S. Charbonnier, R. N. Roy and S. Bonnet, et al., EEG index for control operators' mental fatigue monitoring using interactions between brain regions, Expert Syst. Appl., 2016, 52(C), 91–98 CrossRef.
- J. P. Hampson, et al., Altered resting brain connectivity in persistent cancer related fatigue, Neuroimage Clin., 2015, 8, 305–313 CrossRef PubMed.
- H. Yu, et al., Modulation of Spectral Power and Functional Connectivity in Human Brain by Acupuncture Stimulation, IEEE Trans. Neural Syst. Rehabil. Eng., 2018, 26(5), 977–986 Search PubMed.
- N. X. Kodama, et al., Anti-correlated cortical networks arise from spontaneous neuronal dynamics at slow timescales, Sci. Rep., 2018, 8(1), 666 CrossRef PubMed.
- H. Yu, et al., Functional brain networks in healthy subjects under acupuncture stimulation: An EEG study based on nonlinear synchronization likelihood analysis, Phys. A, 2017, 468, 566–577 CrossRef.
- K. Schindler, C. E. Elger and K. Lehnertz, Changes of EEG synchronization during low-frequency electric stimulation of the seizure onset zone, Epilepsy Res., 2007, 77(2–3), 108–119 CrossRef PubMed.
- S. Kar, A. Routray and B. Prasad Nayak, Functional network changes associated with sleep deprivation and fatigue during simulated driving: validation using blood biomarkers, Clin. Neurophysiol., 2011, 122(5), 966–974 CrossRef PubMed.
- M. Ahmadlou and H. Adeli, Functional community analysis of brain: A new approach for EEG-based investigation of the brain pathology, NeuroImage, 2011, 58(2), 401–408 CrossRef PubMed.
- C. J. Stam and J. C. Reijneveld, Graph theoretical analysis of complex networks in the brain, Nonlinear Biomed. Phys., 2007, 1(1), 3 CrossRef PubMed.
- E. T. Bullmore and D. S. Bassett, Brain graphs: graphical models of the human brain connectome, Annu. Rev. Clin. Psychol., 2011, 7, 113–140 CrossRef PubMed.
- E. Bullmore and O. Sporns, Complex brain networks: graph theoretical analysis of structural and functional systems, Nat. Rev. Neurosci., 2009, 10(3), 186–198 CrossRef PubMed.
- M. Rubinov and O. Sporns, Complex network measures of brain connectivity: uses and interpretations, NeuroImage, 2010, 52(3), 1059–1069 CrossRef PubMed.
- S. Kar, A. Routray and B. P. Nayak, Functional network changes associated with sleep deprivation and fatigue during simulated driving: validation using blood biomarkers, Clin. Neurophysiol., 2011, 122(5), 966–974 CrossRef PubMed.
- A. Messé, G. Marrelec and P. Bellec, et al., Comparing structural and functional graph theory features in the human brain using multimodal MRI, IRBM, 2012, 33(4), 244–253 CrossRef.
- T. P. K. Breckel, C. M. Thiel and C. Giessing, The efficiency of functional brain networks does not differ between smokers and non-smokers, Psychiatry Res., Neuroimaging, 2013, 214(3), 349–356 CrossRef PubMed.
- H. J. Eoh, M. K. Chung and S. H. Kim, Electroencephalographic study of drowsiness in simulated driving with sleep deprivation, Int. J. Ind. Ergon., 2005, 35(4), 307–320 CrossRef.
- J. B. Thomas, L. Saroj and F. Peter, Comparing Combinations Of Eeg Activity In Train Drivers During Monotonous Driving, Expert Syst. Appl., 2011, 38(1), 996–1003 CrossRef.
- S. Johansson, C. Ytterberg and B. Back, et al., The Swedish occupational fatigue inventory in people with multiple sclerosis, J. Rehabil. Med., 2008, 40(9), 737–743 CrossRef PubMed.
- B. C. M. van Wijk, C. J. Stam and A. Daffertshofer, Comparing brain networks of different size and connectivity density using graph theory, PLoS One, 2010, 5(10), e13701 CrossRef PubMed.
- D. S. M. Pincus, I. M. Gladstone and R. A. Ehrenkranz, A regularity statistic for medical data analysis, Journal of Clinical Monitoring, 1991, 7, 335–345 CrossRef PubMed.
- N. Li, Y. Wang, M. S. Wang and H. Liu, Effects of sleep deprivation on gamma oscillation of waking human EEG, Prog. Nat. Sci., 2009, 18, 1533–1538 CrossRef.
- J. L. G. Gutiérrez, B. M. Jiménez, E. G. Hernández and A. L. López, Spanish version of the Swedish Occupational Fatigue Inventory (SOFI): Factorial replication, reliability and validity, Int. J. Ind. Ergon., 2005, 35, 737–746 CrossRef.
- S. W. Samn and L. P. Perelli Estimating Aircrew Fatigue: A Technique with Implications to Airlift Operations, Technical Report No. SAM-TR-82-21, USAF School of Aerospace Medicine, San Antonio, TX, USA, 1982 Search PubMed.
- Z. Yang, Y. Wang and G. Ouyang, Adaptive neuro-fuzzy inference system for classification of background EEG signals from ESES patients and controls, Sci. World J., 2014, 2014, 140863 Search PubMed.
- Z. Liang, Y. Wang, Y. Ren, D. Li, L. Voss, J. Sleigh and X. Li, Detection of burst suppression patterns in EEG using recurrence rate, Sci. World J., 2014, 2014, 295070 Search PubMed.
- S. K. L. Lal and A. Craig, A critical review of the psychophysiology of driver fatigue, Biol. Psychol., 2001, 55, 173–194 CrossRef PubMed.
- P. Artaud, S. Planque, C. Lavergne, H. Cara, P. de Lepine, C. Tarriere and B. Gueguen, An on-board system for detecting lapses of alertness in car driving, Proc. Int. Tech. Conf. Enhanc. Safety Veh., 1995, 1995, 350–359 (Phys. A, 2017, 471, 674–687) Search PubMed.
- H. Yu, X. Guo and Q. Qin, et al., Synchrony dynamics underlying effective connectivity reconstruction of neuronal circuits, Phys. A, 2017, 471, 674–687 (Phys. A, 2018, 492, 931–940) CrossRef.
- H. Yu, L. Cai and X. Wu, et al., Investigation of phase synchronization of interictal EEG in right temporal lobe epilepsy, Phys. A, 2018, 492, 931–940 CrossRef.
- F. Wang, H. Wang and R. Fu, Real-Time ECG-Based Detection of Fatigue Driving Using Sample Entropy, Entropy, 2018, 20(3), 196 CrossRef.
| This journal is © The Royal Society of Chemistry 2018 |

