 Open Access Article
A highly sensitive and selective chemosensor for Pb2+ based on quinoline–coumarin†
Xianjiao Menga,
Duanlin Caoa,
Zhiyong Huab,
Xinghua Hanab,
Zhichun Lia and
Wenbing Ma *ab
*ab
aSchool of Chemical Engineering and Technology, North University of China, Taiyuan 030051, P. R. China. E-mail: mawenbing@nuc.edu.cn
bNational Demonstration Center for Experimental Comprehenisve Chemical Engineering Education, North University of China, Taiyuan 030051, P. R. China
First published on 2nd October 2018
Abstract
In this study, a highly sensitive and selective fluorescent chemosensor, ethyl(E)-2-((2-((2-(7-(diethylamino)-2-oxo-2H-chromene-3-carbonyl)hydrazono)methyl)quinolin-8-yl)oxy)acetate (1), was synthesized and characterized by 1H NMR, 13C NMR and ESI-MS. Sensor 1 showed an “on–off” fluorescence response to Pb2+ with a 1![[thin space (1/6-em)]](https://www.rsc.org/images/entities/char_2009.gif) :
:![[thin space (1/6-em)]](https://www.rsc.org/images/entities/char_2009.gif) 1 binding stoichiometry in CH3CN/HEPES buffer medium (9
1 binding stoichiometry in CH3CN/HEPES buffer medium (9![[thin space (1/6-em)]](https://www.rsc.org/images/entities/char_2009.gif) :
:![[thin space (1/6-em)]](https://www.rsc.org/images/entities/char_2009.gif) 1 v/v). The detection limit of sensor 1 to Pb2+ was determined to be 0.5 μM, and the stable pH range for Pb2+ detection was from 4 to 8.
1 v/v). The detection limit of sensor 1 to Pb2+ was determined to be 0.5 μM, and the stable pH range for Pb2+ detection was from 4 to 8.
Introduction
The highly sensitive and selective fluorescent chemosensors for “naked eye” detection of heavy transition metal ions have received considerable attention in recent years.1–4 Pb2+ as an important transition element plays an essential role in various fields.5 The maximum contaminant level of Pb2+ ions in drinking water is set to 10 μg L−1,6 and exposure to excessive lead can cause mental retardation, muscle paralysis, and memory loss, particularly in children. For this reason, much effort has been made to develop effective methods for Pb2+ detection, including ICP-OES (inductively coupled plasma optical emission spectrometry),7 ICP-MS(inductively coupled plasma mass spectrometry),8 AFS (atomic fluorescent spectrometry)9 and AAS (atomic absorption spectrometry),10 and are capable of the multiple and quantitative determination of Pb2+ ion, however, the application of these conventional instrument-based detection methods can be hampered by the need for sophisticated instruments, and complex sampling designs and data analysis; whereas fluorescent chemosensors11–14 appear to be more effective at Pb2+ detection due to their high selectivity and sensitivity.Although many fluorescence chemosensors have been shown to be capable of identifying Pb2+/Ag+,15 Pb2+/Fe3+/Hg2+,16 and Pb2+/Hg2+/Cd2+,17 they may show poor binding selectivity for Pb2+ over other heavy transition metal ions, which would decrease the accuracy of Pb2+ detection in practical applications.18 Thus, there is a practical need to develop highly sensitive and selective fluorescent chemosensors for naked eye detection of Pb2+.19–23
8-Hydroxyquinoline-based derivatives have been widely used as fluorescent chemosensors due to their strong coordination ability with metal ions.24–26 However, these fluorescent chemosensors often exhibit enhanced fluorescence signals in the detection of metal ions due to their weaker fluorescence. Attempts have been made to introduce coumarin-based derivatives as strong fluorescent groups in order to expand the application of 8-hydroxyquinoline.27–29
In this study, we reported a novel, highly sensitive and selective fluorescent chemosensor 1 with coumarin as the fluorescence group and C![[double bond, length as m-dash]](https://www.rsc.org/images/entities/char_e001.gif) N bond and quinoline as the identification group for the detection of Pb2+. The introduction of hydroxyl into the flexible chain resulted in an improvement of the stability and the selectivity of metal ions. The results showed that sensor 1 showed higher selectivity and sensitivity toward Pb2+ over many other metal ions in CH3CN/HEPES buffer medium (9
N bond and quinoline as the identification group for the detection of Pb2+. The introduction of hydroxyl into the flexible chain resulted in an improvement of the stability and the selectivity of metal ions. The results showed that sensor 1 showed higher selectivity and sensitivity toward Pb2+ over many other metal ions in CH3CN/HEPES buffer medium (9![[thin space (1/6-em)]](https://www.rsc.org/images/entities/char_2009.gif) :
:![[thin space (1/6-em)]](https://www.rsc.org/images/entities/char_2009.gif) 1 v/v, pH = 7.4).
1 v/v, pH = 7.4).
Experimental
Materials and methods
Other solvents and starting materials were purchased from Aladdin and Energy Chemical Reagents Ltd., (Shanghai, China). Ultrapure water was used in all experiments. The melting points of intermediate and sensor 1 were measured on a WRS-C1 digital melting-point apparatus (Shanghai, China). The pH of all solutions was adjusted on a PHS-3C pH meter (Shanghai, China). The 1H NMR (400 MHz) and 13C NMR (100 MHz) spectra were recorded on a Bruker AVANCE III spectrometer (Switzerland) in CDCl3 solution. The SEI-MS spectra of intermediate and sensor 1 were recorded on a Bruker Solarix XR Fourier transform-ion cyclotron resonance (FT-ICR) mass spectrometer. The UV-spectra were recorded on a UV-2602 spectrophotometer (Shanghai, China), and the fluorescence spectra were recorded on a HITACHIF-2500 spectrophotometer (Japan).Synthesis
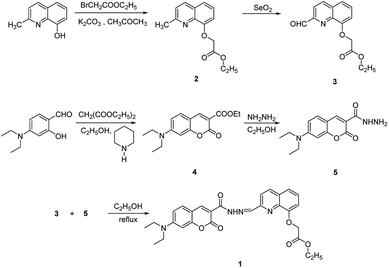
Solid 2 (1.5 g, 6 mmol) was dissolved in 1, 4-dioxane (20 mL), and SeO2 (0.75 g, 6.8 mmol) was added at 65 °C. The mixture was stirred at 80 °C for 2 h and then cooled to room temperature. The solvent was removed under reduced pressure, and 1.31 g of white crystalline solid 3 was obtained by recrystallization from ethyl acetate/hexane (10 mL, 1![[thin space (1/6-em)]](https://www.rsc.org/images/entities/char_2009.gif) :
:![[thin space (1/6-em)]](https://www.rsc.org/images/entities/char_2009.gif) 1, v/v) with a 87% yield and a melting point of 137.3–137.6 °C.
1, v/v) with a 87% yield and a melting point of 137.3–137.6 °C.
Solid 4 (2.02 g, 7 mmol) and hydrazine monohydrate (1.4 mL, 28 mmol) were dissolved in ethanol (20 mL) under argon. The mixture was stirred at reflux temperature for 25 min, and then cooled to yield a large amount of precipitate. The precipitate was filtered, washed thoroughly with cold ethanol to obtain yellow product 5 with a 67.2% yield and a melting point of 171.7–172.5 °C.
General procedure for recording fluorescence spectra
All fluorescence spectra were recorded on a HITACHIF 2500 fluorescence spectrometer after the addition of metal ions and anions in CH3CN/HEPES (9![[thin space (1/6-em)]](https://www.rsc.org/images/entities/char_2009.gif) :
:![[thin space (1/6-em)]](https://www.rsc.org/images/entities/char_2009.gif) 1, v/v) buffer (pH = 7.4), and then the excitation wavelength was determined as 440 nm. Metal ions were prepared from chlorine salts of Fe3+, Al3+, Cu2+, Pb2+, Zn2+, Hg2+, Ca2+, Ba2+, Mg2+, Ag+, Cs+, Li+, K+ and Na+.
1, v/v) buffer (pH = 7.4), and then the excitation wavelength was determined as 440 nm. Metal ions were prepared from chlorine salts of Fe3+, Al3+, Cu2+, Pb2+, Zn2+, Hg2+, Ca2+, Ba2+, Mg2+, Ag+, Cs+, Li+, K+ and Na+.
Results and discussion
Effect of pH
Fig. 1 showed the variation of fluorescence intensity of sensor 1 with pH in the absence and presence of Pb2+ ions in CH3CN/HEPES buffer medium (9![[thin space (1/6-em)]](https://www.rsc.org/images/entities/char_2009.gif) :
:![[thin space (1/6-em)]](https://www.rsc.org/images/entities/char_2009.gif) 1 v/v). The pH was adjusted with 1 N HCl or 1 N NaOH aqueous solution. At pH 3–8, free 1 showed a strong fluorescence, and 1 + Pb2+ showed a weak fluorescence; while at pH > 8, free 1 showed a weak fluorescence, because the coumarin lactone ring was converted into hydroxycarboxylate under alkaline conditions. Thus, the stable pH range for Pb2+ detection was from 4 to 8, at which free 1 showed stable and strong fluorescence, and fluorescence quenching reached the minimum with the addition of Pb2+.
1 v/v). The pH was adjusted with 1 N HCl or 1 N NaOH aqueous solution. At pH 3–8, free 1 showed a strong fluorescence, and 1 + Pb2+ showed a weak fluorescence; while at pH > 8, free 1 showed a weak fluorescence, because the coumarin lactone ring was converted into hydroxycarboxylate under alkaline conditions. Thus, the stable pH range for Pb2+ detection was from 4 to 8, at which free 1 showed stable and strong fluorescence, and fluorescence quenching reached the minimum with the addition of Pb2+.
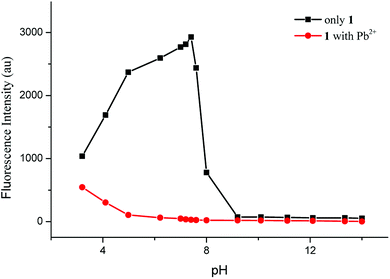 | ||
Fig. 1 Variation of fluorescence intensity of sensor 1 (10 μM) in CH3CN/HEPES buffer medium (9![[thin space (1/6-em)]](https://www.rsc.org/images/entities/char_2009.gif) : :![[thin space (1/6-em)]](https://www.rsc.org/images/entities/char_2009.gif) 1 v/v, pH = 7.4) with and without Pb2+ ions (10 equiv.) with pH at room temperature. 1 v/v, pH = 7.4) with and without Pb2+ ions (10 equiv.) with pH at room temperature. | ||
UV-vis spectral response of sensor 1 to Pb2+
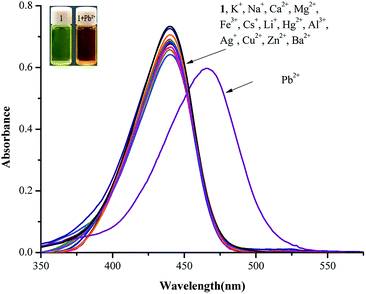
The absorption behavior of probe 1 was investigated by UV-vis spectroscopy in the presence of various metal ions, including Fe3+, Al3+, Cu2+, Pb2+, Zn2+, Hg2+, Ca2+, Ba2+, Mg2+, Ag+, Cs+, Li+, K+ and Na+, in CH3CN/HEPES buffer medium (9![[thin space (1/6-em)]](https://www.rsc.org/images/entities/char_2009.gif) :
:![[thin space (1/6-em)]](https://www.rsc.org/images/entities/char_2009.gif) 1 v/v, pH = 7.4). All absorption spectra showed no remarkable change except that the addition of Pb2+ resulted in a red shift of 440 nm to 465 nm and a color change from bright yellow to orange (Fig. 2).
1 v/v, pH = 7.4). All absorption spectra showed no remarkable change except that the addition of Pb2+ resulted in a red shift of 440 nm to 465 nm and a color change from bright yellow to orange (Fig. 2).
As shown in Fig. 3, the absorption intensity at 440 nm decreased dramatically with the gradual addition of Pb2+ up to 20 equiv. into 10 μM sensor 1 in CH3CN/HEPES buffer medium (9![[thin space (1/6-em)]](https://www.rsc.org/images/entities/char_2009.gif) :
:![[thin space (1/6-em)]](https://www.rsc.org/images/entities/char_2009.gif) 1 v/v, pH = 7.4); whereas that at 465 nm increased gradually with the addition of Pb2+, indicating the formation of 1–Pb2+ complex. In addition, isosbestic points at 451 nm could be clearly observed, thus confirming that probe 1 and 1–Pb2+ complex existed in equilibrium.
1 v/v, pH = 7.4); whereas that at 465 nm increased gradually with the addition of Pb2+, indicating the formation of 1–Pb2+ complex. In addition, isosbestic points at 451 nm could be clearly observed, thus confirming that probe 1 and 1–Pb2+ complex existed in equilibrium.
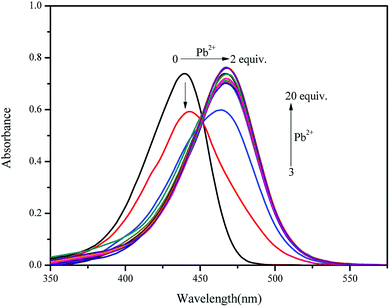 | ||
Fig. 3 UV-vis spectra of sensor 1 (10 μM) with the addition of various concentrations [0, 1, 2, 3, 4, 5, 6, 7, 8, 9, 10, 15 and 20 equiv.] of Pb2+ in CH3CN/HEPES buffer medium (9![[thin space (1/6-em)]](https://www.rsc.org/images/entities/char_2009.gif) : :![[thin space (1/6-em)]](https://www.rsc.org/images/entities/char_2009.gif) 1 v/v, pH = 7.4). 1 v/v, pH = 7.4). | ||
Fluorescence responses of sensor 1 to Pb2+
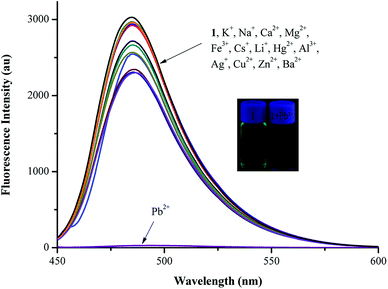
The sensing ability of sensor 1 was investigated by fluorescence experiments in the presence of various metal ions (10 equiv.), including Fe3+, Al3+, Cu2+, Pb2+, Zn2+, Hg2+, Ca2+, Ba2+, Mg2+, Ag+, Cs+, Li+, K+ and Na+, in CH3CN/HEPES buffer medium (9![[thin space (1/6-em)]](https://www.rsc.org/images/entities/char_2009.gif) :
:![[thin space (1/6-em)]](https://www.rsc.org/images/entities/char_2009.gif) 1 v/v, pH = 7.4). The fluorescence spectra were observed at 485 nm (λex: 440 nm). Sensor 1 showed a marked fluorescence quenching toward Pb2+ compared with other metal ions, resulting in a clear color change from bright yellow to orange. It also showed a high selectivity for Pb2+ and a remarkable fluorescence “turn-off” response (Fig. 4).
1 v/v, pH = 7.4). The fluorescence spectra were observed at 485 nm (λex: 440 nm). Sensor 1 showed a marked fluorescence quenching toward Pb2+ compared with other metal ions, resulting in a clear color change from bright yellow to orange. It also showed a high selectivity for Pb2+ and a remarkable fluorescence “turn-off” response (Fig. 4).
Pb2+-selective sensing experiments were performed with 10 μM of sensor 1 in the presence of various metal ions, including Fe3+, Al3+, Cu2+, Zn2+, Hg2+, Ca2+, Ba2+, Mg2+, Ag+, Cs+, Li+, K+ and Na+ (10 equiv.), as shown in Fig. 5. Upon the addition of 10 equiv. of Pb2+ ions, the solution still showed a distinct fluorescence quenching. All these results suggested that sensor 1 could be used as a chemosensor for selective detection of Pb2+ over a wide range of metal ions.
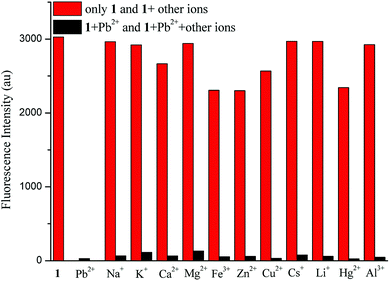 | ||
| Fig. 5 Fluorescent intensity of sensor 1 (10 μM) with selected cations (10 equiv.) in the absence (red bars) or presence (black bars) of Pb2+ (10 equiv.). | ||
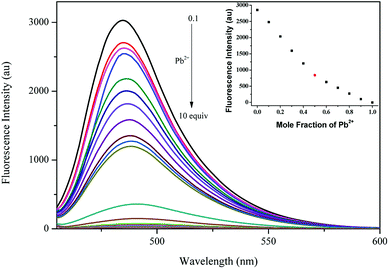
In order to gain further insight into the sensing behavior of sensor 1 to Pb2+, fluorescence titration experiments were performed. Fig. 6 showed that the fluorescence intensity decreased gradually with the increasing concentration of Pb2+. A dramatic fluorescence quenching was observed, and the quenching efficiency reached a maximum of 99% [(I0 − I)/I0 × 100%] with the addition of 10 equiv. of Pb2+. The Job plots with fluorescence titrations showed a minimum at about 0.5 mol fractions, indicating that sensor 1 formed a 1![[thin space (1/6-em)]](https://www.rsc.org/images/entities/char_2009.gif) :
:![[thin space (1/6-em)]](https://www.rsc.org/images/entities/char_2009.gif) 1 complex with Pb2+ (Scheme 1).
1 complex with Pb2+ (Scheme 1).
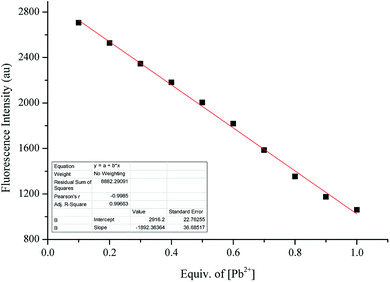
The binding constant Ka was determined to be 2041 M−1 (R2 = 0.9973, Fig. 7). The detection limit was determined to be 0.5 μM according to the formula LOD = 3σ/m, where m was the slope of the linear equation Y = aX + b between fluorescence intensity and concentration (Fig. 8).
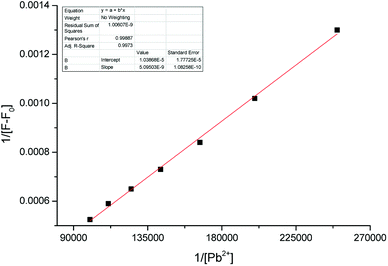 | ||
| Fig. 7 The Benesi–Hildebrand plot of sensor 1 with Pb2+. Linear equation: Y = 5.09 × 10⁻⁹ × X + 1.04 × 10⁻⁵, R2 = 0.9973, Ka = 2043 M−1. | ||
The possible mechanism of sensor 1with Pb2+
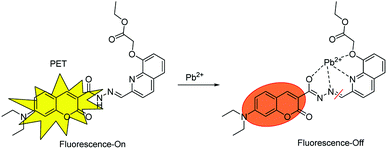
The fluorescence quenching efficiency reached a maximum of 99% [(I0 − I)/I0 × 100%] with the addition of 10 equiv. of Pb2+, and no shift of the emission spectra with increasing Pb2+ concentration was observed. This was in good agreement with the PET mechanism. In addition, the Job's plots indicated that sensors 1 chelated Pb2+ with 1![[thin space (1/6-em)]](https://www.rsc.org/images/entities/char_2009.gif) :
:![[thin space (1/6-em)]](https://www.rsc.org/images/entities/char_2009.gif) 1 stoichiometry, as illustrated in Scheme 2, the addition of Pb2+ ion caused obvious fluorescence quenching and a color change from bright yellow to orange.
1 stoichiometry, as illustrated in Scheme 2, the addition of Pb2+ ion caused obvious fluorescence quenching and a color change from bright yellow to orange.
Conclusions
In this study, we have successfully prepared a fluorescence chemosensor 1 with coumarin as the fluorescence group and C![[double bond, length as m-dash]](https://www.rsc.org/images/entities/char_e001.gif) N bond and quinoline as the identification group. The pH test showed that the optimal pH range was from 4 to 8, indicating that sensor 1 could be used under acid and neutral conditions and in vivo cell tests. The absorption spectra showed no remarkable changes upon the addition of 10 equiv. of different metal ions, except that the addition of Pb2+ resulted in a red shift of 440 nm to 465 nm and a color change from bright yellow to orange. The fluorescence spectra showed an obvious quenching response to Pb2+ with a quenching efficiency of 99%. The Job plots showed that sensor 1 formed a 1
N bond and quinoline as the identification group. The pH test showed that the optimal pH range was from 4 to 8, indicating that sensor 1 could be used under acid and neutral conditions and in vivo cell tests. The absorption spectra showed no remarkable changes upon the addition of 10 equiv. of different metal ions, except that the addition of Pb2+ resulted in a red shift of 440 nm to 465 nm and a color change from bright yellow to orange. The fluorescence spectra showed an obvious quenching response to Pb2+ with a quenching efficiency of 99%. The Job plots showed that sensor 1 formed a 1![[thin space (1/6-em)]](https://www.rsc.org/images/entities/char_2009.gif) :
:![[thin space (1/6-em)]](https://www.rsc.org/images/entities/char_2009.gif) 1 binding stoichiometry to Pb2+, and the detection limit was 1.9 × 10⁻⁶ M, indicating high sensitivity of sensor 1 for Pb2+. In addition, sensor 1 can be used for naked eye detection of Pb2+, which can greatly broaden its applications.
1 binding stoichiometry to Pb2+, and the detection limit was 1.9 × 10⁻⁶ M, indicating high sensitivity of sensor 1 for Pb2+. In addition, sensor 1 can be used for naked eye detection of Pb2+, which can greatly broaden its applications.
Conflicts of interest
There are no conflicts to declare.Acknowledgements
We gratefully acknowledge the financial support from the Science Foundation of North University of China (No. 110121).Notes and references
- Z. Q. Zhang, X. W. He, Y. J. Shang, Z. Y. Yu, S. F. Wang and F. L. Wu, Chem. Res. Chin. Univ., 2017, 33, 31–35 CrossRef CAS.
- S. Goswami, A. Manna, K. Aich and S. Paul, Chem. Lett., 2012, 41, 1600–1602 CrossRef CAS.
- Y. Yu, W. Dou, X. Hu, X. L. Tang, X. Y. Zhou and W. S. Liu, J. Fluoresc., 2012, 22, 1547–1553 CrossRef CAS PubMed.
- F. Zapata, A. Caballero, A. Espinosa, A. Tárraga and P. Molina, Org. Lett., 2007, 9, 2385–2388 CrossRef CAS PubMed.
- O. Sunnapu, N. G. Kotla, B. Maddiboyina, S. Singaravadivel and G. Sivaraman, RSC Adv., 2016, 6, 656–660 RSC.
- M. Alfonso, A. Tárraga and P. Molina, J. Org. Chem., 2011, 76, 939–947 CrossRef CAS PubMed.
- K. A. Hall, L. Jiang and R. K. Marcus, J. Anal. At. Spectrom., 2017, 32, 2463–2468 RSC.
- M. Corte Rodríguez, R. Álvarez-Fernández García, E. Blanco, J. Bettmer and M. Montes-Bayón, Anal. Chem., 2017, 89, 11491–11497 CrossRef PubMed.
- Z. Liu, Z. Zhu, H. Zheng and S. Hu, Anal. Chem., 2012, 84, 10170–10174 CrossRef CAS PubMed.
- M. Resano, M. Aramendía and M. A. Belarra, J. Anal. At. Spectrom., 2014, 29, 2229–2250 RSC.
- T. Sun, Q. F. Niu, Z. R. Guo and T. D. Li, Tetrahedron Lett., 2017, 58, 252–256 CrossRef CAS.
- J. H. Bi, M. X. Fang, J. B. Wang, S. Xia, Y. B. Zhang, J. T. Zhang, G. Vegesna, S. W. Zhang, M. Tanasova, F. T. Luo and H. Y. Liu, Inorg. Chim. Acta, 2017, 468, 140–145 CrossRef CAS.
- S. Samanta, B. K. Datta, M. Boral, A. Nandan and G. Das, Analyst, 2016, 141, 4388–4393 RSC.
- M. Devi, A. Dhir and C. P. Pradeep, RSC Adv., 2016, 6, 112728–112736 RSC.
- Y. Zhang, W. Chen, X. Dong, H. Fan, X. Wang and L. Bian, Sens. Actuators, B, 2018, 261, 58–65 CrossRef CAS.
- Z. Zhang, S. Lu, C. Sha and D. Xu, Sens. Actuators, B, 2015, 208, 258–266 CrossRef CAS.
- W. Su, S. Yuan and E. Wang, J. Fluoresc., 2017, 27, 1871–1875 CrossRef CAS PubMed.
- Z. Q. Hu, C. S. Lin, X. M. Wang, L. Ding, C. L. Cui, S. F. Liu and H. Y. Lu, Chem. Commun., 2010, 46, 3765–3767 RSC.
- L. L. Liang, F. F. Lan, S. G. Ge, J. H. Yu, N. Ren and M. Yan, Anal. Chem., 2017, 89, 3597–3605 CrossRef CAS PubMed.
- Shaily, A. Kumar, I. Parveen and N. Ahmed, Luminescence, 2018, 33, 713–721 CrossRef CAS PubMed.
- M. W. Wang, F. Wang, Y. Wang, W. Zhang and X. Q. Chen, Dyes Pigm., 2015, 120, 307–313 CrossRef CAS.
- K. P. Nandre, A. L. Puyad, S. V. Bhosale and S. V. Bhosale, Talanta, 2014, 130, 103–107 CrossRef CAS PubMed.
- F. Zapata, A. Caballero, A. Espinosa, A. Tárraga and P. Molina, J. Org. Chem., 2009, 74, 4787–4796 CrossRef CAS PubMed.
- E. Bardez, I. Devol, B. Larrey and B. Valeur, J. Phys. Chem. B, 1997, 101, 7786–7793 CrossRef CAS.
- V. A. Montes, R. Pohl, J. Shinar and P. Anzenbacher Jr, Chem.–Eur. J., 2006, 12, 4523–4535 CrossRef CAS PubMed.
- K. G. Vaswani and M. D. Keränen, Inorg. Chem., 2009, 43, 5797–5800 CrossRef PubMed.
- Y. W. Duan, H. Y. Tang, Y. Guo, Z. K. Song, M. J. Peng and Y. Yan, Chin. Chem. Lett., 2014, 25, 1082–1086 CrossRef CAS.
- N. Roy, S. Nath, A. Dutta, P. Mondal, P. C. Paul and T. S. Singh, RSC Adv., 2016, 6, 63837–63847 RSC.
- G. F. Wu, M. X. Li, J. J. Zhu, K. W. C. Lai, Q. X. Tong and F. Lu, RSC Adv., 2016, 6, 100696–100699 RSC.
- M. M. Yu, R. L. Yuan, C. X. Shi, W. Zhou, L. H. Wei and Z. X. Li, Dyes Pigm., 2013, 99, 887–894 CrossRef CAS.
- Z. T. Xing, H. C. Wang, Y. X. Cheng, T. D. James and C. J. Zhu, Chem.–Asian J., 2011, 6, 3054–3058 CrossRef CAS PubMed.
Footnote |
| † Electronic supplementary information (ESI) available. See DOI: 10.1039/c8ra04935a |
| This journal is © The Royal Society of Chemistry 2018 |

