 Open Access Article
Enhanced electrocatalytic performance of nickel diselenide grown on graphene toward the reduction of triiodide redox couples†
Xiao Zhang ,
Haijun Zhang
 ,
Xingyu Wang and
Xiaomeng Zhou*
Center for Aircraft Fire and Emergency, Civil Aviation University of China, Tianjin 300300, P. R. China. E-mail: zhouxm@nankai.edu.cn
First published on 6th August 2018
Abstract
The promising activity of nickel diselenide (NiSe2) towards electrocatalysis has made it especially attractive in energy conversion fields. However, NiSe2 with high electrocatalytic performance always requires complicated fabrication or expensive conductive polymers, resulting in the scale-up still being challenging. Herein, we introduce a simple and cost-effective synthesis of NiSe2 dispersed on the surface of graphene (NiSe2/RGO NPs). NiSe2/RGO NPs exhibited enhanced electrocatalytic performance and long-term stability for the reduction reaction of triiodide redox couples in dye-sensitized solar cells (DSSCs). Leveraging the advantageous features, the DSSC fabricated with NiSe2/RGO NPs as CE had a smaller charge-transfer resistance (Rct) value and higher short-circuit current density and fill factor than naked NiSe2 NPs. Additionally, NiSe2/RGO NPs achieved a PCE of 7.76%, higher than that of pure NiSe2 (6.51%) and even exceeding that of Pt (7.56%). These prominent features demonstrated that the NiSe2/RGO NPs in this work are a promising cheap and efficient electrocatalyst to replace state-of-the-art Pt.
1. Introduction
Increasingly serious environmental problems and energy crises have resulted in an urgent need for renewable clean energy to replace the diminishing fossil fuel.1–4 Dye-sensitized solar cells (DSSCs) are a promising alternative to the conventional inorganic silicon-based solar cell owing to their environmental friendliness, facile fabrication, low cost and high power conversion efficiency (PCE).5–7 The cost and performance of a DSSC is strongly influenced by its counter electrode (CE) materials. Traditionally, noble metal platinum (Pt) coated on an FTO substrate has proven to be a preferable CE for DSSCs because of its excellent catalytic activity and high conductivity.8–10 Nevertheless, its drawbacks of high cost (US$50/gram), low natural abundance in earth (0.0037 ppm), and being easily decomposed to harmful PtI4 and H2PtI6 byproducts, make it unsuitable in terms of sustainable development.11,12 Given the above considerations, it is of great importance and desirability to develop a low-cost, earth-abundant and anticorrosive Pt-free electrocatalyst with high electrical conductivity and excellent catalytic activity simultaneously for the reduction of I3.13–17Given the above considerations, earth-abundant transitional metal dichalcogenides (MX2, M = Fe, Co, or Ni and X = S or Se) have been applied as CE electrocatalysts and found to be competitive Pt alternatives, benefiting from their intrinsic metallic properties.15,18–21 Especially, nickel diselenide (NiSe2) is a Pauli paramagnetic metal with a resistivity below 10−3 Ω cm, and its metallicity makes it use in electrocatalyst applications appealing.22–24 Although considerable advances have been made to NiSe2 electrocatalysts, the lack of ability to engineer NiSe2 nanostructures frequently leads to agglomeration of NiSe2 during high-temperature synthesis and electrocatalytic reaction processes for the isotropic crystal structures, which leads to a decrease in surface area, electrical conductivity and the number of catalytically active sites. Although some modified preparation methods and conductive polymers have been employed to fabricate robust and stable NiSe2 electrocatalysts with enhanced electrocatalytic performance, complicated and expensive electrode fabrication procedures mean that scale-up is still challenging. In this regard, the most practical fabrication is nothing more than using facile one-step solvothermal methods to grow nanostructured NiSe2 anchored on self-standing conductive carbon supports (graphene, carbon cloth, carbon fiber paper).25,26 The assembly of pristine NiSe2 onto suitable carbon supports improves the dispersed distribution of NiSe2 nanostructures, maintains the exposed surface and enhances the application efficiency of active sites.
Following this line of thought, in the present work, we devoted our efforts to fabricating NiSe2 nanoparticles grown on reduced graphene oxide (RGO) through a facile one-step solvothermal method. The as-obtained NiSe2 nanoparticles dispersed on the surface of RGO (NiSe2/RGO NPs) exhibited more efficient active sites and charge-transfer pathways compared with pure NiSe2 nanoparticles (NiSe2 NPs). Taking advantage of this combination, the DSSC fabricated with the NiSe2/RGO NPs as the CE exhibited a smaller charge-transfer resistance (Rct) value and higher short-circuit current density (JSC) than those of pure NiSe2 NPs. Additionally, NiSe2/RGO NPs achieved a PCE of 7.76%, higher than that of pure NiSe2 (6.51%) and even exceeding that of Pt (7.56%). These prominent features demonstrated that NiSe2/RGO NPs are one of the most ideal electroactive materials to replace expensive Pt material for DSSC.
2. Experimental
2.1 Synthesis of graphene oxide
Before synthesizing the NiSe2/RGO NPs and NiSe2 NPs, graphene oxide (GO) was firstly prepared by a modified Hummers' method; detailed information is shown in the ESI.†27 The concentration of GO aqueous solution was about 10 mg mL−1.2.2 Synthesis of NiSe2/RGO NPs and NiSe2 NPs
NiSe2/RGO NPs were prepared by a simple solvothermal method. A typical preparation procedure was as follows: 3 mmol of Ni(CH3COO)2·4H2O was dissolved in 35 mL of distilled water. Then 5 mL of GO aqueous solution was added under continuous stirring for 1 hour to form a uniform dispersion. After this, 6 mmol of Se powder was placed into the mixture. Subsequently, 5 mL of hydrazine hydrate was added dropwise to reduce the Se and GO. The resulting solution was put into a Teflon-lined autoclave of 50 mL capacity and heated at 150 °C for 15 h. Then, the autoclave was allowed to cool to room temperature naturally. The product was washed with water and absolute ethanol to remove impurities, and then dried at 60 °C. Similarly, NiSe2 NPs were synthesized by the same method without graphene.2.3 Characterization of obtained samples
The crystallinity and composition of the samples were characterized by X-ray diffraction (XRD, D/max-2500, JAPAN SCIENCE) with Cu Kα radiation (λ = 1.54056 Å). The chemical states and bonding characteristics of the samples were determined by Raman spectra (Renishaw inVia spectrometer, 514.5 nm laser) and X-ray photoelectron spectroscopy (XPS) analysis (PHI 5000 VersaProbe). The morphology of the samples was studied by field-emission scanning electron microscopy (FE-SEM, Nanosem 430, FEI). More detailed insight into the microstructure of the sample was obtained by high-resolution transmission electron microscopy (TEM, Tecnai G2 F20, operating at 200 kV, FEI).2.4 Fabrication of DSSCs
The CE materials slurry was made in ethanol by mixing 0.1 g of CE materials powder with 0.025 g of PEG20000, which was used as the dispersant as well as the binder, and stirred continuously. A film was then made by using a doctor-blade to wipe the CE materials slurry on FTO conductive glass (LOF, TEC-15, 15 W per square). After the film was steady, the conductive glass with film was heated at 400 °C for 1 h under the protection of argon, and the counter electrode was obtained.A commercial TiO2 sol (Solaronix, Ti-Nanoxide T/SP) was used to prepare the TiO2 film on FTO also through the doctor-blade method, and the film was soaked in an N719 dye solution (in ethanol) for 24 h to obtain dye-sensitized TiO2 electrodes. DSSCs were assembled by injecting the electrolyte into the aperture between the dye-sensitized TiO2 electrode and the counter electrode. The liquid electrolyte was composed of 0.05 M I2, 0.1 M LiI, 0.6 M 1, 2-dimethyl-3-propylimidazolium iodide (DMPII), and 0.5 M 4-tert-butyl pyridine with acetonitrile as the solvent. Surlyn 1702 was used as the spacer between the two electrodes. The two electrodes were clipped together and solid paraffin was used as the sealant to prevent the electrolyte solution from leaking. The effective cell area was 0.25 cm2. The standard sputtered Pt CE was purchased from Dalian Heptachroma Solar Tech Co., Ltd.
2.5 Characterization of CEs and DSSCs
All the electrochemical measurements were obtained using the Zahner IM6 electrochemical workstation. Photocurrent–voltage curves were obtained under simulated AM 1.5 illumination (100 mW cm−2, Trusttech CHF-XM-500W) with a Keithley digital source meter (Keithley 2410, USA). Electrochemical impedance spectroscopy (EIS) analysis was conducted at zero bias potential and the impedance data covered a frequency range of 0.1 Hz to 1 MHz. The amplitude of the sinusoidal AC voltage signal was 5 mV. The analyses of the resulting impedance spectra were conducted using Zview 2.0 software. Tafel–polarization measurements were employed in a symmetrical dummy cell, which was used in the EIS experiments. The electrolyte was as the same of the electrolyte of DSSC. The scan rate was 20 mV s−1, and the voltage range was −1.0 to 1.0 V. Cyclic voltammetry (CV) was recorded using a three-electrode system on the electrochemical workstation. Pt was used as the counter electrode and Ag/AgCl was used as the reference electrode. A solution of 10.0 mM LiI, 1.0 mM I2, and 0.1 M LiClO4 in acetonitrile served as the electrolyte.3. Results and discussion
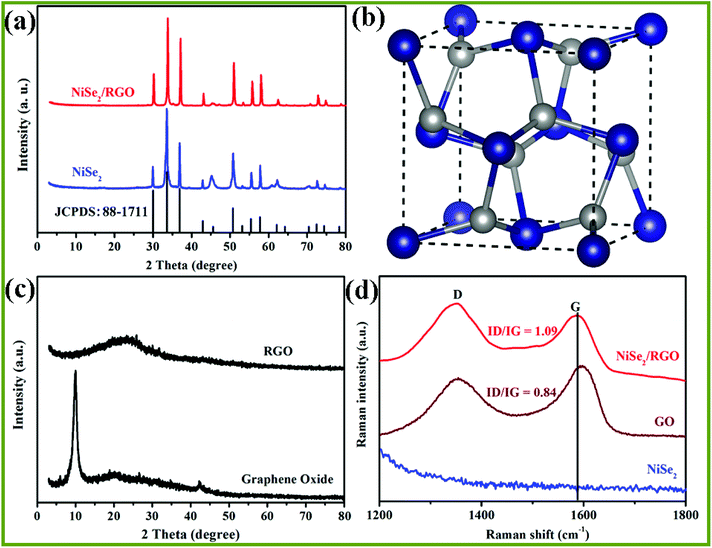
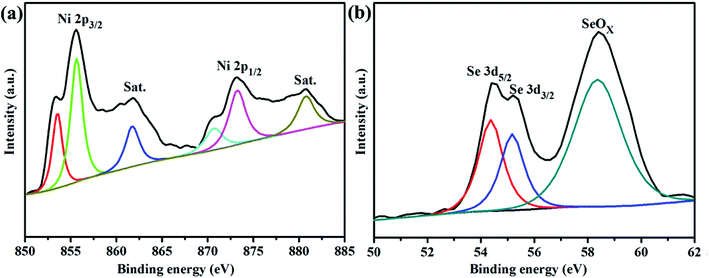
XRD and Raman spectroscopy were employed to determine the crystalline-phase structures and purity of the as-prepared NiSe2/RGO, NiSe2 and GO samples. Fig. 1a displays the XRD patterns of NiSe2/RGO (red line) and NiSe2 (green line) for reference. The XRD patterns revealed that all diffraction peaks of both NiSe2/RGO and NiSe2 samples are sharp, indicative of the good crystallization of the as-prepared samples. The strongest peak of NiSe2/RGO and NiSe2 samples was found at position 33.41°, corresponding to the (210) plane. Major diffraction peaks observed at diffraction angles are in a good agreement with the cubic NiSe2 (JCPDS card, no. 88-1711) and a previous report.28 It is worth noting that no other impurity phases were detected, confirming the very high purity of the obtained NiSe2/RGO and NiSe2 samples. Besides, the obtained NiSe2 possesses a pyrite structure (Fig. 1b) with the octahedral arrangement of the adjacent Se atoms units between two Ni atoms.22,29 As seen in Fig. 1c, GO shows a significant (002) peak at 10.02°, while the main peak of RGO shifted to a larger angle at 23.6°. In the Raman spectra (Fig. 1d), two characteristic peaks in accordance with the D and G bands of NiSe2/RGO and GO were clearly observed. Furthermore, the G band shifted to lower frequency with the increased ID/IG ratio (1.09) in NiSe2/RGO compared with GO (ID/IG was 0.84). The shifted Raman frequency and increased ID/IG ratio further confirmed the reduction of GO and the presence of RGO in NiSe2/RGO.30The chemical states and surface composition of NiSe2/RGO were identified by XPS spectra (Fig. 2). In the high-resolution Ni 2p spectrum (Fig. 2a), six asymmetric peaks could be observed. Two peaks at 855.6 and 873.2 eV correspond to Ni 2p3/2 and Ni 2p1/2, respectively. The peaks at 853.4 and 870.6 eV are ascribed to Ni2+ ions, the peaks at 855.6 and 873.2 eV are ascribed to Ni3+ ions in the surface oxide phase, while two satellite peaks at 861.8 and 880.8 eV are ascribed to the Ni2+ oxidation state.24,31 Deconvoluting the Se peak, the peaks with binding energies of 54.4 eV (Se 3d5/2) and 55.2 eV (Se 3d3/2) originate from a pyrite NiSe2 compound, while another peak with binding energy of 58.4 eV corresponds to the surface oxidation of Se species.25,31 XRD, Raman and XPS characterizations confirmed that NiSe2/RGO and NiSe2 were obtained.
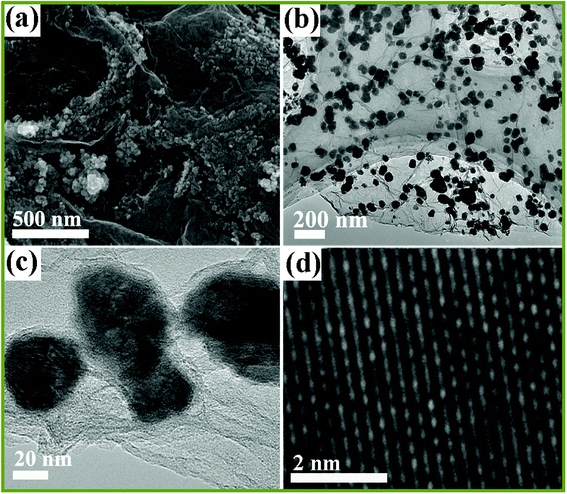
The microstructure and morphology of NiSe2/RGO NPs was investigated by scanning electron microscopy (SEM) and transmission electron microscopy (TEM). The SEM image in Fig. 3a shows that the NiSe2/RGO samples are nano-sized particles and tend to disperse on the surface of graphene nanosheets. The low magnification TEM image (Fig. 3b) further implies that the as-obtained NiSe2/RGO samples were dispersed on the graphene, and the grey ultrathin nanosheets in the range of vision are graphene. The nanoparticle diameter of the NiSe2/RGO samples is in the range of 35 to 50 nm, determined by magnified TEM image (Fig. 3c). From the HRTEM image (Fig. 3d), the distinct lattice spacing of the NiSe2/RGO NPs nm can be observed. In contrast with the serious agglomeration of pure NiSe2 NPs (Fig. S1†), the dispersed distribution of NiSe2/RGO NPs with the addition of graphene could increase the amount of efficient catalytic active sites, improve the charge-transfer ability and enhance the catalytic activity. SEM and TEM measurements of graphene are shown in Fig. S2.†
To investigate the charge-transfer ability and catalytic activity of NiSe2/RGO NPs and NiSe2 NPs samples as CEs of DSSCs, Nyquist plots of the electrochemical impedance spectroscopy (EIS) for CEs were obtained using symmetric dummy cells fabricated with a sandwich-like structure (CE/electrolyte/CE). The Nyquist plots are shown in Fig. 4 and the relevant equivalent circuit diagram is shown as an inset; the corresponding parameters fitted by Z-view software are listed in Table 1. The intercept of the real axis of high frequency in Nyquist plots is series resistance (RS), and the diameter of the high-frequency (left) semicircle is charge transfer resistance (Rct).32 The RS value of NiSe2 NPs CE is 14.99 Ω cm−2, and after being combined with graphene the RS value of NiSe2/RGO NPs CE is 14.26 Ω cm−2, slightly lower than that of Pt CE (RS = 14.53 Ω cm−2). Rct is the other important parameter obtained in Nyquist plots, negatively correlating with the charge-transfer ability and catalytic activity of the CEs.16,33 Simultaneously, from the parameters in Table 1, the Rct value of NiSe2/RGO NPs CE (Rct = 1.52 Ω cm−2) is also lower than that of NiSe2 NPs CE (Rct = 3.82 Ω cm−2), and even inferior to that of Pt CE (Rct = 1.72 Ω cm−2), indicative of its supreme electrocatalytic activity for triiodide reduction.19,34 The integration of low Rct and RS of NiSe2/RGO NPs CE can efficiently lower the charge transfer resistance and facilitate the transfer of electron, thus contributing to the improvement of the electrocatalytic performance of DSSCs.35
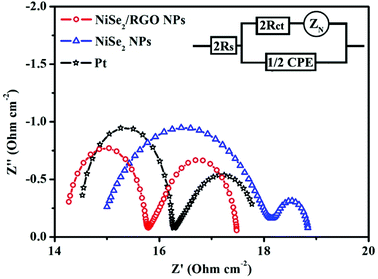 | ||
| Fig. 4 Nyquist plots for dummy cells fabricated with NiSe2/RGO NPs, NiSe2 NPs and Pt CEs. The inset gives the equivalent circuit. | ||
| CE | RS (Ohm cm−2) | Rct (Ohm cm−2) | Jlim![[thin space (1/6-em)]](https://www.rsc.org/images/entities/char_2009.gif) log (mA cm−2) log (mA cm−2) |
Epp (mV) | JRed-1 (mA cm−2) |
|---|---|---|---|---|---|
| NiSe2/RGO NPs | 14.26 | 1.52 | 1.95 | 232 | 2.80 |
| NiSe2 NPs | 14.99 | 3.28 | 1.67 | 499 | 1.56 |
| Pt | 14.53 | 1.72 | 1.83 | 261 | 2.22 |
Tafel polarization measurement is an effective technique for examining the charge-transfer kinetics of CEs. Symmetric cells with the sandwich-type configuration of CEs are fabricated using the same method as that used for the EIS. The polarization zone of the Tafel polarization curve (Fig. 5) corresponds to the high-frequency region of Nyquist plots, and the diffusion zone relates to the low-frequency region.36,37 In the Tafel polarization curve, the limiting diffusion current density (Jlim, the intersection of the anodic branch with the y axis) and the exchange current density (J0, the slope for the anodic or cathodic branch) are closely correlated with the diffusion ability of I3− at the electrode/electrolyte interface and the electrocatalytic activity of the CEs, respectively.38,39 A higher Jlim reveals a larger ionic diffusion coefficient between the two electrodes based on eqn (1):
| D = lJlim/2nFC | (1) |
![[thin space (1/6-em)]](https://www.rsc.org/images/entities/char_2009.gif) log(mA cm−2)) is higher than that of the NiSe2 NPs CE (1.67
log(mA cm−2)) is higher than that of the NiSe2 NPs CE (1.67![[thin space (1/6-em)]](https://www.rsc.org/images/entities/char_2009.gif) log(mA cm−2)), and slightly exceeds that of the Pt CE (1.83
log(mA cm−2)), and slightly exceeds that of the Pt CE (1.83![[thin space (1/6-em)]](https://www.rsc.org/images/entities/char_2009.gif) log(mA cm−2)). On the other hand, a higher J0 indicates better catalytic activity for I3− reduction, and there is also a positive correlation between J0 and Rct based on eqn (2).40
log(mA cm−2)). On the other hand, a higher J0 indicates better catalytic activity for I3− reduction, and there is also a positive correlation between J0 and Rct based on eqn (2).40| J0 = RT/nFRct | (2) |
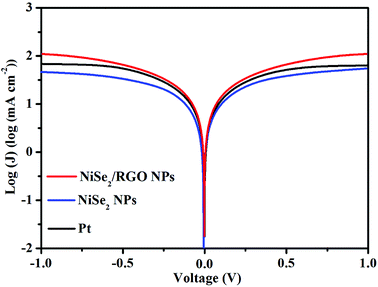 | ||
| Fig. 5 Tafel polarization curves for dummy cells fabricated with NiSe2/RGO NPs, NiSe2 NPs and Pt CEs between 1.0 and −1.0 V. | ||
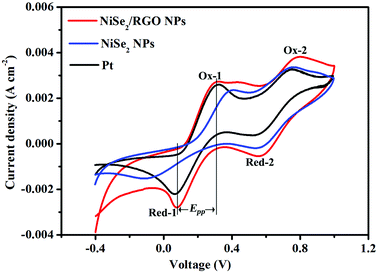
In order to further study the reaction kinetics of NiSe2/RGO NPs, NiSe2 NPs and Pt CEs for the reduction of triiodide, cyclic voltammetry (CV) was performed with a three-electrode system at a scan rate of 25 mV s−1. As presented in Fig. 6, two typical pairs of oxidation–reduction peaks can be clearly seen in each CV curve, indicating the same electrocatalytic mechanism toward triiodide reduction.12,41 From low potential to high potential, the reactions of four oxidation–reduction peaks can be ascribed to eqns (3)–(6):
| Ox-1: 3I− − 2e− = I3− | (3) |
| Ox-2: 2I3− − 2e− = 3I2 | (4) |
| Red-1: I3− + 2e− = 3I− | (5) |
| Red-2: 3I2 + 2e− = 2I3− | (6) |
The peak-to-peak potential separation (Epp) between Red-1 and Ox-1 and the peak current intensity of Red-1 (JRed-1) are two important parameters for assessing the electrocatalytic activity of a CE (Table 1). In detail, the Epp value is negatively correlated with the standard electrochemical rate constant and positively with overpotential loss, and JRed-1 is positively correlated with reaction velocity and electrocatalytic activity.10,42 The NiSe2/RGO NPs CE exhibited a lower Epp value (232 mV) and a higher JRed-1 value (2.80 mA cm−2) than those of the NiSe2 NPs CE (Epp = 499 mV, JRed-1 = 1.56 mA cm−2), revealing the better intrinsic electrocatalytic activity of the NiSe2/RGO NPs CE as well as a synergistic catalytic effect between NiSe2 and graphene. In comparison with the Pt (Epp = 261 mV, JRed-1 = 2.22 mA cm−2) CE, the Epp and JRed-1 of NiSe2/RGO NPs CE are also better, signifying that the electrocatalytic activity of the NiSe2/RGO NPs CE is even superior to that of the Pt CE.43,44
Photocurrent density-voltage (J–V) curves of the integrated DSSCs fabricated with NiSe2/RGO, NiSe2 and Pt CEs were measured under irradiation at 100 mW cm−2. The detailed photovoltaic parameters, including the values of open-circuit voltage (VOC), short-circuit photocurrent density (JSC), fill factor (FF) and power conversion efficiency (PCE), are summarized in Table 2. As shown in Fig. 7, it is obvious that the VOC values of the NiSe2/RGO NPs, NiSe2 NPs and Pt CEs are similar, owing to the same photoanode, dye and electrolyte. Remarkably, the DSSC based on NiSe2/RGO NPs CE reached a higher PCE (7.76%) compared to that of NiSe2 NPs CE (6.51%), which is even higher than that of Pt (PCE = 7.56%). This improvement may be visually attributed to the higher JSC value of the NiSe2/RGO NPs CE (17.15 mA cm−2) than those of the NiSe2 NPs CE (15.16 mA cm−2) and Pt CE (15.99 mA cm−2). On one hand, the well-dispersion of NiSe2 nanoparticles on the surface of graphene increased the number of catalytic active sites of NiSe2 nanoparticles for redox couple and enhanced the I3− reduction.45 On the other hand, the high conductive graphene provided faster electron transfer paths and accelerated the transfer of photogenerated electrons collected from the external circuit to active sites, thus promoting the electrochemical reaction kinetics for the reduction of I3− to I− at CE and the regeneration of the dye at the photoanode.46 All these results demonstrated that dispersed NiSe2 nanoparticles on graphene yielded enhanced electrocatalytic activity and high conversion efficiency. The electrocatalytic performance characterizations, EIS, CV, Tafel polarization and J–V curves of RGO are shown in Fig. S4.†
| CE | VOC (mV) | JSC (mA cm−2) | FF | PCE (%) |
|---|---|---|---|---|
| NiSe2/RGO NPs | 755 | 17.15 | 0.60 | 7.76 |
| NiSe2 NPs | 740 | 15.16 | 0.58 | 6.51 |
| Pt | 770 | 15.99 | 0.61 | 7.51 |
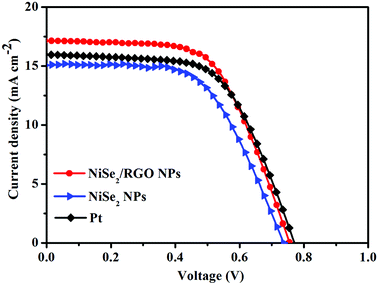 | ||
| Fig. 7 Photocurrent density–voltage curves of DSSCs fabricated with NiSe2/RGO NPs, NiSe2 NPs and Pt CEs under simulated sunlight irradiation (100 mW cm−2). | ||
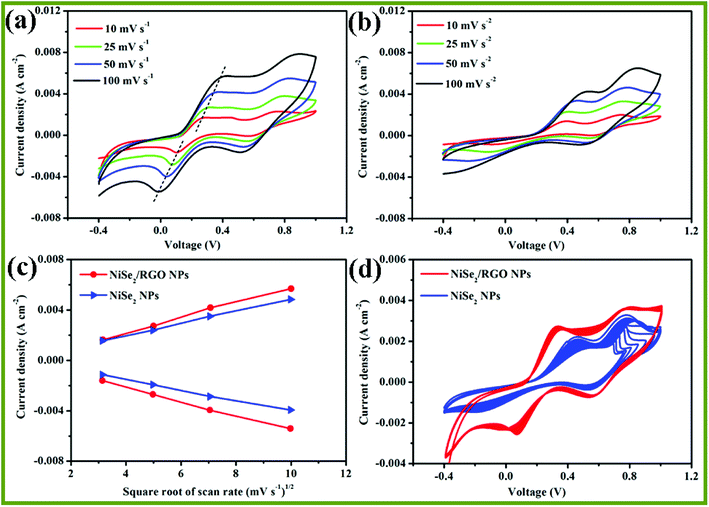
To elucidate the relationship between the peak current densities (Ox-1 and Red-1) and the scanning rates, cyclic voltammetry (CV) measurements of the NiSe2/RGO NPs and NiSe2 NPs electrodes were conducted at different scan rates. As shown in Fig. 8a and b, it can be clearly seen that NiSe2/RGO NPs and NiSe2 NPs electrodes both showed excellent reversible responses. Meanwhile, their reduction and oxidation peak currents increase gradually and regularly with the scan rate increasing from 10 to 100 mA cm−2. Fig. 8c illustrates the Ox-1 and Red-1 peak current densities of the NiSe2/RGO NPs and NiSe2 NPs CEs versus the square root of the scan rate. Both CEs exhibit nearly linear relationships for all the lines. Furthermore, the Ox-1 and Red-1 peak current densities of the NiSe2/RGO NPs at different scan rates are all higher than those of the NiSe2 NPs, further proving the enhanced electrocatalytic activity of the dispersed NiSe2 nanoparticles on graphene.36,47
The long-term stability of the NiSe2/RGO NPs and NiSe2 NPs CEs was evaluated by repeatedly recording 20-cycle CV curves at a scan rate of 25 mV s−1, as shown in Fig. 8d. It is apparent that the NiSe2 NPs CE showed an obvious change in peak current density and Epp after 20 cycles of scanning, which is owing to the aggregation during the electrocatalytic reaction. After being combined with graphene, the NiSe2/RGO NPs CE exhibited excellent long-term stability and negligible change took place, revealing that dispersed distribution on graphene effectively improved the chemical stability of NiSe2 NPs. The enhanced electrocatalytic performance and long-term stability demonstrated that NiSe2/RGO NPs are a good candidate electrocatalyst to replace expensive Pt materials for DSSCs.
4. Conclusion
In summary, in this work we successfully fabricated nickel diselenide electrocatalysts with enhanced electrocatalytic performance through a simple and cost-effective method. With the assistance of graphene, NiSe2/RGO NPs exhibited better charge-transfer ability and catalytic activity in comparison with expensive Pt electrodes. These enhanced electrocatalytic performance of NiSe2/RGO NPs were well demonstrated via its lower Rct, higher JSC, FF and PCE values. We believe that this work will have significant implications for enhancing electrocatalytic performance and the further development of nickel diselenide.Conflicts of interest
The authors declare no competing financial interest.Acknowledgements
The authors acknowledge the financial support from the National Science Foundation of China (No. 51776219).References
- U. Bach, D. Lupo, P. Comte, J. E. Moser, F. Weissortel, J. Salbeck, H. Spreitzer and M. Grätzel, Nature, 1998, 395, 583–585 CrossRef.
- H. Chen, F. Ye, W. T. Tang, J. J. He, M. S. Yin, Y. B. Wang, F. X. Xie, E. B. Bi, X. D. Yang, M. Grätzel and L. Y. Han, Nature, 2017, 550, 92–95 Search PubMed.
- A. Shah, P. Torres, R. Tscharner, N. Wyrsch and H. Keppner, Science, 1999, 285, 692–698 CrossRef PubMed.
- A. Yella, H. W. Lee, H. N. Tsao, C. Y. Yi, A. K. Chandiran, M. K. Nazeeruddin, E. W. G. Diau, C. Y. Yeh, S. M. Zakeeruddin and M. Grätzel, Science, 2011, 334, 629–634 CrossRef PubMed.
- S. F. Zhang, X. D. Yang, Y. H. Numata and L. Y. Han, Energy Environ. Sci., 2013, 6, 1443–1464 RSC.
- H. Ren, H. Shao, L. Zhang, D. Guo, Q. Jin, R. Yu, L. Wang, Y. Li, Y. Wang, H. Zhao and D. Wang, Adv. Energy Mater., 2015, 5, 1500296 CrossRef.
- K. Yoo, J. Y. Kim, J. A. Lee, J. S. Kim, D. K. Lee, K. Kim, J. Y. Kim, B. Kim, H. Kim, W. M. Kim, J. H. Kim and M. J. Ko, ACS Nano, 2015, 9, 3760–3771 CrossRef PubMed.
- J. H. Wu, Z. Lan, J. M. Lin, M. L. Huang, Y. F. Huang, L. Q. Fan, G. G. Luo, Y. Lin, Y. M. Xie and Y. L. Wei, Chem. Soc. Rev., 2017, 46, 5975–6023 RSC.
- M. Chen, L. L. Shao, Z. Y. Yuan, Q. S. Jing, K. J. Huang, Z. Y. Huang, X. H. Zhao and G. D. Zou, ACS Appl. Mater. Interfaces, 2017, 9, 17949–17960 CrossRef PubMed.
- S. Huang, J. Zai, D. Ma, Z. Hu, Q. He, M. Wu, D. Chen, Z. Chen and X. Qian, Electrochim. Acta, 2017, 241, 89–97 CrossRef.
- H. Yuan, Q. Z. Jiao, J. Li, X. F. Liu, H. Y. Yang, Y. Zhao, Q. Wu, D. X. Shi and H. S. Li, J. Power Sources, 2016, 336, 132–142 CrossRef.
- S. S. Huang, D. Ma, Z. J. Hu, Q. Q. He, J. T. Zai, D. Y. Chen, H. Sun, Z. W. Chen, Q. Q. Qao, M. H. Wu and X. F. Qian, ACS Appl. Mater. Interfaces, 2017, 9, 27607–27617 CrossRef PubMed.
- F. Du, X. Q. Zuo, Q. Yang, G. Li, Z. L. Ding, M. Z. Wu, Y. Q. Ma and K. R. Zhu, J. Mater. Chem. C, 2016, 4, 10323–10328 RSC.
- F. Du, X. Q. Zuo, Q. Yang, B. Yang, G. Li, H. B. Tang, H. L. Zhang, M. Z. Wu and Y. Q. Ma, Sol. Energy Mater. Sol. Cells, 2016, 149, 9–14 CrossRef.
- S. N. Yun, A. Hagfeldt and T. L. Ma, Adv. Mater., 2014, 26, 6210–6237 CrossRef PubMed.
- Q. L. Liu, Y. J. Dong, Y. Cao, H. Y. Chen, D. B. Kuang and C. Y. Su, Electrochim. Acta, 2017, 250, 244–250 CrossRef.
- P. J. Li, Y. G. Zhang, W. J. Fa, X. G. Yang and L. Wang, J. Power Sources, 2017, 360, 232–242 CrossRef.
- H. Q. Zhou, Y. M. Wang, R. He, F. Yu, J. Y. Sun, F. Wang, Y. C. Lan, Z. F. Ren and S. Chen, Nano Energy, 2016, 20, 29–36 CrossRef.
- X. D. Cui, Z. Q. Xie and Y. Wang, Nanoscale, 2016, 8, 11984–11992 RSC.
- Z. T. Jin, M. R. Zhang, M. Wang, C. Q. Feng and Z. S. Wang, Acc. Chem. Res., 2017, 50, 895–904 CrossRef PubMed.
- C. Yu, X. Meng, X. Song, S. Liang, Q. Dong, G. Wang, C. Hao, X. Yang, T. Ma, P. M. Ajayan and J. Qiu, Carbon, 2016, 100, 474–483 CrossRef.
- F. Wang, Y. Li, T. A. Shifa, K. Liu, F. Wang, Z. Wang, P. Xu, Q. Wang and J. He, Angew. Chem., Int. Ed., 2016, 55, 6919–6924 CrossRef PubMed.
- F. Gong, X. Xu, Z. Q. Li, G. Zhou and Z. S. Wang, Chem. Commun., 2013, 49, 1437–1439 RSC.
- B. Yu, X. Wang, F. Qi, B. Zheng, J. He, J. Lin, W. Zhang, Y. Li and Y. Chen, ACS Appl. Mater. Interfaces, 2017, 9, 7154–7159 CrossRef PubMed.
- H. Zhou, F. Yu, Y. Liu, J. Sun, Z. Zhu, R. He, J. Bao, W. A. Goddard, S. Chen and Z. Ren, Energy Environ. Sci., 2017, 10, 1487–1492 RSC.
- X. Meng, C. Yu, B. Lu, J. Yang and J. Qiu, Nano Energy, 2016, 22, 59–69 CrossRef.
- C. Y. Su, Y. P. Xu, W. J. Zhang, J. W. Zhao, X. H. Tang, C. H. Tsai and L. J. Li, Chem. Mater., 2009, 21, 5674–5680 CrossRef.
- X. Zhang, Y. X. Yang, S. Q. Guo, F. Z. Hu and L. Liu, ACS Appl. Mater. Interfaces, 2015, 7, 8457–8464 CrossRef PubMed.
- Z. Zhuang, Q. Peng, J. Zhuang, X. Wang and Y. Li, Chem. –Eur. J., 2005, 12, 211–217 CrossRef PubMed.
- B. Yang, X. Q. Zuo, P. Chen, L. Zhou, X. Yang, H. J. Zhang, G. Li, M. Z. Wu, Y. Q. Ma, S. W. Jin and X. S. Chen, ACS Appl. Mater. Interfaces, 2015, 7, 137–143 CrossRef PubMed.
- B. Wang, X. Wang, B. Zheng, B. Yu, F. Qi, W. Zhang, Y. Li and Y. Chen, Electrochem. Commun., 2017, 83, 51–55 CrossRef.
- K. Ahmad, A. Mohammad and S. M. Mobin, Electrochim. Acta, 2017, 252, 549–557 CrossRef.
- X. Meng, C. Yu, X. Song, Z. Liu, B. Lu, C. Hao and J. Qiu, J. Mater. Chem. A, 2017, 5, 2280–2287 RSC.
- M. Chen, G. Zhao, L. L. Shao, Z. Y. Yuan, Q. S. Jing, K. J. Huang, Z. Y. Huang, X. H. Zhao and G. D. Zou, Chem. Mater., 2017, 29, 9680–9694 CrossRef.
- H. Yuan, Q. Jiao, J. Liu, X. Liu, Y. Li, D. Shi, Q. Wu, Y. Zhao and H. Li, Carbon, 2017, 122, 381–388 CrossRef.
- X. Zhang, S. Q. Guo, M. M. Zhen, G. D. Gao and L. Liu, J. Electrochem. Soc., 2015, 162, H774–H779 CrossRef.
- S. Q. Guo, L. C. Wang, C. G. Zhang, G. C. Qi, B. C. Gu, L. Liu and Z. H. Yuan, Nanoscale, 2017, 9, 6837–6845 RSC.
- L. Li, Q. Lu, J. Y. Xiao, J. W. Li, H. Mi, R. Y. Duan, J. B. Li, W. M. Zhang, X. W. Li, S. Liu, K. Yang, M. X. Wu and Y. C. Zhang, J. Power Sources, 2017, 363, 9–15 CrossRef.
- J. Balamurugan, S. G. Peera, M. Guo, T. T. Nguyen, N. H. Kim and J. H. Lee, J. Mater. Chem. A, 2017, 5, 17896–17908 RSC.
- H. M. Li, X. Qian, C. L. Zhu, X. C. Jiang, L. Shao and L. X. Hou, J. Mater. Chem. A, 2017, 5, 4513–4526 RSC.
- Y. H. Wu, B. Zhou, C. Yang, X. Zhou and W. H. Zhang, Chem. Commun., 2017, 53, 5445–5448 RSC.
- W. Yang, X. Xu, Y. Gao, Z. Li, C. Li, W. Wang, Y. Chen, G. Ning, L. Zhang, F. Yang, S. Chen, A. Wang, J. Kong and Y. Li, Nanoscale, 2016, 8, 13059–13066 RSC.
- X. Meng, C. Yu, X. Song, J. Iocozzia, J. Hong, M. Rager, H. Jin, S. Wang, L. Huang, J. Qiu and Z. Lin, Angew. Chem., Int. Ed., 2018, 57, 4682–4686 CrossRef PubMed.
- X. Meng, C. Yu, X. Song, Y. Liu, S. Liang, Z. Liu, C. Hao and J. Qiu, Adv. Energy Mater., 2015, 5, 1500180 CrossRef.
- X. H. Miao, K. Pan, G. F. Wang, Y. P. Liao, L. Wang, W. Zhou, B. J. Jiang, Q. J. Pan and G. H. Tian, Chem.–Eur. J., 2014, 20, 474–482 CrossRef PubMed.
- Y. Lou, W. J. Zhao, C. G. Li, H. Huang, T. Y. Bai, C. L. Chen, C. Liang, Z. Shi, D. Zhang, X. B. Chen and S. H. Feng, ACS Appl. Mater. Interfaces, 2017, 9, 18046–18053 CrossRef PubMed.
- X. Qian, H. M. Li, L. Shao, X. C. Jiang and L. X. Hou, ACS Appl. Mater. Interfaces, 2016, 8, 29486–29495 CrossRef PubMed.
Footnote |
| † Electronic supplementary information (ESI) available. See DOI: 10.1039/c8ra05167d |
| This journal is © The Royal Society of Chemistry 2018 |

