 Open Access Article
Exploring the nature of the clopidogrel–bromocresol green interaction via spectrophotometric measurements and quantum chemical calculations†
Sabrein H. Mohamed *a,
Alyaa I. Magdyb and
Ashour A. Ahmed
 c
c
aChemistry Department, Faculty of Science, Cairo University, Giza, Egypt. E-mail: sabrein@sci.cu.edu.eg; sabrein_harbi@yahoo.com
bChemistry Department, Faculty of Engineering, Madina High Institute for Engineering and Technology, Giza, Egypt
cInstitute of Physics, University of Rostock, D-18059 Rostock, Germany
First published on 15th August 2018
Abstract
Clopidogrel is an oral, thienopyridine class antiplatelet agent used to inhibit blood clots in coronary arteries, peripheral vascular and cerebrovascular diseases. A spectrophotometric method was developed for clopidogrel bisulfate (CLOP·H2SO4) determination using bromocresol green (BCG) as an ion-pairing agent. To explore the binding nature of CLOP·H2SO4 with BCG at a molecular level, quantum chemical calculations have been performed. DFT based full geometry optimization has been carried out for BCG and clopidogrel in basic (CLOP) and protonated (CLOP+) forms as well as for BCG ion-pairs with CLOP and CLOP·H2SO4. The DFT calculations referred to the stability of the BCG–CLOP+ ion-pair and its spontaneous formation reaction from BCG and CLOP·H2SO4 compared to the BCG–CLOP-ion-pair. Furthermore, the UV-visible spectra and their corresponding excited states and electronic transitions for BCG, BCG–CLOP+ ion-pair, and BCG–CLOP ion-pair have been investigated. These spectra provided a molecular level understanding of the nature of the different intra-molecular and intermolecular electronic transitions in the BCG ion-pairs with CLOP+. Moreover, the quantitative analysis based on extracting a yellow-formed ion-pair into chloroform from aqueous medium was carried out. The ion-pair exhibits an absorption maximum at 413 nm. The optimum conditions of the reactions were studied experimentally and optimized. The calibration graph shows that CLOP·H2SO4 can be determined up to 100.0 μg mL−1 with detection limit (LOD) of 0.57 μg mL−1 and quantification limit (LOQ) of 1.86 μg mL−1. The low relative standard deviation values, 0.16–1.16, indicate good precision. The results were compared to other published data and were treated statistically using F and t-tests.
1 Introduction
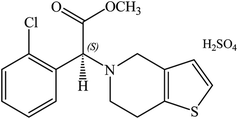
Clopidogrel bisulfate (CLOP·H2SO4), (2S)-2-(2-chlorophenyl)-2-(6,7-dihydro-4H-thieno[3,2-c]pyridine-5-yl)acetate, has a molecular weight of 419.9 g mol−1, Scheme 1.1 In medicinal chemistry, it is marketed globally with the primary goal of being able to reduce atherosclerotic events in patients with several co-morbid conditions due to stroke, myocardial infarction and cardiovascular disease.2 The recommended therapeutic dose of CLOP·H2SO4 is 75 mg per day and the initial pharmacodynamics activity can occur within 2 h after a single dose. CLOP·H2SO4 in combination with aspirin significantly reduced collagen-induced platelet aggregation.3A review about the bioanalytical methods, pharmacokinetics and pharmacodynamics has been published regarding the update on the recent trends in drug interaction studies.4 The literature survey revealed that several analytical techniques have been reported for clopidogrel, where there is no previous study about its action with sulfonephthalein dyes. It was observed that there was a UV spectrophotometric method for its analysis in presence of its alkaline degredates5 and in its pharmaceutical formulation.6 Three visible spectrophotometric methods7 have been reported for its quantification in pure and pharmaceutical dosage forms based on the formation of ion-pair complexes of the drug with acidic dye Solochrome black T, oxidation of the drug with phenanthroline and oxidation with potassium permanganate, Table 1.
| Reagent | Linear range μg mL−1 | LOD μg mL−1 | Slope, a L g−1 cm−1 | r2 | ε L mol−1 cm−1 | RSD% | λmax nm | Ref. |
|---|---|---|---|---|---|---|---|---|
| a r2: correlation coefficient, ε: molar absorptivity, RSD%: relative standard deviation, C.S: current study, BCG: Bromocresol green, SBT: Solochrome black T, PTL: phenanthroline. | ||||||||
| BCG | Up to 100.0 | 0.57 | 1.00 × 10⁻² | 0.9946 | 5.67 × 10³ | 0.31–0.96 | 415 | C.S |
| Direct UV | 40.0–70.0 | 0.40 | 1.00 | 1.0000 | 3.20 × 10² | — | 222 | 6 |
| SBT | 15.0–25.0 | — | 1.87 × 10⁻¹ | 0.9969 | 5.0781 × 10⁴ | 0.69 | 510 | 7 |
| (Fe(III)/PTL) | 10.0–50.0 | — | 7 × 10⁻³ | 0.9980 | 3.873 × 10³ | 0.66 | 515 | 7 |
| KMnO4 | 2.5–12.5 | — | 2.00 × 10⁻³ | 0.9980 | 21.27 × 10³ | 1.56 | 410 | 7 |
Sulfonephthalein dyes are commonly used as indicators in acid–base titrations. They have been also used to build pH-sensors8 and for the spectrophotometric determination of different drugs.9,10 Correlation between the pKa of these dyes with the nature of the substituent group was studied using the stability quotients from absorbance data.11 The electron-donor group increases their pKa values and the electron-attracting group decreases these values. Spectrophotometry has an inherent simplicity, a low cost and a wide availability in most quality control laboratories, so it considered as the most convenient analytical techniques.
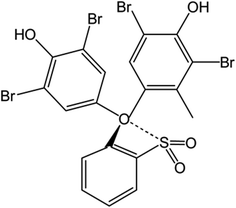
Based on the wide use of sulfonephthalein dyes, the main goal of the present study is to perform density functional theory (DFT) based molecular modelling to investigate the binding nature of clopidogrel in basic (CLOP) and protonated (CLOP+) forms with bromocresol green (BCG) at a molecular level. In addition, the use of BCG, Scheme 2, in the determination of the antiplatelet drug CLOP·H2SO4 as a way to get its concentration with a new simple, accurate and sensitive technique in its raw material and pharmaceutical formulations in comparison with the previously published literary.
2. Materials and methods
2.1. Apparatus
All the spectral measurements were carried out using a Jenway 6105 UV/Vis single beam spectrophotometer equipped with quartz cells of 1 cm optical path length. A Scientech SA 210 digital balance was used for weighing throughout the study.2.2. Reagents and solutions
All chemicals and reagents used in this investigation were of the highest purity available, and bi-distilled water was used throughout the current study. Chloroform and absolute ethanol were obtained from Sigma-Aldrich (Germany). BCG was purchased from BDH Limited, Poole (England). CLOP·H2SO4 standard powder was obtained from Pfizer, Egypt, Plavix® (75.0 mg per tablet) was manufactured by Sanofi Aventis, France, and Borgavix® (75.0 mg per tablet) was obtained from Borg Pharmaceutical Industries. Standard stock solutions of 1.0 mmol L−1 BCG was prepared by dissolving the exact weight in 10 mL of ethyl alcohol then completed to 50 mL with bi-distilled water. CLOP·H2SO4 stock solution was prepared by dissolving 10.49 mg of the pure powder in 5.0 mL of ethyl alcohol and completed with bi-distilled water up to 25 mL to obtain a solution of 1.0 mmol L−1.2.3. Visible spectrophotometric method
The absorption spectra of 1.0 mmol L−1 BCG was measured in the range of 300–500 nm using 1.0 cm path length spectrophotometric cell. This has been done after extraction of BCG in 5.0 mL chloroform by shaking for 1.0 min into a 60.0 mL separating funnel. The same action was done for the formed ion-pair upon mixing 1.0 mL 1.0 mmol L−1 of CLOP·H2SO4 with 1.0 mL of 1.0 mmol L−1 of BCG. The absorption spectrum of the extract was measured also in the same range against a reagent blank. All measurements were carried out at room temperature (25 ± 2 °C).The stoichiometric ratios were determined utilizing Job's method of continuous variation.12 Diverse volumes of 1.0 mmol L−1 CLOP·H2SO4 were treated with the corresponding complementary volume of 1.0 mmol L−1 BCG to give a total volume of 3.0 mL of both reagent and drug. Then the experiment was continued as mentioned above.
A more detailed examination for the ion-pair (1![[thin space (1/6-em)]](https://www.rsc.org/images/entities/char_2009.gif) :
:![[thin space (1/6-em)]](https://www.rsc.org/images/entities/char_2009.gif) 1) and (1
1) and (1![[thin space (1/6-em)]](https://www.rsc.org/images/entities/char_2009.gif) :
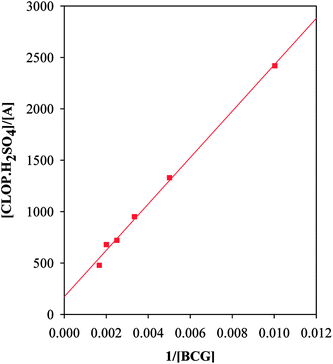
:![[thin space (1/6-em)]](https://www.rsc.org/images/entities/char_2009.gif) 2), drug to reagent, was continued by using Benesi–Hildebrand method.13 It was conducted by using variable concentrations of 0.2–1.2 of 0.5 mmol L−1 BCG, to which 1.0 mL 5.0 mmol L−1 CLOP·H2SO4 was added. Then the experiment was continued as mentioned above.
2), drug to reagent, was continued by using Benesi–Hildebrand method.13 It was conducted by using variable concentrations of 0.2–1.2 of 0.5 mmol L−1 BCG, to which 1.0 mL 5.0 mmol L−1 CLOP·H2SO4 was added. Then the experiment was continued as mentioned above.
2.4. Procedure for tablets
10 Tablets (Plavix®, 75.0 mg per tablet or Borgavix®, 75.0 mg per tablet) were accurately weighed and ground using an agate mortar. The average weight equivalent to one tablet was calculated. An accurately weighed amount of the ground tablets powder equivalent to 75.0 mg CLOP·H2SO4 were dissolved in the least amount of ethyl alcohol. The resulting solution was filtered and the remained excipients were washed several times by using bi-distilled water to make sure that the entire active ingredient in the powder was completely dissolved, the volume was completed to 50 mL. Diverse volumes of the later solution were taken and treated by the same procedure for the pure one.2.5. Quantum chemical calculations
The interaction between BCG and clopidogrel was simulated through 1![[thin space (1/6-em)]](https://www.rsc.org/images/entities/char_2009.gif) :
:![[thin space (1/6-em)]](https://www.rsc.org/images/entities/char_2009.gif) 1 ion-pair formation between them, i.e. 1 BCG + 1 clopidogrel → 1 BCG–clopidogrel ion-pair. Here, to study effect of the presence of bisulphate and its protonation to the clopidogrel N atom, clopidogrel was modelled in two different ways. Clopidogrel was introduced one time as a basic molecule (CLOP) and in another time as a protonated molecule (CLOP+, Fig. 1). This means that we have modelled two reactions, 1 BCG + 1 CLOP →1 BCG–CLOP ion-pair and 1 BCG + 1 CLOP+ → 1 BCG–CLOP+ ion-pair. The initial geometries for each ion-pair were constructed by selecting the expected preferential binding situations between BCG and CLOP as well as between BCG and CLOP+. Full geometry optimization was performed for the initial ion-pair geometries as well as for the individual species (BCG, CLOP, and CLOP+) using the gradient minimization technique. Harmonic vibrational frequencies were calculated for all optimized geometries. These geometries are characterized by having zero gradient norms and positive harmonic vibrational frequencies. All calculations have been performed using the Gaussian09 program package.14 The calculations were performed using density functional theory (DFT) with the Becke, three-parameter, Lee–Yang–Parr hybrid functional (B3LYP).15,16 Here, the 6-31+G(d,p) basis set17 was used for H, C, N, O, and S atoms while the Lanl2dz basis set18,19 was used for Cl and Br atoms. In addition, the Grimme's D3 dispersion correction20 has been applied.
1 ion-pair formation between them, i.e. 1 BCG + 1 clopidogrel → 1 BCG–clopidogrel ion-pair. Here, to study effect of the presence of bisulphate and its protonation to the clopidogrel N atom, clopidogrel was modelled in two different ways. Clopidogrel was introduced one time as a basic molecule (CLOP) and in another time as a protonated molecule (CLOP+, Fig. 1). This means that we have modelled two reactions, 1 BCG + 1 CLOP →1 BCG–CLOP ion-pair and 1 BCG + 1 CLOP+ → 1 BCG–CLOP+ ion-pair. The initial geometries for each ion-pair were constructed by selecting the expected preferential binding situations between BCG and CLOP as well as between BCG and CLOP+. Full geometry optimization was performed for the initial ion-pair geometries as well as for the individual species (BCG, CLOP, and CLOP+) using the gradient minimization technique. Harmonic vibrational frequencies were calculated for all optimized geometries. These geometries are characterized by having zero gradient norms and positive harmonic vibrational frequencies. All calculations have been performed using the Gaussian09 program package.14 The calculations were performed using density functional theory (DFT) with the Becke, three-parameter, Lee–Yang–Parr hybrid functional (B3LYP).15,16 Here, the 6-31+G(d,p) basis set17 was used for H, C, N, O, and S atoms while the Lanl2dz basis set18,19 was used for Cl and Br atoms. In addition, the Grimme's D3 dispersion correction20 has been applied.
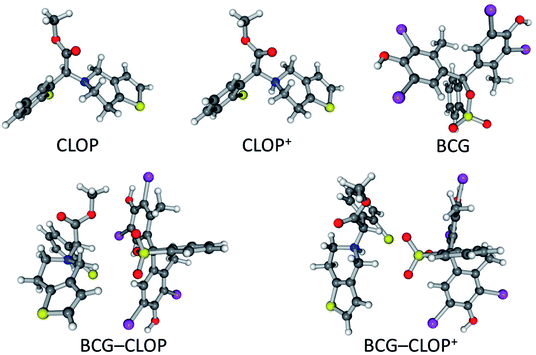 | ||
| Fig. 1 Optimized geometries of CLOP, CLOP+, BCG, BCG–CLOP ion-pair, and BCG–CLOP+ ion-pair at the B3LYP/6-31+G(d,p) + Lanl2dz level of theory. | ||
For the ion-pair formation reaction, 1 BCG + 1 CLOP(CLOP+) → 1 BCG–CLOP(CLOP+) ion-pair, the binding energy (EB) between BCG and CLOP or between BCG and CLOP+ is calculated as follows:
| EB = EBCG−CLOP(CLOP+)ion-pair − (EBCG + ECLOP(CLOP+)) | (1) |
3. Results and discussion
3.1. Quantum chemical calculations
The optimized geometries for CLOP, CLOP+, BCG, BCG–CLOP ion-pair, and BCG–CLOP+ ion-pair are gathered in Fig. 1. Based on the spatial configuration for the optimized structures, the root mean square deviation (RMSD) of the xyz coordinates between the BCG–CLOP– and BCG–CLOP+ ion-pairs is larger than that between CLOP and CLOP+. This means that the basic and protonated clopidogrel molecular configurations are closer to each other compared to the molecular configurations of the basic and protonated clopidogrel ion-pairs with BCG. Here, the main kind of the molecular interaction in both BCG–CLOP and BCG–CLOP+ ion-pairs is resulting from the dispersion interaction. Both ion-pairs have not shown any covalent bond or H-bond. Further, the BCG–CLOP+ ion-pair has exhibited electrostatic interaction between the positively charged CLOP+ N atom and the BCG electron density. This yields a stronger interaction between BCG and CLOP+ than between BCG and CLOP. In addition, the calculated binding energy for the BCG–CLOP+ ion-pair, −19.5 kcal mol−1, is almost twice of that for the BCG–CLOP ion-pair (−9.9 kcal mol−1, Table 2). This indicates to the substantial role of presence the sulfuric acid in the ion-pair formation process between BCG and CLOP·H2SO4. Here, the sulfuric acid strengthens the interaction between BCG and CLOP+ in the BCG–CLOP+ ion-pair two times compared to the case of absence of the sulfuric acid. Moreover, the calculated binding free energies between BCG and clopidogrel for the BCG–CLOP and BCG–CLOP+ ion-pairs are +1.9 and −8.9 kcal mol−1, respectively. These values indicate again that the BCG–CLOP+ ion-pair is stronger and more stable than the BCG–CLOP ion-pair. Furthermore, one can explore from the binding free energy values that the BCG–CLOP+ ion-pair is thermally stable and can be formed spontaneously. In contrast, the BCG–CLOP ion-pair is not thermally stable ion-pair and needs activation to be formed. This eventually indicates that the formation of the ion-pair between BCG and CLOP+ will be carried out in two steps. First, the protonated clopidogrel (CLOP+) will be formed by proton transfer process from the sulfuric acid to clopidogrel. Consequently, a spontaneous interaction process will take place between BCG and the protonated clopidogrel (CLOP+).| EB | EZPE+thermalB | ΔHB | ΔGB | |
|---|---|---|---|---|
| (kcal mol−1) | ||||
| BCG–CLOP | −9.90 | −8.69 | −9.28 | +1.88 |
| BCG–CLOP+ | −19.49 | −17.74 | −18.33 | −8.90 |
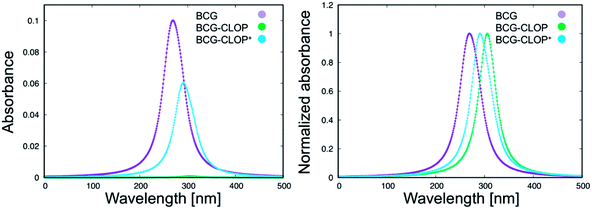
Next, the UV-visible spectra for BCG and its ion-pairs with CLOP and CLOP+ were calculated theoretically (Fig. 2) for further understanding for the nature of the intra-molecular and inter-molecular interaction in BCG, BCG–CLOP ion-pair, and BCG–CLOP+ ion-pair. Regardless the shift in λmax between the experimental and theoretical UV-visible spectra, Fig. 2 provides two evidence points for the stronger interaction between BCG and CLOP+ compared to that between BCG and CLOP. First, the intensity or absorbance at λmax for the BCG–CLOP+ ion-pair is almost 63 times of that for the BCG–CLOP ion-pair. Second, the shift in λmax between the BCG and BCG–CLOP spectra is larger than that between the BCG and BCG–CLOP+ spectra. For more details, the possible excited states and the corresponding electronic transitions for BCG and its ion-pairs with CLOP and CLOP+ will be discussed briefly below.
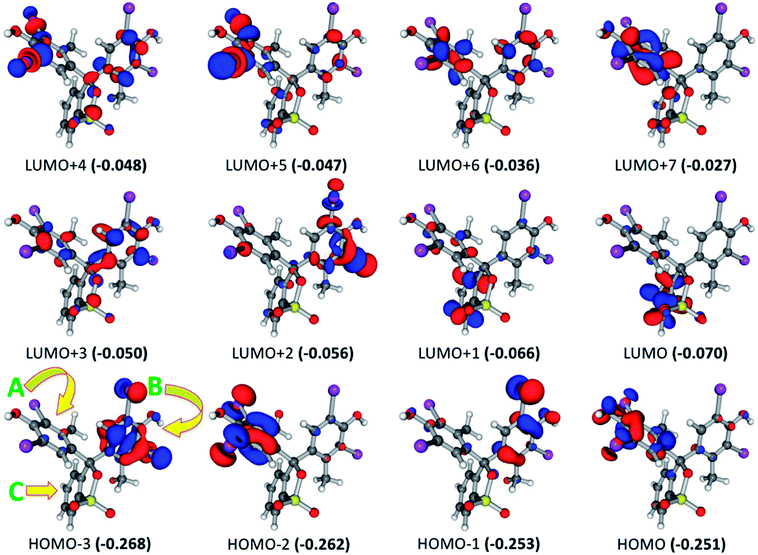
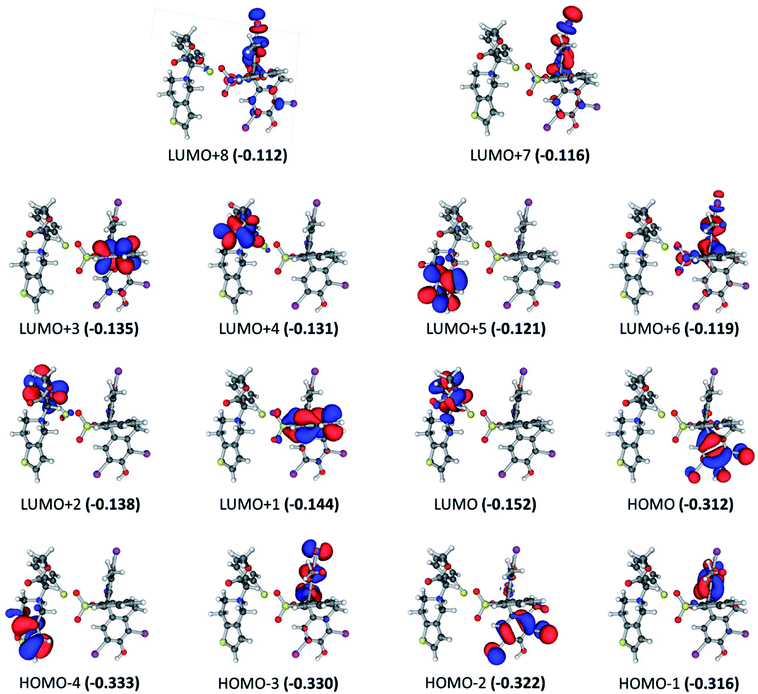
For BCG, the calculated UV-visible spectrum showed excited states at wavelength range from 256.0 to 287.2 nm. The intensity of these states has been increased in the order 277.6 < 256.0 <269.1 < 269.8 < 257.9 < 287.2 < 261.4 < 262.3 < 285.1 < 270.7 < 280.0 < 265.5 nm. The most intense excited state at 265.5 nm consists of several electronic transitions involving HOMO−3 → LUMO+2 (16.3%), HOMO−1 → LUMO+1 (14.4%), HOMO−3 → LUMO+1 (14.2%), HOMO−1 → LUMO+2 (13.7%), HOMO−2 → LUMO+2 (6.8%), HOMO−3 → LUMO (6.5%), and HOMO−1 → LUMO+5 (6.2%). Focusing on the frontier molecular orbitals in Fig. 3, this explains that the most intense excited state involved the π → π* and π → σ* electronic transitions. These electronic transitions take place from the BCG benzene rings “A” and “B” to benzene ring “C” as well as to the Br atoms involved in the benzene rings “A” and “B”. The excited state at 280.0 nm occurred due to combination of HOMO → LUMO+1 (48.5%), HOMO → LUMO+5 (12.1%), HOMO → LUMO+2 (8.4%), and HOMO → LUMO+4 (7.6%) electronic transitions. Like the previous excited state, this state involved π → π* and π → σ* electronic transitions as well. Here, these electronic transitions happen from the benzene ring “A” to the benzene rings “B”and “C” and also to the C–Br bonds in the benzene rings “A” and “B”. At 270.7 nm, combination of the electronic transitions HOMO → LUMO+4 (15.8%), HOMO → LUMO+1 (15.2%), HOMO−2 → LUMO (14.1%), HOMO → LUMO+3 (13.1%), HOMO → LUMO+2 (6.0%), and HOMO → LUMO (5.0%) has been observed. This means that this excitation state involved π → π* and π → σ* electronic transitions from the benzene ring “A” to the benzene rings “A”, “B”and “C” and to the C–Br bonds. Furthermore, the electronic transitions HOMO → LUMO (69.3%), HOMO−1 → LUMO (8.5%), and HOMO−1 → LUMO+1 (5.3%) have been observed at 285.1 nm that are related to π → π* transitions from the benzene rings “A” and “B” to the benzene ring “C”. While π → π* electronic transitions have been observed at 262.3 nm from the benzene ring “A” to the benzene ring “C” through the HOMO−2 → LUMO (47.6%) and HOMO−2 → LUMO+1 (39.9%) transitions. For the rest of the excited states, only the most contributed electronic transition for every excited state will be mentioned briefly. Here, the electronic transitions HOMO → LUMO+2 (256.0 nm), HOMO−1 → LUMO+3 (261.4 nm), HOMO−1 → LUMO+1 (269.8 and 287.2 nm), HOMO−1 → LUMO (277.6 nm), HOMO−2 → LUMO+5 (257.9 nm), and HOMO−2 → LUMO (269.1 nm) have been observed at the corresponding wavelength (given in parentheses). These are related to electronic transitions from π of the benzene rings “A” and “B” to π* of the benzene rings “A”, “B”, and “C” and σ* of C–Br bonds. The last exited sates can summarize all the possible electronic transitions that take place in BCG.
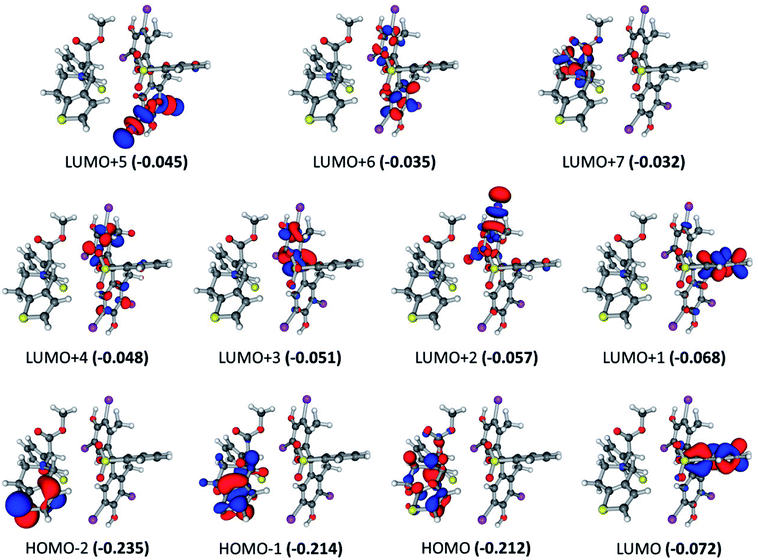
For the BCG–CLOP+ ion-pair, the intensity of the most intense excited states has the order 291.7 > 288.0 > 309.7 > 284.8 > 305.8 > 285.5 nm. For the excited state at 291.7 nm, the main electronic transitions are HOMO → LUMO+3 (72.8%) and HOMO−2 → LUMO+1 (18.6%) transitions. At 288.0 nm, the HOMO−2 → LUMO (44.2%), HOMO−2 → LUMO+1 (33.6%) electronic excitations have been observed while at 309.7 nm the HOMO → LUMO+1 (68%) and HOMO → LUMO (30%) transitions were the most abundant electronic transitions. For the excited state at 284.8 nm, the HOMO−1 → LUMO+3 electronic transition was the main transition. Eventually, the electronic transitions HOMO → LUMO, HOMO → LUMO+1, HOMO−1 → LUMO, HOMO−1 → LUMO+3, HOMO−2 → LUMO, and HOMO−2 → LUMO+1 have been observed at 305.8 and 285.5 nm. All these intense transitions can be simply classified into intra-molecular as well as intermolecular π → π* electronic transitions (Fig. 4). Specifically, the intra-molecular transitions take place from the BCG benzene rings “A” and “B” to the BCG benzene ring “C”. On the other hand, the intermolecular electronic transitions take place from the BCG benzene rings “A” and “B” to the clopidogrel benzene ring. The latter transitions can strengthen the interaction between BCG and clopidogrel in the BCG–CLOP+ ion-pair. Moreover, low intense excited states are observed at 303.6, 297.4, 279.6, 279.3, and 277.7 nm due to the electronic transitions HOMO → LUMO, HOMO → LUMO+2, HOMO−1 → LUMO, HOMO−1 → LUMO+1, HOMO−1 → LUMO+2, HOMO−3 → LUMO, and HOMO−4 → LUMO (Fig. 4). These excited states involved mainly intermolecular π → π* electronic transitions from the BCG benzene rings “A” and “B” to the clopidogrel benzene ring in addition to one intramolecular π → π* electronic transition from the BCG benzene ring “A” to the BCG benzene ring “C”. Furthermore, the HOMO−4 → LUMO transition is related to intramolecular π → π* electronic transition in clopidogrel from the thiophene ring to benzene one.
For the BCG–CLOP ion-pair, very low intense excited states are observed at 360.8, 355.1, 347.4, 341.3, 322.5, and 304.0 nm. These excited states involved the electronic transitions from HOMO to LUMO, LUMO+1, LUMO+2, and LUMO+3; from HOMO−1 to LUMO, LUMO+1, and LUMO+2; and from HOMO−2 to LUMO (Fig. 5). Excited states of intermediate intensity have been observed at 298.7, 313.3, 313.8, and 304.5 nm. Mainly these excited states have been arisen due to transitions from HOMO to LUMO+2, LUMO+3, LUMO+4, and LUMO+5; and from HOMO−1 to LUMO+2, LUMO+3, and LUMO+4. The most intense excited states, at 303.6 and 306.22 nm, have been explored via the electronic transitions HOMO → LUMO+4, HOMO → LUMO+7; HOMO−1 → LUMO+4, and HOMO−1 → LUMO+7. This means that the most abundant excited states included intramolecular and intermolecular π → π* electronic transition from the BCG benzene rings “A” and “B” to the BCG benzene ring “A” and the clopidogrel benzene ring. In addition, a π → σ* intra-molecular electronic transition has been observed to the C–Br bonds. Eventually, the UV-visible electronic transitions show that this BCG–CLOP ion-pair is weaker than the BCG–CLOP+ ion-pair although it shows intermolecular electronic transitions from BCG to clopidogrel. This is due to the intensity of the electronic transitions in the BCG–CLOP ion-pair is very small compared to that in the BCG–CLOP+ion-pair. This conclusion comes in a good agreement with the calculated binding (free) energies for both ion-pairs.
Finally, the effect of chloroform as a solvent on the calculated UV-visible spectra for BCG and its ion-pairs with CLOP and CLOP+ (see Fig. 2) has been introduced into Fig. 6. Here, the differences and similarities between the UV-visible spectra in vacuum and in chloroform will be discussed briefly. All the calculated UV-visible spectra in chloroform shifted to shorter wavelength compared to the spectra in the vacuum case. This is due to lower band gaps in vacuum (band gap: 0.181 a.u. for BCG, 0.160 for BCG–CLOP+ ion-pair, 0.140 for BCG–CLOP ion-pair) than in chloroform (band gap: 0.186 for BCG, 0.181 for BCG–CLOP+ ion-pair, 0.159 for BCG–CLOP ion-pair). Moreover, the shift in λmax between BCG and BCG–CLOP+ ion-pair is smaller in chloroform than in vacuum. In addition, higher intensities have been observed for all spectra in chloroform compared to the vacuum cases. Regardless these differences, the order of intensities of λmax and the order of the shift in λmax between the spectra calculated in chloroform are the same as in the vacuum cases. Mainly, the shift in λmax between BCG–CLOP and BCG–CLOP+ ion-pairs is similar for the chloroform and vacuum cases. Moreover, the possible excited states and the corresponding electronic transitions are almost similar for both vacuum and chloroform cases (for more details see Fig. S1–S3 and Tables S1–S3 in the ESI†).
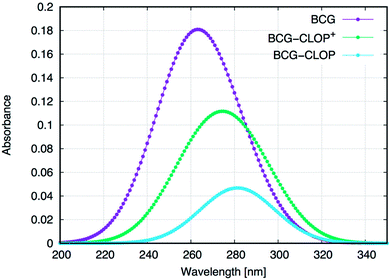 | ||
| Fig. 6 Calculated UV-visible spectra for BCG and its ion-pairs with CLOP and CLOP+ at the B3LYP/6-31+G(d,p) + Lanl2dz level of theory and using CPCM. | ||
3.2. Experimental part
Having a molecular level investigation for the interaction between the clopidogrel drug in its basic (CLOP) and acidic (CLOP+) form with BCG in vacuum as well as in chloroform, this motivates us to introduce a valid and precise detection method to quantify clopidogrel. Here, several extractive spectrophotometric methods have been published for the basic nitrogenous compounds, in which the acidic dyes form ion-pairs that can be extracted from aqueous solution to organic phase.23 Hence BCG as a selective reagent can be used for the determination of CLOP·H2SO4. After selection of maximum wavelength 413 nm, Fig. 7, some variables in the reaction conditions were studied and the influence of these variables on the reaction was tested as reagent concentration, effect of time, etc.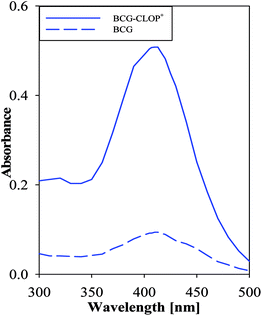 | ||
| Fig. 7 Absorption spectrum of 1.0 mmol L−1 CLOP·H2SO4 with 1.0 mmol L−1 BCG against a blank and 1.0 mmol L−1 BCG against chloroform as a blank. | ||
The effect of time on the formation of the reaction product at (25 ± 2 °C) was investigated by allowing the reaction to proceed at different times. The results revealed that the reaction was completed within 2 min. The absorbance remains stable for 24 h. This allowed the processing of large number of samples. Moreover, this increases the reliability of the methods as well as made it applicable for large number of samples.
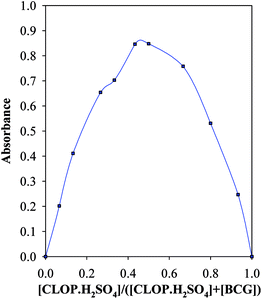
Under the optimum conditions, the stoichiometry of the reaction between CLOP·H2SO4 and BCG was investigated by Job's method.9 The bell shape of Job's plot indicated that ion-pair formation between CLOP·H2SO4 and BCG followed 1![[thin space (1/6-em)]](https://www.rsc.org/images/entities/char_2009.gif) :
:![[thin space (1/6-em)]](https://www.rsc.org/images/entities/char_2009.gif) 1 and 1
1 and 1![[thin space (1/6-em)]](https://www.rsc.org/images/entities/char_2009.gif) :
:![[thin space (1/6-em)]](https://www.rsc.org/images/entities/char_2009.gif) 2 reaction stoichiometries, Fig. 8.
2 reaction stoichiometries, Fig. 8.
 | (2) |
The association constant of 1![[thin space (1/6-em)]](https://www.rsc.org/images/entities/char_2009.gif) :
:![[thin space (1/6-em)]](https://www.rsc.org/images/entities/char_2009.gif) 1 and 1
1 and 1![[thin space (1/6-em)]](https://www.rsc.org/images/entities/char_2009.gif) :
:![[thin space (1/6-em)]](https://www.rsc.org/images/entities/char_2009.gif) 2 ion-pairs was determined using Benesi–Hildebrand method applying the following equation.10
2 ion-pairs was determined using Benesi–Hildebrand method applying the following equation.10
 | (3) |
| Parameter | Value |
|---|---|
| a KADC is the association constant calculated applying Benesi–Hildebrand method. Kf is the formation constants calculated from the continuous variation data. | |
| λmax (nm) | 413 |
| Beer's law (μg mL−1) | Up to 100.0 |
| Molar absorptivity (L mol−1 cm−1) | 5.67 × 10³ |
| Sandell sensitivity (μg cm−2) | 8.06 × 10⁻² |
| Ringbom range (μg mL−1) | 17.37–81.28 |
| Limit of detection (LOD) (μg mL−1) | 0.57 |
| Limit of quantification (LOQ) (μg mL−1) | 1.86 |
| Slope (b)* (mL μg−1 cm−1) | 0.01 |
| Intercept (a)* | 0.06 |
| Correlation coefficient (r2) | 0.9946 |
| Relative standard deviation (RSD) % (n = 3) | 0.31–0.96 |
| KADC (L mol−1) | 5.34 × 10³ |
| εADλ (L mol−1 cm−1) | 2.43 × 10³ |
| Kf (n = 1) | 1.65 × 10⁵ |
| Kf (n = 2) | 7.56 × 10¹⁸ |
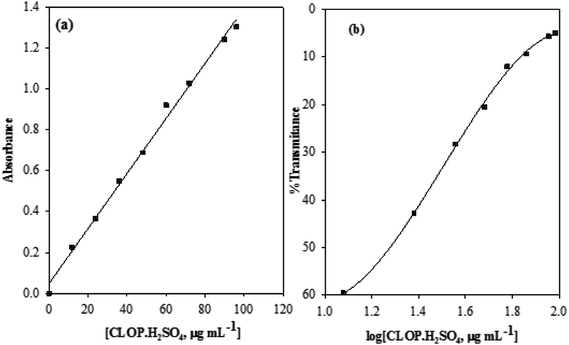
Conformity with calibration curve25 and Ringbom are evident in the concentration ranges up to 100.0 and 17.37–81.28 μg mL−1, respectively. The high molar absorptivity (5.67 × 10³ L mol−1 cm−1) and the low Sandell sensitivity values (8.06 × 10⁻² μg cm−2) reflect the good and high sensitivity of this method. The linearity of the calibration curve was approved by the high correlation coefficient (r2), 0.9946, and the small value of y-intercept (0.06) of the regression equation, Table 3.
| LOD = 3s/k, LOQ = 10s/k | (4) |
The robustness of the method was evaluated by making small changes in some parameters as, the volume of dye, volume of extracting solvent and wavelength range. The effects of these changes were studied on the absorbance of the ion-pair. The changes had negligible influence on the results as revealed by small intermediate precision values expressed as % RSD (0.29–1.41%). Method ruggedness was demonstrated by carrying the analysis by two analysts, and also by a single analyst performing analysis using three different cuvettes. Intermediate precision values in both instances were in the range 0.58–1.63 indicating acceptable ruggedness.
| Taken (μg mL−1) | aRecovery% ± SD | RSD% | t-Test | F-test |
|---|---|---|---|---|
| a Average of four replicates. | ||||
| Plavix® tablets (75.0 mg CLOP·H2SO4/tablet) | ||||
| 23.99 | 98.00 ± 0.47 | 0.48 | 4.90 | 2.53 |
| 35.99 | 100.47 ± 0.51 | 0.51 | 0.47 | 2.36 |
| 59.99 | 99.89 ± 0.56 | 0.56 | 0.39 | 2.13 |
![[thin space (1/6-em)]](https://www.rsc.org/images/entities/char_2009.gif) |
||||
| Borgavix® tablets (75.0 mg CLOP·H2SO4/tablet) | ||||
| 23.99 | 98.57 ± 0.76 | 0.77 | 2.65 | 1.55 |
| 35.99 | 100.13 ± 0.57 | 0.57 | 0.49 | 1.16 |
| 59.99 | 100.42 ± 0.69 | 0.69 | 0.08 | 1.42 |
4. Conclusions
Spectrophotometric method has advantageous over many of the reported methods due to their sensitivity, high percentage of recovery, wide application range, low relative standard deviation, and they do not need expensive sophisticated apparatus. Furthermore, all the analytical reagents are inexpensive, have excellent shelf life, and are available in many analytical laboratories. Therefore, the methods are practical and valuable for routine application in quality control laboratories for analysis of clopidogrel bisulfate. Moreover, investigation of the binding nature between it and BCG has been explored at molecular level. It was found that, BCG binds to the protonated form of clopidogrel (CLOP+) stronger and more spontaneously than to the corresponding neutral form (CLOP). Further, the UV-visible spectra for BCG, BCG–CLOP+ ion-pair, and BCG–CLOP ion-pair have been calculated. These spectra showed different intramolecular and intermolecular π → π* and π → σ* electronic transitions in the BCG ion-pairs with clopidogrel bisulfate.Conflicts of interest
There are no conflicts to declare.References
- A. C. Moffat, M. D. Osselton and B. Widdop, Clarke's Analysis of Drugs and Poisons, Pharmaceutical Press, London, UK, 4th edn, 2011 Search PubMed.
- D. Taubert, A. Kastrati, S. Harlfinger, O. Gorchakoca, A. Lazar, N. Von Beckerath, A. Schomig and E. Schomig, Thromb. Haemostasis, 2004, 92, 311–316 Search PubMed.
- G. L. Plosker and K. A. Lyseng-Williamson, Drugs, 2007, 67(4), 613–646 CrossRef PubMed.
- R. Mullangi and N. R. Srinivas, Biomed. Chromatogr., 2009, 23, 26–41 CrossRef PubMed.
- H. E. Zaazaa, S. S. Abbas, M. Abdelkawy and M. M. Abdelrahman, Talanta, 2009, 78, 874–884 CrossRef PubMed.
- P. B. Cholke, R. Ahmed, S. Z. Chemate and K. R. Jadhav, Arch. Appl. Sci. Res., 2012, 4(1), 59–64 Search PubMed.
- B. Anupama, V. Jagathi, A. Aparna, M. Madhubabu and V. L. Annapurna, Int. J. Pharma Bio Sci., 2011, 2, 105–108 Search PubMed.
- K. Vytras and J. Vytrasova, Chem. Zvesti, 1974, 28(6), 779–788 Search PubMed.
- K. Basavaiah, S. A. M. Abdulrahman and K. B. Vinay, J. Food Drug Anal., 2009, 17(6), 434–442 Search PubMed.
- N. Rahman, N. A. Khan and S. N. H. Azmi, Il Farmaco, 2004, 59(1), 47–54 CrossRef PubMed.
- R. Casula, G. Crisponi, F. Cristiani and V. Nurchi, Talanta, 1993, 40(12), 1781–1788 CrossRef PubMed.
- P. Job, Ann. Chem., 1936, 16, 97 Search PubMed.
- H. A. Benesi and J. H. Hildebrand, J. Am. Chem. Soc., 1949, 71(8), 2703–2707 CrossRef.
- M. J. Frisch, G. W. Trucks, H. B. Schlegel, G. E. Scuseria, M. A. Robb, J. R. Cheeseman, G. Scalmani; V. Barone; B. Mennucci; G. A. Petersson; H. Nakatsuji; M. Caricato; X. Li; H. P. Hratchian, A. F. Izmaylov, J. Bloino, G. Zheng, J. L. Sonnenberg, M. Hada, M. Ehara, K. Toyota, R. Fukuda, J. Hasegawa, M. Ishida, T. Nakajima, Y. Honda, O. Kitao, H. Nakai, T. Vreven, J. A. Montgomery Jr; J. E. Peralta; F. Ogliaro; M. Bearpark; J. J. Heyd; E. Brothers; K. N. Kudin; V. N. Staroverov, R. Kobayashi, J. Normand, K. Raghavachari, A. Rendell, J. C. Burant, S. S. Iyengar, J. Tomasi, M. Cossi, N. Rega, J. M. Millam, M. Klene, J. E. Knox, J. B. Cross, V. Bakken, C. Adamo, J. Jaramillo, R. Gomperts, R. E. Stratmann, O. Yazyev, A. J. Austin, R. Cammi, C. Pomelli, J. W. Ochterski, R. L. Martin, K. Morokuma, V. G. Zakrzewski, G. A. Voth, P. Salvador, J. J. Dannenberg, S. Dapprich, A. D. Daniels, O. Farkas, J. B. Foresman, J. V. Ortiz, J. Cioslowski and D. J. Fox, Gaussian 09, Revision D.01, Gaussian, Inc., Wallingford CT, 2013 Search PubMed.
- A. D. Becke, Phys. Rev. A: At., Mol., Opt. Phys., 1988, 38, 3098–3100 CrossRef.
- C. Lee, W. Yang and R. G. Parr, Phys. Rev. B: Condens. Matter Mater. Phys., 1988, 37, 785–789 CrossRef.
- W. J. Hehre, R. Ditchfield and J. A. Pople, J. Chem. Phys., 1972, 56, 2257–2261 CrossRef.
- T. H. Dunning Jr and P. J. Hay, in Modern Theoretical Chemistry, ed. H. F.Schaefer III, Plenum, New York, 1977, vol. 3, pp. 1–28 Search PubMed.
- P. J. Hay and W. R. Wadt, J. Chem. Phys., 1985, 82, 270–283 CrossRef.
- S. Grimme, S. Ehrlich and L. Goerigk, J. Comput. Chem., 2011, 32, 1456–1465 CrossRef PubMed.
- H. B. Jansen and P. Ros, Chem. Phys. Lett., 1969, 3, 140–143 CrossRef.
- M. Cossi, N. Rega, G. Scalmani and V. Barone, J. Comput. Chem., 2003, 24, 669–681 CrossRef PubMed.
- I. Suslu and A. Tamer, J. Pharm. Biomed. Anal., 2002, 29, 545–554 CrossRef PubMed.
- J. Inczédy, Analytical Application of Ion-pair Equilibria, Budapest, John Wiley & Sons Inc, 1976 Search PubMed.
- J. C. Miller and J. N. Miller, Statistics for Analytical Chemistry, Horwood, Chichester: UK, 3rd edn, 1993 Search PubMed.
- S. Gurav, R. Tembare, V. Salunkhe, Devprakash and G. P. Senthilkumar, Am. J. PharmTech Res., 2011, 1(4), 258–263 Search PubMed.
Footnote |
| † Electronic supplementary information (ESI) available. See DOI: 10.1039/c8ra05187a |
| This journal is © The Royal Society of Chemistry 2018 |

