 Open Access Article
Application of electrodialysis to extract 5′-ribonucleotides from hydrolysate: efficient decolorization and membrane fouling
Jingwei Zhouabc,
Han Kuangac,
Wei Zhuangacde,
Yong Chenacde,
Dong Liuacde,
Hanjie Ying *acde and
Jinglan Wu*acde
aCollege of Biotechnology and Pharmaceutical Engineering, Nanjing Tech University, Nanjing, China. E-mail: yinghanjie@njtech.edu.cn
bJiangsu Industrial Technology Research Institute, Nanjing, China
cNational Engineering Technique Research Center for Biotechnology, Nanjing, China
dJiangsu National Synergetic Innovation Center for Advanced Materials, Nanjing, China
eState Key Laboratory of Materials-Oriented Chemical Engineering, Nanjing, China
First published on 15th August 2018
Abstract
In order to simplify the process of extracting 5′-ribonucleotides from hydrolysate in industry in an environmentally friendly manner, electrodialysis was introduced as an alternative route. The feasibility of electrodialysis for the separation of 5′-ribonucleotides from hydrolysate was investigated using a series of membranes under different conditions. The results of the lab-scale experiments indicate that ChemJoy membranes are most suitable for the separation of 5′-ribonucleotides. At a current density of 13.2 A m−2 or constant voltage of 30 V in batch operation, the yield of 5′-ribonucleotides reaches 97.2% and 95.4%, respectively. Furthermore, the decolorization ratio of 91.6% indicates that most pigments are blocked by the membranes and the current efficiency reaches 70% for guanosine 5′-monophosphate (GMP) production. Remarkably, the 5′-ribonucleotides are 1.3-times more concentrated. Finally, membrane fouling was investigated via SEM and ATR-FTIR, and the TingRun, ChemJoy and Astom cationic membranes showed the same membrane fouling resistance. However, among the anionic membranes, ChemJoy showed the best fouling resistance. The total energy cost of the pilot-scale operation was estimated to be 155.44 $ per t 5′-ribonucleotides. This process integrates preliminary purification, decolorization and concentration, providing a simple, cost-effective and green way to produce 5′-ribonucleotides.
1. Introduction
5′-Ribonucleotides including uridine 5′-monophosphate(UMP), adenosine 5′-monophosphate(AMP), cytidine 5′-monophosphate(CMP), and guanosine 5′-monophosphate(GMP) are widely used in medicine,1 health care,2 agriculture,3 and many other industries. They can enhance immunity and decrease the risk of diarrhea and sepsis.4,5The enzymatic hydrolysis of RNA by 5′-phosphodiesterase is the most widely used method to industrially produce 5′-ribonucleotides.15 However, traditional downstream separation processes produce large quantities of by-products such as pigments, proteins, inorganic salts and impurities and involve complex procedures, leading to poor stability and low yield. Decolorization plays an important role in the entire separation process, and adsorption with activated carbon is known to be an effective method for decolorization. However, activated carbon has a strong adsorption capacity for 5′-ribonucleotides, which reduces its recovery. Moreover, activated carbon is difficult to regenerate, which makes its reuse challenging. Electrodialysis (ED) is a state-of-the-art IEM process for water desalination and deionization in the chemical process industry.6 With the advantages of high water recovery and high desalination ratio, ED is used for the desalination of seawater to produce fresh water.7,8 Furthermore, ED has been employed to purify target products with alternating cation-exchange and anion-exchange membranes in a direct current field, such as formic acid,9 lactic acid, gluconic acid and citric acid.10–14 Additionally, ED also has the potential to separate 5′-ribonucleotides from neutral impurities via the permselectivity of ion-exchange membranes, where macromolecular impurities such as proteins, most pigments and oligonucleotide will remain in the hydrolysate due to the small membrane pore size (<1 nm). However, the removal of pigments from 5′-ribonucleotide hydrolysate via ED and its concentration with an improvement in purity has not been reported.
Membrane fouling is a common phenomenon during electrodialysis. It results in an increase in membrane resistivity, which causes a decrease in ions flux through the membrane, thus increasing energy consumption.16–18 Ion-exchange membranes can be fouled by ionic components of medium molecular weight such as ionic surface active agents and proteins possessing charges opposite to the fixed charges of the membrane. Fouling can be classified as reversible or irreversible according to the interaction between the foulant and membrane surface.19,20 Generally, anion exchange membranes are more sensitive and susceptible to fouling during the ED process.21,22 Nevertheless, mechanical cleaning and treatment with dilute bases and acids can generally restore the original properties of the membranes. In contrast, the fouling of membranes by organic anions is more severe because they are small enough to penetrate into the membrane and stay inside the membrane phase due to their low mobility. Consequently, the resistance of the membrane and the entire stack increases rapidly.23 The performance and service life of ion-exchange membranes are key factors to realize industrialization. However, in the literature, the systematic investigation of hydrolysate and membrane fouling is scarce.
The objective of this study was to investigate the feasibility of decolorization and preliminary purification of 5′-ribonucleotides from hydrolysate via ED. First, the influence of membrane type, ion transport performance under different operating conditions and contrast in anti-pollution ability were systematically investigated. Subsequently, the constant current mode and constant voltage mode were established for process optimization, and the merits and demerits of both operations were considered. Subsequently, a continuous production system comprising three membrane stacks was investigated on a pilot scale. The current efficiency and decolorization were also analyzed in a short-cycle production. Finally, based on the experimental results, the economic feasibility of ED for the industrial production of 5′-ribonucleotides was evaluated. This study proposes an eco-efficient process to purify 5′-ribonucleotides from RNA hydrolysate.
2. Experiment section
2.1 Materials
The feed solutions used for electrodialysis were prepared using RNA hydrolysate and nuclease P1. The feed solutions were prepared as follows. (a) Initially, 55.0 g RNA was dissolved in 1 L water at 70 °C, and the solution pH was adjusted to 5.5 using NaOH (5 mol L−1). (b) This RNA solution was mixed with nuclease P1 solution (6%) that was preheated at 70 °C for 15 min. (c) The reaction was conducted at 70 °C for 3 hours.The anion exchange membranes used for electrodialysis were Astom (Neosepta®) AMX (Tokuyama Co., Japan), CJMA (Hefei ChemJOY Polymer Materials Co., Ltd., China), and JAM-II-07 (Beijing Tingrun Membrane Technology Development Co., Ltd., China). The cation exchange membranes used were Astom (Neosepta®) CMX (Tokuyama Co., Japan), CJMC (Hefei ChemJOY Polymer Materials Co., Ltd., China), and JCM-II-07(Beijing Tingrun Membrane Technology Development Co., Ltd., China). The main properties of the membranes are illustrated in Table 1. The reagents used in the electrodialysis were analytically pure.
| Membrane type | Thickness (μm) | IEC (meq g−1) | Area resistance (Ω cm2) | Water uptake (%) | Transport number (%) |
|---|---|---|---|---|---|
| a The data were collected from the product brochure provided by the manufacturers. | |||||
| CJMA | 150 | 0.9–1.0 | 4 | 15–20 | 95 |
| CJMC | 150 | 0.8–1.0 | 3 | 40–45 | 93 |
| JAM-II-07 | 160–230 | 1.5–1.8 | 5.0–8.3 | 22–24 | 90–95 |
| JCM-II-07 | 160–230 | 1.7–2.0 | 2.0–5.5 | 33–38 | 95–99 |
| AMX | 134 | 1.25 | 2.35 | 16 | 91 |
| CMX | 164 | 1.62 | 2.91 | 18 | 98 |
2.2 Experiment setup
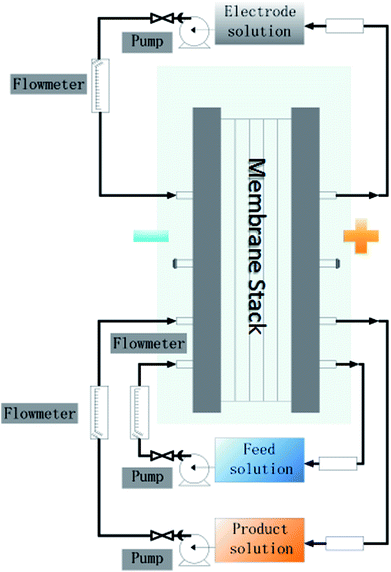
A schematic of the experimental setup and mechanism of extracting 5′-ribonucleotides via ED are illustrated in Fig. 1 and 2a, respectively. The setup is a lab-scale ED system designed and installed in our lab. The effective area of the membrane was 189 cm2. Ten repeat units were installed inside the ED stack. Partition nets (thickness = 1.0 mm) with flow channels were installed between adjacent membranes (Fig. 2b). The anode and cathode were made of titanium and coated with ruthenium. Each compartment was connected to a 1000 cm3 beaker, which allowed the circulation of external solutions via submersible pumps. Distilled water was used as the initial solution in the production compartment, and the nucleotide solution, mentioned in Section 2.1, was used as the initial solution in the feed compartment (Table 2). Sodium sulfate (0.3 M) was used as the electrolyte and supplied to the electrode compartment. The changes in the voltage and current values during the experiments were displayed on the monitor of the power supply.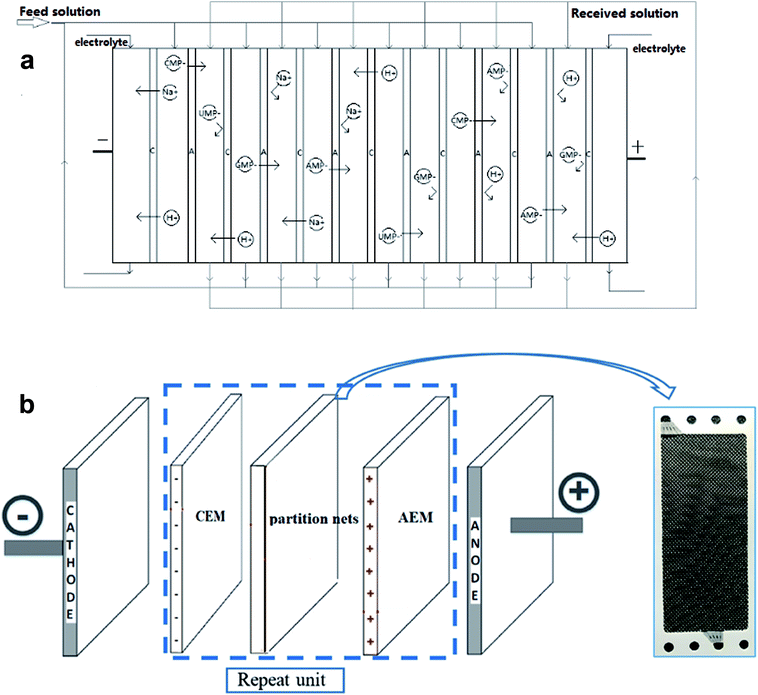 | ||
| Fig. 2 (a) Principle of electrodialysis to produce 5′-ribonucleotides. (b) Schematic diagram of the membrane stack. | ||
| Item | Characteristic |
|---|---|
| pH (20 °C) | 6.5 |
| Conductivity (ms cm−1) | 12.4 |
| Total 5′-ribonucleotide concentration (g L−1) | 30.0 |
| T430 (%) | 13.4 |
| Purity of 5′-ribonucleotides (%) | 83.3 |
For the lab-scale setup, the operating conditions were as follows. Initially, 10 repeat units were set in the ED stack, and each solution was circulated at a flow velocity of 20 L h−1 using a peristaltic pump (BT600L, Baoding Lead Fluid Technology Co., Ltd., China). The initial pH of the feed solution was 6.5 and the ratio of the initial volume of feed solution to received solution was 5![[thin space (1/6-em)]](https://www.rsc.org/images/entities/char_2009.gif) :
:![[thin space (1/6-em)]](https://www.rsc.org/images/entities/char_2009.gif) 3. Before the experiment, the solutions in each compartment were circulated for at least 10 min to inspect whether there were any leaks inside the stack and to eliminate potential bubbles trapped inside the ED stack. All the experiments were stopped when the conductivity of the feed compartment decreased below 0.1 mS cm−1 since the 5′-ribonucleotides were completely removed from feed the compartment.
3. Before the experiment, the solutions in each compartment were circulated for at least 10 min to inspect whether there were any leaks inside the stack and to eliminate potential bubbles trapped inside the ED stack. All the experiments were stopped when the conductivity of the feed compartment decreased below 0.1 mS cm−1 since the 5′-ribonucleotides were completely removed from feed the compartment.
To obtain the optimal conditions for the clean production of 5′-ribonucleotides, the membrane types, current density, energy consumption and bulk factor, were investigated and compared. Based on the lab-scale experimental results, the feasibility of 5′-ribonucleotides separation via the electrodialysis process on an industrial scale operation was taken into consideration.
2.3 Analysis method
The solution pH and conductivity changes in each compartment were monitored using a pH meter (PB-10, Sartorius Germany) and conductivity meter (DDBJ-350, Shanghai INESA & Scientific Instrument Co. Ltd.), respectively. According to the results of full band scanning for RNA hydrolysate, the pigment has the maximum absorbance at 430 nm. Thus, the pigments were determined via Spectrophotometry (Spectrumlab 752S) at a wavelength of 430 nm. The concentration of NaOH was determined by a titrimeter (848 Titrino plus, Metrohm) using a standard HCl solution. However, the concentration of 5′-ribonucleotides was determined by HPLC (1260 Infinity, Agilent Technologies), where the mobile phase comprised ammonium dihydrogen phosphate and methyl alcohol. The ion-exchange membranes used before and after ED were characterized via ATR-FTIR (Nicolet iS™5, Thermo Scientific USA) and scanning electron microscopy (QuantaTM 400 FEG, FEI).2.4 Calculation method
Current efficiency is an important index to evaluate the performance of the ED process, which indicates the ratio of the stoichiometric number of electrical charges required for the target product to the overall electrical charge employed in the ED stack:
 | (1) |
The decolorization rate Rd (%) was calculated using eqn (2):
 | (2) |
The recovery of 5′-ribonucleotides Rr (%) is expressed as follows:
 | (3) |
The energy consumption E is given by eqn (4):
 | (4) |
3. Results and discussion
3.1 The influence of membrane type
Fig. 3 shows the current behavior difference between the ChemJoy, Neosepta and TingRun membranes. Clearly, current across the stack increases sharply at the beginning of the experiment, and then decreases sharply (in case of Neosepta and TingRun) or slightly (in case of ChemJoy) towards the end. The initial increase can be attributed to the use of distilled water as the initial solution in the product compartment, where the resistance of the stack was very high at the beginning, but decreased immediately due to water-splitting caused by membrane polarization and the increase in concentration of electrolyte in the product compartment. The current trend also shows that 5′-nuleotides have good transferring ability in the ChemJoy and TingRun membranes. However, the current becomes significantly low after 40 min for the Neosepta membranes, which implies higher resistance and lower mobility of 5′-nuleotides. Thus, the inappropriate ion selectivity and membrane pore size made it difficult to use the Neosepta membranes in the electrodialysis system for the production of 5′-ribonucleotides.
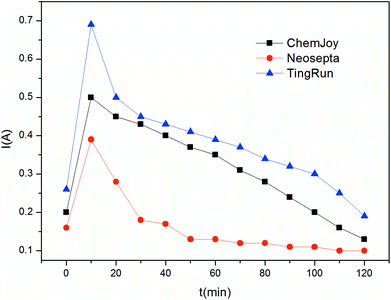 | ||
| Fig. 3 Current trend of three different membranes in the case of U = 10 V in the constant voltage operation. | ||
To further confirm the performance of the membranes during electrodialysis, time–voltage curves were recorded at a constant current operation, as shown in Fig. 4. The voltage drop for the stack using Neosepta membranes was greater than that for the others initially. Then, the voltage of the Neosepta membrane stack gradually decreased. This phenomenon can be attributed to the fact that the stack resistance is high at the beginning, and then decreases due to the electrolyte in feed solution migrating to the product compartment, as mentioned above. Moreover, the curve of TingRun membranes increased sharply at the end of experiment, which can be ascribed to the fact that there is less 5′-ribonucleotides in the feed compartment as the current carrier and membrane fouling increase with time. Simultaneously, the concentration of 5′-ribonucleotides in the feed compartment with Neosepta membranes is still relatively high compared to that with TingRun membranes. Thus, the voltage of the Neosepta membrane stack decreased, while that for the other membranes increased. Nevertheless, the ChemJoy membranes showed a smooth and steady change according to this figure, indicating that the migration of 5′-ribonucleotides was in perfect order and hardly affected by membrane fouling.
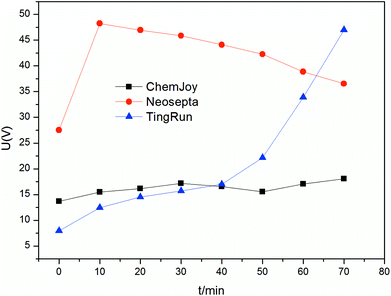 | ||
| Fig. 4 Voltage trend of three different membranes in the case of I = 0.25 A in the constant current operation. | ||
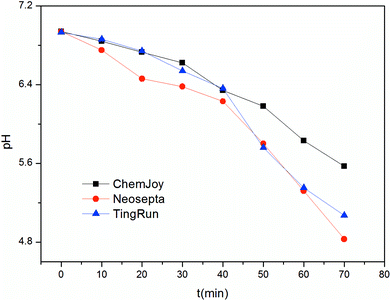
Membrane fouling can aggravate membrane polarization, which leads to the dissociation of water into H+ and OH−. Thus, the pH was monitored, as shown in Fig. 5, which confirmed that the Neosepta and TingRun membranes had significant membrane polarization during electrodialysis for the production of 5′-ribonucleotides. The pH in the feed compartment decreased remarkably with time after 40 min. The pH behavior in the feed and receiving compartments is of high importance for understanding the ED process since it may limit the recovery of 5′-ribonucleotides. Krol et al.24 studied the dissociation of water on mono-polar ion exchange membranes and concluded that there is a decrease in pH at the cathode side and an increase at the anode side of the membranes. The protonation and deprotonation reactions of the 5′-ribonucleotides would weaken the change in pH caused by water splitting, which are disadvantageous for the migration of 5′-ribonucleotides.
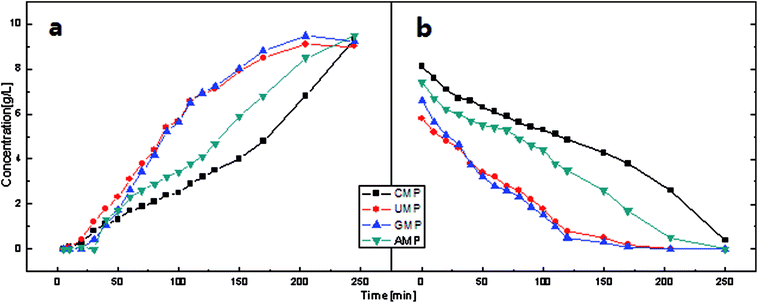 | ||
| Fig. 6 Concentration behavior of the feed and product compartments in the constant voltage operation (U = 10 V) during electrodialysis using ChemJoy membranes. | ||
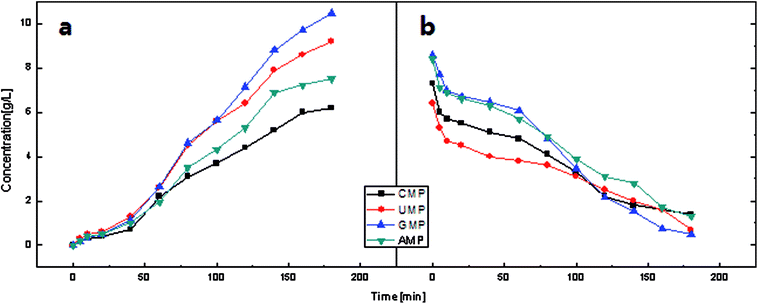 | ||
| Fig. 7 Concentration behavior of the feed and product compartments in the constant voltage operation (U = 10 V) during electrodialysis using Neosepta membranes. | ||
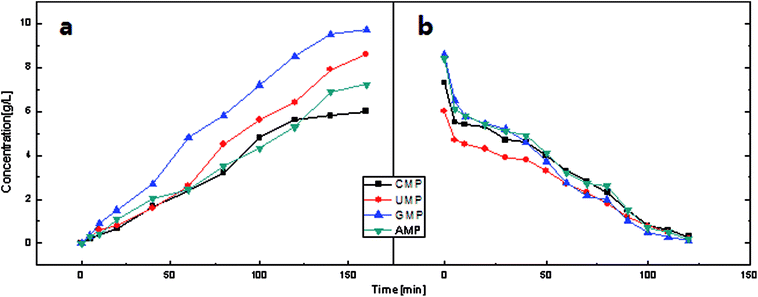 | ||
| Fig. 8 Concentration behavior of the feed and product compartments in the constant voltage operation (U = 10 V) during electrodialysis using TingRun membranes. | ||
| Membrane type | Rd (%) | Rr (%) | σ (mS cm−1) | pH |
|---|---|---|---|---|
| ChemJoy | 82.2% | 85.2% | 10.95 | 9.62 |
| TingRun | 73.9% | 70.9% | 8.79 | 8.42 |
| Astom | 84.2% | 56.1% | 14.8 | 12.24 |
Finally, it is important to mention that at the end of ED, the quantity of osmotic water was of the order Tingrun > ChemJoy > Neosepta, which carried pigments into the product compartment and affected the concentration effect.
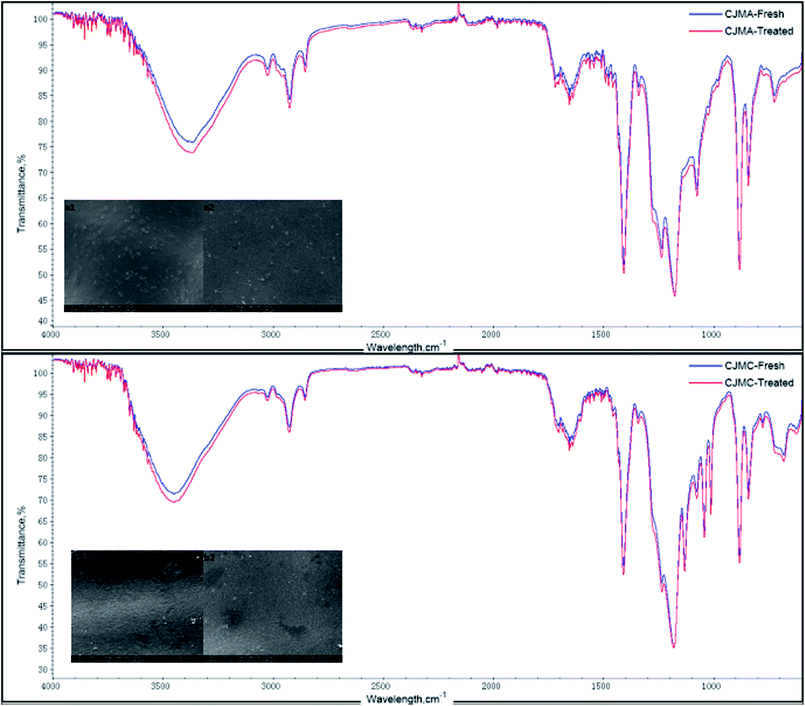
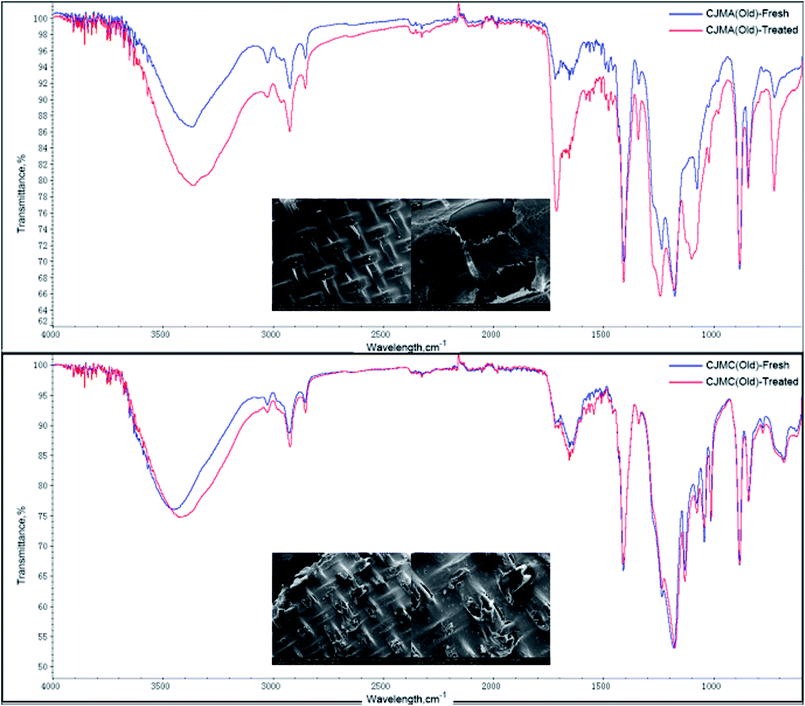
The ATR-FTIR spectra and SEM images of CJMC are shown in Fig. 9. Both ATR-FTIR and SEM demonstrated that there were no significant changes on the membrane surface before and after the experiment, which indicates that the CJMC membrane has anti-fouling ability toward 5′-ribonucleotide ions. With regards to CJMA, there was a slight change in its ATR-FTIR spectra but no additional peak was found. This slight change in transmittance may be attributed to the variation in membrane thickness. The phenomenon of membrane fouling in CJMC and CJMA was also confirmed by Jiang et al.25 using methionine as the research system in bipolar membrane electrodialysis (BMED). Thus, CJMC and CJMA have excellent anti-fouling characteristics for the production of organic acids via ED.
From the study on the properties of 5′-ribonucleotides, compared with those of the ion exchange membrane, the FTIR peaks at 1090 cm−1–1335 cm−1 (P![[double bond, length as m-dash]](https://www.rsc.org/images/entities/char_e001.gif) O stretching vibration), 1600 cm−1–1740 cm−1 (P–O bending vibration), and 960 cm−1 (phosphate groups symmetric stretching vibration) should be paid special attention. The ATR-FTIR spectra showed no significant change after ED for the Tingrun JCM membrane. However, there was a slight change in its SEM images. As shown in Fig. 10(d1 and d2), the surface of the JCM membrane after ED became rough, which indicates that the JCM membrane was not restored to its original state and more effective ways are needed for its regeneration. It is worth mentioning that the areal heterogeneity should be considered since no extra peaks appeared in the ATR-FTIR spectra. In the case of JAM, changes were observed both in the ATR-FTIR spectra and SEM images, which confirm that the membrane was fouled by the feed solutions to some extent.
O stretching vibration), 1600 cm−1–1740 cm−1 (P–O bending vibration), and 960 cm−1 (phosphate groups symmetric stretching vibration) should be paid special attention. The ATR-FTIR spectra showed no significant change after ED for the Tingrun JCM membrane. However, there was a slight change in its SEM images. As shown in Fig. 10(d1 and d2), the surface of the JCM membrane after ED became rough, which indicates that the JCM membrane was not restored to its original state and more effective ways are needed for its regeneration. It is worth mentioning that the areal heterogeneity should be considered since no extra peaks appeared in the ATR-FTIR spectra. In the case of JAM, changes were observed both in the ATR-FTIR spectra and SEM images, which confirm that the membrane was fouled by the feed solutions to some extent.
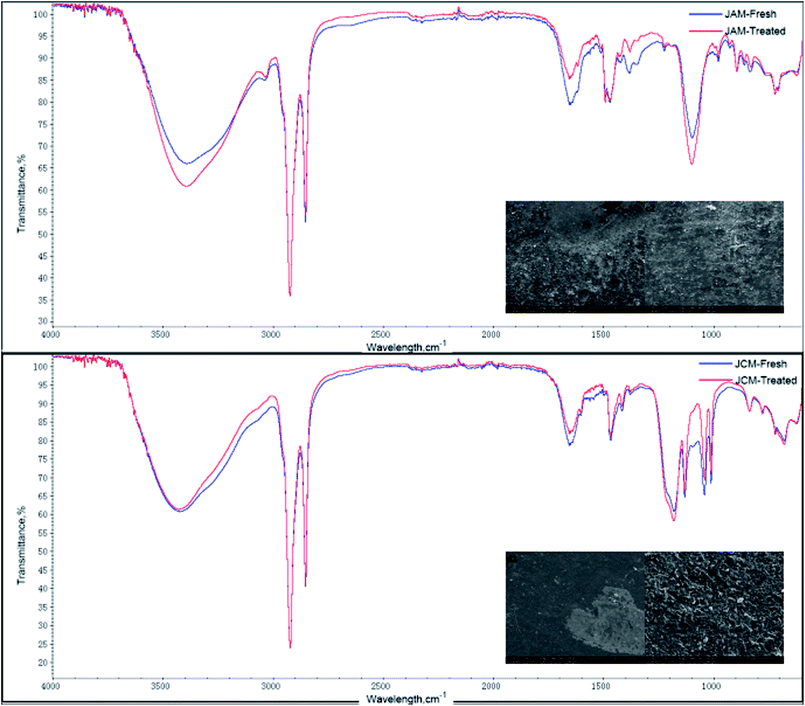 | ||
| Fig. 10 SEM images and ATR-FTIR spectra of the JAM and JCM membranes before and after the treatment of a nucleotide salt mixture: (c1) fresh and (c2) treated JAM and (d1) fresh and (d2) treated JCM. | ||
The same analysis can be applied for CMX and AMX. The SEM images of CMX and AMX showed no appreciable changes, as shown in Fig. 11(f1 and f2). The ATR-FTIR spectrum of CMX showed no changes before/after the experiments. However, for AMX, it showed that some 5′-ribonucleotides were entrapped inside the membrane. This is in accordance with the experimental results. The yield of the ED experiments using the three different types of membranes indicates that the TingRun and Neosepta membranes have a higher intercept performance than the ChemJoy membranes, which is attributed to the compactness and water content of these ion-exchange membranes.
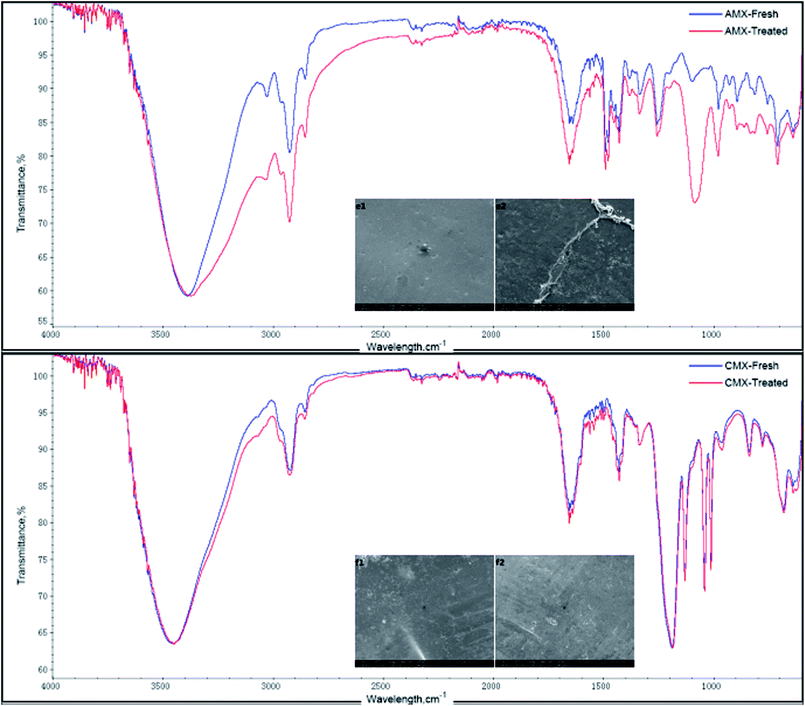 | ||
| Fig. 11 SEM images and ATR-FTIR spectra of the AMX and CMX membranes before and after the treatment of a nucleotide salt mixture: (e1) fresh and (e2) treated AMX; (f1) fresh and (f2) treated CMX. | ||
In summary, on the one hand, the fouling of the cation ion-exchange membranes was not significant because 5′-ribonucleotides treated at an appropriate pH have an almost negative valency. Slight fouling occurred because some components in enzymatic hydrolysate form gelatinous precipitates on the membrane surface, which could be rinsed with NaOH (0.1 mol L−1). However, the leakage of the negative valence ions in cation membranes should also be taken into consideration since this may allow 5′-ribonucleotides to permeate into the membranes. On the other hand, membrane fouling occurred in the JAM and AMX anion exchange membranes, which may have blocked the membrane pore channels, resulting in membrane degradation. Consequently, this increases the cost and the nucleotide production efficiency will decrease with use. Taking the abovementioned discussion into consideration, CJMA and CJMC membranes from ChemJoy are more suitable for the treatment of enzymatic hydrolysate, which exhibit excellent anti-fouling properties and high decolorization rates and nucleotides recovery ratios.
3.2 Process optimization
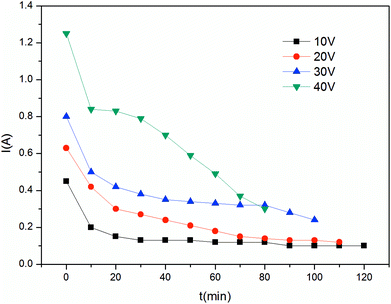
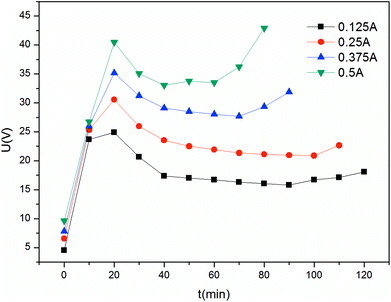
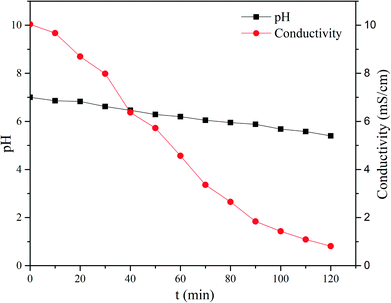
The constant current mode is used more frequently than the constant voltage mode due to its stable driving force, which also indicates greater energy consumption. The current investigated in this study was between 0.125 A and 0.5 A. As shown in Fig. 13, changes in the process are more evident. In the first stage, the curve has a sharp increase, which corresponds with the beginning of the I–t curve. When each compartment has enough electrolytes to serve as charge carriers, the mass transfer process tended to be stable; thus, a plateau is observed. In the final stage, due to the low concentration of electrolyte in the feed compartment, the voltage increases to maintain the current. In particular the voltage increases drastically for current above 0.375 A. In this case, the pH changes drastically since hydrolysis on the surface of the ion exchange membrane became increasingly severe. As mentioned in the constant voltage section, 30 V is suitable for ribonucleotide separation. The maximum voltage in the constant current mode does not exceed this value at I = 0.25 A and I = 0.125 A. As shown in Fig. 14, the feed compartment pH only gently declined from 7.0 to 5.5 during the entire process for I = 0.125 A. However, the conductivity of the feed compartment was as high as 0.81 mS cm−1 at 120 min, which indicates that a large amount of ribonucleotides still remained in the feed compartment. To increase the production efficiency and reduce the required membrane areas, I = 0.25 A is more suitable than I = 0.125 A in the constant current mode. Similarly, the constant voltage mode at U = 30 V could provide a stronger driving force than the constant current mode at I = 0.25 A. Thus, the constant voltage mode at U = 30 V is the best choice with the advantages of short time and high recovery.
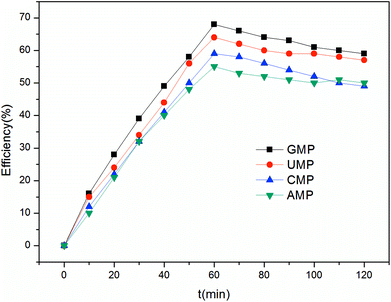 | ||
| Fig. 15 Current efficiency for four types of 5′-ribonucleotides in the constant current mode at I = 0.25 A. | ||
Furthermore, considering the effective area of the membrane on the lab-scale, its anti-fouling ability was investigated in short-cycle mass production. As shown in Table 4, the decolorization rate decreases from 91.6% to 84.6% for five consecutive batches. It was observed that the color of the feed solution was light, and the anion exchange membranes became dark after ED. This phenomenon indicates that some of the pigment was adsorbed by the anion membranes. Accordingly, the membrane fouling became aggravated as the treated hydrolysate volume increased. Nevertheless, the recovery of 5′-ribonucleotides in all the five batch experiments was above 93.0%. More significantly, this process provided the ability to concentrate ribonucleotides from 30 g L−1 to about 39 g L−1. However, degradation of the membrane performance indicates that the membranes need appropriate cleaning to restore their performance after a period time.
| Batch | Concentration (g L−1) | Recovery (%) | pH | Decolourization rate (%) | Purity of 5′-ribonucleotides (%) |
|---|---|---|---|---|---|
| 1 | 39.84 | 97.21 | 10.12 | 91.57 | 94.3 |
| 2 | 38.42 | 96.53 | 10.23 | 91.10 | 94.1 |
| 3 | 38.37 | 96.12 | 10.16 | 90.90 | 94.0 |
| 4 | 38.14 | 95.77 | 10.59 | 88.39 | 93.8 |
| 5 | 37.46 | 93.82 | 10.70 | 84.64 | 93.8 |
After passing through the membrane stack, the total concentration of 5′-ribonucleotides in the feed compartment decreased from 30 g L−1 to 1.75 g L−1 with 75% decolorization rate. However, electrical conductivity of the fresh liquid increased gradually with time. This indicates that during the long production period, the concentration polarization intensified on the surface of the membrane and influenced the membrane performance. Considering the membrane protection and current efficiency, we changed the second and the third voltage in the process and optimized the flow velocity ratio between the feed compartment and product compartment. It is worth mentioning that the feed solution should cycle in the membrane stack to remove the air bubbles trapped in the stacks. In this continuous production experiment, the feed solution in the third compartment had shorter processing time, which led to a low recovery rate and decolorization at the beginning of ED.
| Operation conditions | |
|---|---|
| Current density (A m−2) | 13.2 |
| pH control | 6.5 ± 0.2 |
| Membrane series | CJMA/CJMC |
| Recovery ratio | 97.2% |
| Decolorization ratio | 91.6% |
| Capital cost | |
|---|---|
| Membrane life (year) | 1 (at least) |
| Price for monopolar membrane ($ per m2) | 100 |
| Operation cost | |
|---|---|
| Electricity charge ($ per kW h) | 0.113 |
| Energy cost for 5′-ribonucleotide production ($ per t nucleotide) | 95.66 |
| Energy cost peripheral equipment ($ per t nucleotide) | 59.78 |
| Total energy cost ($ per t nucleotide) | 155.44 |
4. Conclusion
In this study, the feasibility of extracting 5′-ribonucleotides via ED from hydrolysate was investigated. The study revealed that CJMA and CJMC from ChemJoy are suitable for the production of 5′-ribonucleotides considering the 5′-ribonucleotide recovery ratio, decolorization ratio and membrane fouling. Furthermore, operating under a current density of 13.2 A m−2, the ED process showed a 5′-ribonucleotides-recovery ratio of 97.2% and decolorization ratio of 91.6%. The current efficiency for GMP reached 70% with high target product purity. The total energy cost of the pilot-scale operation was estimated to 155.44 $ per t 5′-ribonucleotides.In conclusion, the separation of 5′-ribonucleotides from RNA hydrolysate via ED can simplify the process and achieve their green production in industry.
Conflicts of interest
The authors declare there is no conflicts of interest regarding the publication of this paper.Nomenclature
| F | Faraday constant, 96![[thin space (1/6-em)]](https://www.rsc.org/images/entities/char_2009.gif) 487 C mol−1 487 C mol−1 |
| V | Circulated volume in product compartment, L |
| Z | Absolute valency of 5′-ribonucleotides |
| C0 | Concentration of 5′-ribonucleotides at the beginning in the product compartment, g L−1 |
| Ct | Concentration of 5′-ribonucleotides at time t in the product compartment, g L−1 |
| N | Number of repeating units in the membrane stack |
| I | Electrical current, A |
| η | Current efficiency, % |
| A0 | Absorbance of feed solution, % |
| Ap | Absorbance of product solution in product compartment, % |
| Rr | Recovery of 5′-ribonucleotides, % |
| M0 | Molar weight of 5′-ribonucleotides in the feed solution at time 0, mol |
| Mt | Molar weight of 5′-ribonucleotides in the feed solution at time t, mol |
| Mn | Molecular weight of 5′-ribonucleotides |
| E | Energy consumption, kw h g−1 |
| U | Voltage drop across the ED stack |
| Vt | Volume of product solution in the product compartment at time t, L |
Acknowledgements
Project was supported in part by the National Basic Research Program of China (973) (2013CB733602).We would also like to acknowledge the financial support provided by 21390204, IRT_14R28, 21636003, PAPD, 21606128, 2017YFD0400402 and BK20151452. Finally, Jingwei Z. wants to thank, in particular, the invaluable support received from Xin M. this year.References
- M. Kameche, F. Xu, C. Innocent and G. Pourcelly, Electrodialysis in water–ethanol solutions: application to the acidification of organic salts, Desalination, 2003, 154, 9–15 CrossRef.
- M. Cosgrove, Nucleotides, Nutrition, 1998, 14, 748–751 CrossRef PubMed.
- H. Takahashi, K. Ohba and K. I. Kikuchi, Sorption of mono-carboxylic acids by an anion-exchange membrane, Biochem. Eng. J., 2003, 16, 311–315 CrossRef.
- D. Choudhury, A. K. Pal, N. P. Sahu, S. Kumar, S. S. Das and S. C. Mukherjee, Dietary yeast RNA supplementation reduces mortality by Aeromonas hydrophila in rohu (Labeo rohita L.) juveniles, Fish Shellfish Immunol., 2005, 19, 281–291 CrossRef PubMed.
- K. Inoue, R. Obara, T. Hino and H. Oka, Development and application of an HILIC-MS/MSmethod for the quantitation of nucleotides in infant formula, J. Agric. Food Chem., 2010, 58, 9918–9924 CrossRef PubMed.
- J.-S. Park, J.-H. Song, K.-H. Yeon and S.-H. Moon, Removal of hardness ions from tap water using electromembrane processes, Desalination, 2007, 202, 1–8 CrossRef.
- C. Jiang, Y. Wang, Z. Zhang and T. Xu, Electrodialysis of concentrated brine from RO plant to produce coarse salt and freshwater, J. Membr. Sci., 2014, 450, 323–330 CrossRef.
- T. Mohammadi and A. Kaviani, Water shortage and seawater desalination by electrodialysis, Desalination, 2003, 158, 267–270 CrossRef.
- J. S. J. Ferrer, S. Laborie, G. Durand and M. Rakib, Formic acid regeneration by electromembrane process, J. Membr. Sci., 2006, 280, 509–516 CrossRef.
- Y. J. Wee, J. S. Yun, Y. Y. Lee, A. P. Zeng and H. W. Ryu, Recovery of lactic acid by repeated batch electrodialysis and lactic acid production using electrodialysis wastewater, J. Biosci. Bioeng., 2005, 99, 104–108 CrossRef PubMed.
- N. Boniardi, R. Tota, G. Nano and B. Mazza, Lactic acid production by electrodialysis. Part I. Experimental tests, J. Appl. Electrochem., 1997, 27, 125–133 CrossRef.
- E. G. Lee, S.-H. Moon, Y. K. Chang, I.-K. Yoo and H. N. Chang, Lactic acid recovery using two-stage electrodialysis and its modelling, J. Membr. Sci., 1998, 145, 53–66 CrossRef.
- S. Novalic, T. Kongbangkerd and K. D. Kulbe, Separation of gluconate with conventional and bipolar electrodialysis, Desalination, 1997, 114, 45–50 CrossRef.
- S. Novalic, T. Kongbangkerd and K. D. Kulbe, Recovery of organic acids with high molecular weight using a combined electrodialytic process, J. Membr. Sci., 2000, 166, 99–104 CrossRef.
- K. Inoue, R. Obara, T. Akiba, T. Hino and H. Oka, Determination of nucleotides in infant formula by ion-exchange liquid chromatography, J. Agric. Food Chem., 2008, 56, 6863–6867 CrossRef PubMed.
- V. Lindstrand, G. Sundstrom and A. S. Jonsson, Fouling of electrodialysis membranes by organic substances, Desalination, 2000, 128, 91–102 CrossRef.
- C. Jiang, Q. Wang, Y. Zhang, Y. Li, Y. Wang and T. Xu, Separation of methionine from the mixture with sodium carbonate using bipolar membrane electrodialysis, J. Membr. Sci., 2016, 498, 48–56 CrossRef.
- H. J. Lee, S. H. Moon and S. P. Tsai, Effects of pulsed electric fields on membrane fouling in electrodialysis of NaCl solution containing humate, Sep. Purif. Technol., 2002, 27, 89–95 CrossRef.
- D. I. Chang, K. H. Choo, J. H. Jung, L. Jiang, J. H. Ahn, M. Y. Nam, E. S. Kim and S. H. Jeong, Foulant identification and fouling control with iron oxide adsorption in electrodialysis for the desalination of secondary effluent, Desalination, 2009, 236, 152–159 CrossRef.
- N. Tanaka, M. Nagase and M. Higa, Organic fouling behavior of commercially available hydrocarbon-based anion-exchange membranes by various organic fouling substances, Desalination, 2012, 296, 81–86 CrossRef.
- E. Ayala-Bribiesca, G. Pourcelly and L. Bazinet, Nature identification and mophology characterization of cation-exchange membrane fouling during conventional electrodialysis, J. Colloid Interface Sci., 2006, 300, 663–672 CrossRef PubMed.
- E. Ayala-Bribiesca, M. Araya-Farias, G. Pourcelly and L. Bazinet, Effect of concentrate solution pH and mineral composition of whey protein dilute solution on membrane fouling formation during conventional electrodialysis, J. Membr. Sci., 2006, 280, 790–801 CrossRef.
- A. Bukhovets, T. Eliseeva and Y. Oren, Fouling of anion-exchange membranes in electrodialysis of aromatic amino acid solution, J. Membr. Sci., 2010, 364, 339–344 CrossRef.
- H. Strathmann, J. J. Krol and H. J. Rapp, et al., Limiting current density and water dissociation in bipolar membranes, J. Membr. Sci., 1997, 125, 123–142 CrossRef.
- C. Jiang, Q. Wang and Y. Zhang, et al., Separation of methionine from the mixture with sodium carbonate using bipolar membrane electrodialysis, J. Membr. Sci., 2016, 498, 48–56 CrossRef.
| This journal is © The Royal Society of Chemistry 2018 |

