 Open Access Article
A facile strategy for the synthesis of graphene/V2O5 nanospheres and graphene/VN nanospheres derived from a single graphene oxide-wrapped VOx nanosphere precursor for hybrid supercapacitors†
Wei Sun ,
Xiujie Ji,
Guohua Gao
 * and
Guangming Wu*
Shanghai Key Laboratory of Special Artificial Microstructure Materials and Technology, School of Physics and Science Engineering, Tongji University, Shanghai, 200092, PR China. E-mail: gao@tongji.edu.cn; wugm@tongji.edu.cn
First published on 6th August 2018
Abstract
It remains a challenge to develop a facile approach to prepare positive and negative electrode materials with good electrochemical performance for application in hybrid supercapacitors. In this study, based on a facile strategy, a single graphene oxide-wrapped VOx nanosphere precursor is transformed into both electrodes through different thermal treatments (i.e., graphene/VN nanospheres negative electrode materials and graphene/V2O5 nanospheres positive electrode materials) for hybrid supercapacitors. The conformally wrapped graphene has a significant influence on the electrochemical performance of VN and V2O5, deriving from the simultaneous improvements in electronic conductivity, structural stability, and electrolyte transport. Benefitting from these merits, the as-prepared graphene/VN nanospheres and graphene/V2O5 nanospheres exhibit excellent electrochemical performance for HSCs with high specific capacitance (83 F g−1) and good long cycle life (90% specific capacitance retained after 7000 cycles). Furthermore, graphene/VN nanospheres//graphene/V2O5 nanosphere HSCs can deliver a high energy density of 35.2 W h kg−1 at 0.4 kW kg−1 and maintain about 70% high energy density even at a high power density of 8 kW kg−1. Such impressive results of the hybrid supercapacitors show great potential in vanadium-based electrode materials for promising applications in high performance energy storage systems.
1. Introduction
The rapid development of electronic devices and electric vehicles greatly increases the demand for energy storage devices with high energy density, low cost, and reliable stability.1,2 As the current main energy power sources, supercapacitors (SCs) have received tremendous attention because of their fast charge/discharge ability, high power density, and notable cycle life. Unfortunately, the practical applications of SCs still remain a stumbling block since their energy densities are far from high-energy-density devices.3–5 Therefore, the improvement of SCs with high performance and facile methods is highly desirable.To meet the future energy market, researchers propose hybrid supercapacitors (HSCs),6–9 which extend the operating voltage through full use of the absolutely opposite potential window of the negative and positive electrode materials.10,11 It is expected that this hybrid system exhibits reliable cycling stability and battery-like high energy density. In light of the total operating voltage and capacitance governed by positive and negative electrodes, the characteristic of two electrode materials (such as specific capacitance and potential window) are considered as the key component in increasing the energy density of HSCs by maximizing the operating voltage in the systems.12 Accordingly, considerable research has been focused on fabricating high-performance negative and positive electrode materials. Up to now, various materials, such as transition metal oxides/hydroxides, phosphides or sulfides, have been developed as positive electrode materials in HSCs due to their rich oxidation states and high theoretical-specific capacitance derived from reversible and rapid redox reactions. Thus, extensive research interest has been invested in them. However, the advancement obtained by negative electrode materials is far lagging behind positive electrode materials, which restricts the process of high-performance HSCs. Nowadays, the most widely available negative electrode materials are mainly based on carbonaceous materials, which delivers much lower (3–4 times) specific capacitance (100–250 F g−1) than that of positive electrode materials. Compared with carbonaceous negative electrode materials that based on electrical double layer energy-storage mechanism, pseudocapacitive materials employed as negative electrode materials are becoming one of most promising alternatives for HSCs because they possess higher specific capacitance and energy density. Since the first introduction, few types of pseudocapacitive negative electrode materials have been reported, such as TiO2,13 MoO3,14 Fe2O3,15,16 and V6O13.17 For example, Fe2O3, used to be the most prominent negative material, exhibits high theoretical-specific capacitance, nontoxicity, and low cost.18 Raut et al. have decorated α-Fe2O3 on MWCNT in order to increase their electrical conductivity, which exhibited much higher specific capacitance (431 F g−1) than those of the pristine α-Fe2O3 (187 F g−1) and MWCNT (81 F g−1).19 Despite these efforts, these above mentioned pseudocapacitive negative electrode materials still have relatively limited specific capacitance and power capability. Among these reasons for this, the intrinsically poor electrical conductivity of these electrode materials poses a great influence that confines their electrochemical performance.
In recent years, vanadium nitride (VN) holds considerable promise as negative electrode materials for HSCs because of its versatile merits including high theoretical-specific capacitance (1340 F g−1) and outstanding electrical conductivity (1.67 × 10⁴ Ω−1 cm−1) compared with its corresponding oxides.20–22 Furthermore, VN has high hydrogen evolution potential in aqueous solution, which can deliver a wide working window in negative potential for HSCs.23 Unfortunately, the morphology of pristine VN commonly consists of accumulational nanoparticles with weak interconnection, which affect the electronic conductivity and restrict the ionic conductivity. As a consequence, its rate capability is degraded greatly. Furthermore, the irreversible oxidation reaction of VN materials causes pulverization and deterioration of their structures during repeated charge/discharge process, leading to poor electrochemical stability.24,25 For example, the nanocrystalline VN covered on MCNT composite as negative electrode materials showed a specific capacitance of 289 F g−1 only with 64% capacitance retention after 600 cycles.26 The reported strategy to circumvent this stumbling block is to directly coat carbon material on nanoscale VN as protective layer. For example, recently, Zhang et al. reported that well-aligned VN nanowire arrays (NWAs) shelled with a carbon layer had a reversible specific capacitance of 715 mF cm2 and a capacitance retention rate of 90% after 6000 cycles.27 Despite much progress has been achieved, the trouble of unsatisfied electrochemical performance still exist, probably because of the individual outer carbon coating which cannot fully ensure a fast electron transfer across the whole interfaces of electrode materials. Hence, an upgraded strategy for constructing interconnected conductive network by combing VN nanosphere and carbon network consisting of two-dimensional (2D) graphene (GR) is proposed for high-performance HSCs. Compared to the abovementioned amorphous carbon layer, GR, as 2D structure of carbon atoms, has unique electrical conductivity, large specific surface and structural flexibility, which drives researchers to design composite materials with it for energy storage.
Herein, we have successfully fabricated a graphene oxide (GO)-wrapped VOx nanosphere (GO-wrapped VOx NSP) precursor; the uniform VOx nanospheres are evenly distributed into the GR matrix, interconnecting to form a conductive network structure. Then, through different thermal treatments the precursor can be facilely transformed to GR/VN nanosphere and GR/V2O5 nanosphere composites, suitable for the negative and positive electrode materials of HSCs, respectively. As a proof of upgraded strategy, HSCs is assembled based on the single GR-wrapped VOx nanosphere precursor-derived positive and negative, and excellent electrochemical performance, such as high energy density and enhanced cycle stability, is achieved. This strategy may open up a promising way to new-type supercapacitors with excellent electrochemical performance.
2. Experimental section
2.1 Preparation of GO-wrapped VOx nanosphere composite
The GO-wrapped VOx NSP was prepared by following the process previously reported with modifications.28 Vanadium oxide (VOx) sol was used as vanadium source, as previously reported by our group.29 The obtained GO nanosheets were dispersed into ethylene glycol to form suspension with the concentration of 2 mg mL−1, and then ultrasonicated for 30 min. In a typical procedure, 5 mL 3 mg mL−1 GO dispersion was firstly mixed uniformly with 5 μL ethylenediamine (EDA) by ultrasonic dispersion for 15 min to give solution A. 16 g commercial V2O5 powder was suspended in a 300 mL mixed solution of benzyl alcohol and isopropanol (C7H8O![[thin space (1/6-em)]](https://www.rsc.org/images/entities/char_2009.gif) :
:![[thin space (1/6-em)]](https://www.rsc.org/images/entities/char_2009.gif) C3H8O = 1
C3H8O = 1![[thin space (1/6-em)]](https://www.rsc.org/images/entities/char_2009.gif) :
:![[thin space (1/6-em)]](https://www.rsc.org/images/entities/char_2009.gif) 7.5 v/v) under magnetic stirring for 30 min. Then the suspension was heated at 110 °C under condensate reflux for 4 h. After filtration, the filtrate was concentrated to 1/3 volume through heating reflux to given solution B (VOx sol). 5 mL solution A and 3 mL solution B were poured slowly into a beaker pre-filled with 30 mL isopropyl alcohol and 0.5 mL acetic acid. The solution was stirred for 30 min and then poured into a Teflon-lined autoclave. The autoclave was sealed and maintained at 180 °C for 20 h. After cooling to room temperature, the graphene-wrapped VOx nanosphere composite was obtained after washing with water and vacuum drying overnight. For comparison, the pure VOx microspheres were also prepared following the above-mentioned experimental without GO dispersion.
7.5 v/v) under magnetic stirring for 30 min. Then the suspension was heated at 110 °C under condensate reflux for 4 h. After filtration, the filtrate was concentrated to 1/3 volume through heating reflux to given solution B (VOx sol). 5 mL solution A and 3 mL solution B were poured slowly into a beaker pre-filled with 30 mL isopropyl alcohol and 0.5 mL acetic acid. The solution was stirred for 30 min and then poured into a Teflon-lined autoclave. The autoclave was sealed and maintained at 180 °C for 20 h. After cooling to room temperature, the graphene-wrapped VOx nanosphere composite was obtained after washing with water and vacuum drying overnight. For comparison, the pure VOx microspheres were also prepared following the above-mentioned experimental without GO dispersion.
2.2 Preparation of GR/V2O5 nanosphere composite
The GO-wrapped VOx NSP was firstly annealed in N2 at 300 °C for 1 h with a ramp rate of 1 °C min−1, the temperature was then rose to 350 °C, after which the samples were further annealed in air at 350 °C for 2 h. The obtained was noted as GR/V2O5 NSP.2.3 Preparation of GR/VN nanosphere composite
The GO-wrapped VOx NSP was directly annealed in NH3 at 600 °C for 2 h with a ramp rate of 5 °C min−1. The obtained was noted as GR/VN NSP.2.4 Characterization
Samples were characterized using SEM (XL30FEG), TEM (JEOL-2100 TEM operating at 200 kV), and rotation anode X-ray powder diffraction (XRD) (Rigaku D/max-C) equipped with Cu Kα radiation source (λ = 1.5406 Å). All the electrochemical measurements were conducted using an electrochemical workstation (CHI 660D). The electrochemical studies of the individual electrode were performed in a three-electrode cell, with Pt counter electrode and an Ag/AgCl reference electrode in 8 M LiCl aqueous solution.2.5 Electrode preparation and electrochemical measurements
The working electrodes were prepared by coating the slurry of the active material, conductive carbon black, and polymer binder (polyvinylidenefluoride, PVDF) with a mass ratio of 90![[thin space (1/6-em)]](https://www.rsc.org/images/entities/char_2009.gif) :
:![[thin space (1/6-em)]](https://www.rsc.org/images/entities/char_2009.gif) 5:
5:![[thin space (1/6-em)]](https://www.rsc.org/images/entities/char_2009.gif) 5 using N-methylpyrrolidone (NMP) as the solvent on graphite substrates. The electrodes were dried at 120 °C for 12 h under vacuum and the active material loading was about 2 mg cm−2. According the thermogravimetric (TG) analysis (Fig. S2, ESI†), the content of graphene in the final electrode is about 43.3% (the detailed calculations are given in the ESI†). Electrochemical measurements on the capacitive performance are conducted with a CHI 660D electrochemical workstation in an aqueous LiCI electrolyte (8.0 M) using a three-electrode cell, where a Pt foil serves as the counter electrode and a Ag/AgCI as the reference electrode. The specific capacitance was calculated from the galvanostatic discharge curves based on the following equation: C = IΔt/mΔV, where I is the discharge current, Δt is the discharge time, ΔV is the voltage range, and m is the mass of the active material.
5 using N-methylpyrrolidone (NMP) as the solvent on graphite substrates. The electrodes were dried at 120 °C for 12 h under vacuum and the active material loading was about 2 mg cm−2. According the thermogravimetric (TG) analysis (Fig. S2, ESI†), the content of graphene in the final electrode is about 43.3% (the detailed calculations are given in the ESI†). Electrochemical measurements on the capacitive performance are conducted with a CHI 660D electrochemical workstation in an aqueous LiCI electrolyte (8.0 M) using a three-electrode cell, where a Pt foil serves as the counter electrode and a Ag/AgCI as the reference electrode. The specific capacitance was calculated from the galvanostatic discharge curves based on the following equation: C = IΔt/mΔV, where I is the discharge current, Δt is the discharge time, ΔV is the voltage range, and m is the mass of the active material.
The evaluation of HSCs was conducted in a two-electrode cell at room temperature in 8 M LiCI aqueous electrolyte solution. HSCs were fabricated by assembling GR/V2O5 NSP cathode and GR/VN NSP anode and the working electrodes were prepared by the above-stated method. The loading mass ratio of active material (GR/V2O5 NSP![[thin space (1/6-em)]](https://www.rsc.org/images/entities/char_2009.gif) :
:![[thin space (1/6-em)]](https://www.rsc.org/images/entities/char_2009.gif) GR/VN NSP) was estimated according to the well-known charge balance equation (q+ = q−). In order to get q+ = q− at current density of 1 A g−1, the mass ratio was calculated based on the following equation:
GR/VN NSP) was estimated according to the well-known charge balance equation (q+ = q−). In order to get q+ = q− at current density of 1 A g−1, the mass ratio was calculated based on the following equation:  The charge stored by each electrode depends on the specific capacitance (C), the voltage range for the charge/discharge process (ΔV) and the mass of the electrode (m). The calculated value of mass ratio between GR/V2O5 NSP and GR/VN NSP is about 0.8. The electrode of GR/V2O5 NSP and GR/VN NSP contained about 2.3 mg and 3 mg of active materials, respectively, which is close to the optimal mass ratio of 0.8. The two identical electrodes were placed together and separated by a porous nonwoven cloth separator. The energy density (E) and power density (P) of HSCs against the two electrodes in the device are calculated based on the total mass of the active materials using the following equations: E = 1/2CV2 and P = E/Δt, where V is the potential change during the discharge process and Δt is the discharge time.
3. Results and discussion
3.1 Structural formation mechanism
Raman and infrared spectroscopy were used to confirm the qualities of as-prepared GO and graphene (GR). As shown in Fig. S1a (ESI†), the following functional groups were identified in the sample: O–H stretching vibrations (3420 cm−1), C![[double bond, length as m-dash]](https://www.rsc.org/images/entities/char_e001.gif) O stretching vibration (1726 cm−1), C
O stretching vibration (1726 cm−1), C![[double bond, length as m-dash]](https://www.rsc.org/images/entities/char_e001.gif) C from unoxidized sp2 CC bonds (1623 cm−1), and C–O vibrations (1060 cm−1).30 The result of the FTIR spectra confirms the presence of oxygen-containing groups on as-prepared GO surface, which are benefit for forming stable and uniform dispersion. In the Raman spectra (Fig. S1b, ESI†) of as-prepared GO, the G band is prominent and shifted to 1596 cm−1. Meanwhile, the D band at 1355 cm−1 becomes dominant, indicating the reduction in size of the in-plane sp2 domains, due to the extensive oxidation. Comparing with GO, the Raman spectra of GR also contains both D and G bands (at 1348 and 1586 cm−1, respectively) with an increase D/G intensity ratio. This difference implies a decrease in the average size of the sp2 domains upon reduction of the exfoliated GO.31 The formation procedure of the GO-wrapped VOx involves three major steps as schematically displayed in Fig. 1 (see the Experimental section for details). First, the VOx sol was added to the precursor solution under vigorous stirring to homogenously form the VOx oligomers by the olation.32 Due to a strong coordination interaction between the vanadium ions from the VOx oligomers and oxygen groups from graphene oxide (GO), the oligomers could be easily attached to the surface of GO (stage I). Second, the VOx nucleuses are generated in the isopropyl alcohol due to the supersaturated formation of VOx oligomers under high pressure condition of solvothermal reactions (stage II). Simultaneously, the suspended nucleuses in the solution undergo the aggregation process and transform to nanospheres to reduce overall surface free energy in stage III. After the in situ solvothermal process, GO-wrapped VOx NSP was obtained. Then, through different thermal treatment processes, the GO-wrapped VOx NSP precursor can be either transformed to GR/VN NSP or oxidized to GR/V2O5 NSP. Finally, the HSCs device is assembled by using the GR/VN NSP and the GR/V2O5 NSP as anode and cathode, respectively.
C from unoxidized sp2 CC bonds (1623 cm−1), and C–O vibrations (1060 cm−1).30 The result of the FTIR spectra confirms the presence of oxygen-containing groups on as-prepared GO surface, which are benefit for forming stable and uniform dispersion. In the Raman spectra (Fig. S1b, ESI†) of as-prepared GO, the G band is prominent and shifted to 1596 cm−1. Meanwhile, the D band at 1355 cm−1 becomes dominant, indicating the reduction in size of the in-plane sp2 domains, due to the extensive oxidation. Comparing with GO, the Raman spectra of GR also contains both D and G bands (at 1348 and 1586 cm−1, respectively) with an increase D/G intensity ratio. This difference implies a decrease in the average size of the sp2 domains upon reduction of the exfoliated GO.31 The formation procedure of the GO-wrapped VOx involves three major steps as schematically displayed in Fig. 1 (see the Experimental section for details). First, the VOx sol was added to the precursor solution under vigorous stirring to homogenously form the VOx oligomers by the olation.32 Due to a strong coordination interaction between the vanadium ions from the VOx oligomers and oxygen groups from graphene oxide (GO), the oligomers could be easily attached to the surface of GO (stage I). Second, the VOx nucleuses are generated in the isopropyl alcohol due to the supersaturated formation of VOx oligomers under high pressure condition of solvothermal reactions (stage II). Simultaneously, the suspended nucleuses in the solution undergo the aggregation process and transform to nanospheres to reduce overall surface free energy in stage III. After the in situ solvothermal process, GO-wrapped VOx NSP was obtained. Then, through different thermal treatment processes, the GO-wrapped VOx NSP precursor can be either transformed to GR/VN NSP or oxidized to GR/V2O5 NSP. Finally, the HSCs device is assembled by using the GR/VN NSP and the GR/V2O5 NSP as anode and cathode, respectively.
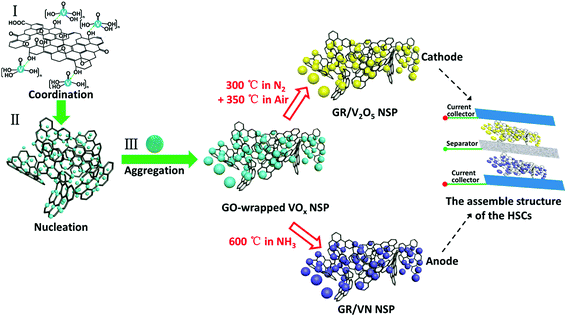 | ||
| Fig. 1 Schematic illustration of the fabrication process. GR/V2O5 NSP cathode and GR/VN anode are obtained from the same GO-wrapped VOx NSP and assemble into the hybrid supercapacitor. | ||
3.2 Morphology and structure characterization
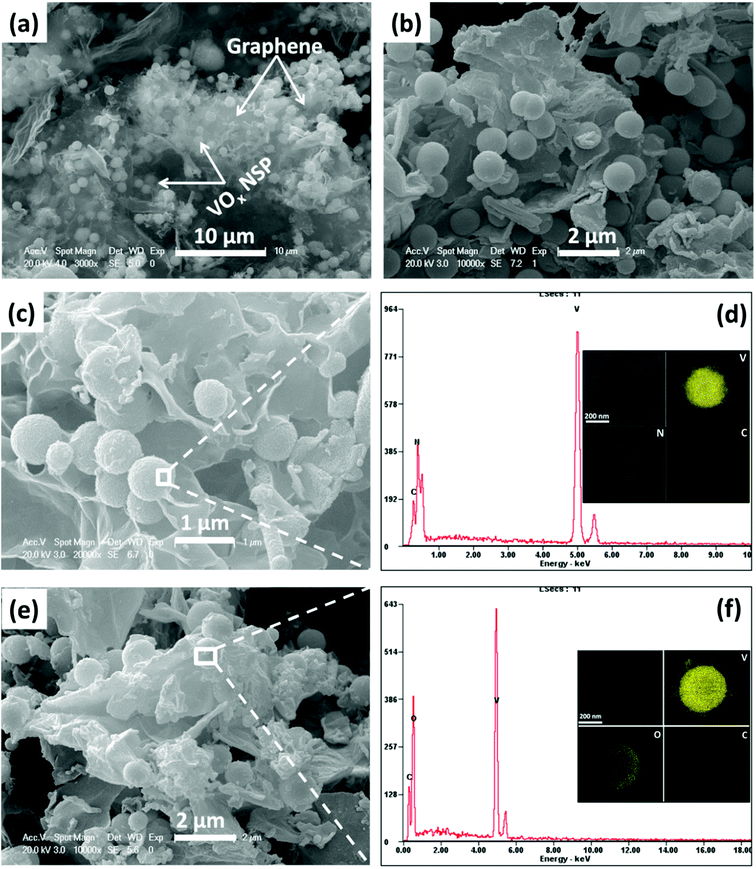
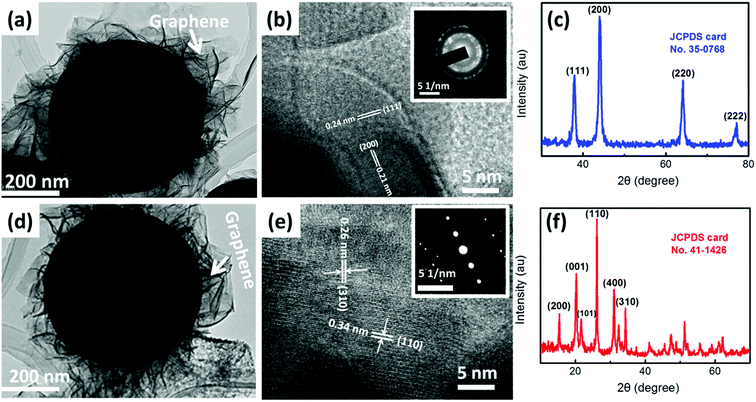
Fig. 2a and b demonstrate the morphology of the obtained GO-wrapped VOx NSP as starting material. As shown in the low-magnification SEM (Fig. 2 a), VOx nanospheres are incorporated into the GO matrix and uniformly wrapped by highly crumpled GO. Meanwhile, these highly crumpled GO sheets constitute a continuous porous network structure (Fig. 2a), which may be beneficial to the rapid transport of electrolyte and the structural stability. The close observation in Fig. 2b reveals that the highly uniform VOx nanospheres have an average diameter of ∼700 nm without obvious particle aggregation. Through different thermal treatments GO-wrapped VOx NSP can then easily be transformed to vanadium nitride and vanadium oxide. In Fig. 2c and e, it is seen that GR/VN NSP and GR/V2O5 NSP is obtained by thermal treatment in ammonia and air, respectively. VN and V2O5 nanospheres remain spherical in shape with high uniformity and the crumpled GR uniformly wrapping VN or V2O5 nanospheres can be easily found as expected (Fig. 2c and e). No obvious changes can be detected after thermal treating, indicating that the ammonia reduction and air oxidation did not destroy the overall shape and sizes of the GO-wrapped VOx precursor. Fig. S3a and b (ESI†) show the SEM images of VN and V2O5 nanospheres fabricated without GO-ethyleneglycol dispersion in the solvothermal system. Interestingly, compared with GR/VN NSP or GR/V2O5 NSP (Fig. 2c and e), both pristine VN and V2O5 nanospheres show larger diameter (∼800 nm), implying the GO in solvothermal system as a barrier can restrain the growth of nanospheres. The corresponding EDS spectra in Fig. 2d indicate that the nanospheres are mainly composed of V, N and C elements, suggesting VN have successfully been fabricated. To further confirm the structure of as-prepared samples, STEM-EDS element mapping is performed. As shown in the insets of Fig. 2d and f, uniform distribution of V, N, and O form a sphere morphology, which are in accordance with the mapping area of VN and V2O5 nanospheres, respectively. In addition, the C signal area can be detected in both samples, revealing the sophisticated combination of the fabricated GR and vanadium-based nanospheres.The TEM and high-resolution TEM (HRTEM) were also performed to further analyze the detailed structures of the samples. The TEM images in Fig. 3a and d manifest the VN nanospheres and V2O5 nanospheres remain spherical in shape with diameter of ∼600 nm. In comparison with the spheres before the thermal treatment, a slight contraction of spheres is detected, resulting from the thermal annealing process. Meanwhile, the visible GR can be easily found and the nanospheres are extreme evenly wrapped by highly crumpled GR in the nanostructure of both samples, which is consistent with the SEM results. The HRTEM image taken from the corresponding nanosphere in Fig. 3b depicts that VN nanosphere has a clear crystalline structure with the lattice spacing of 0.24 and 0.21 nm, which are in good agreement with d-spacing of (111) and (200) plane of cubic VN (JCPDS Card no. 35-0768). As for GR/V2O5 NSP, Fig. 3e suggests the inter-planar spacing is about 0.26 and 0.34 nm which corresponds to the (310) and (110) plane of the orthorhombic phase V2O5 (JCPDS, Card no. 41-1426). The corresponding selected area electron diffraction (SAED) patterns of GR/VN NSP and GR/V2O5 NSP in the top-right insets of Fig. 3b and e imply the excellent crystallinity of the obtained samples by the thermal annealing process. The X-ray diffraction (XRD) patterns of the ammonia thermal treatment and the air thermal treatment are shown in Fig. 3c and f, the peaks from ammonia treatment product could be assigned to (111), (200), (220) and (222) lattice planes of cubic VN, respectively and the peaks obtained from the air treatment product could be indexed to (200), (001), (101) and (110) diffraction of orthorhombic V2O5. No obvious peaks from other phases can be observed in both samples, demonstrating the obtained materials with high purity and the complete conversion from GO-wrapped VOx NSP during the thermal treatment.
3.3 Electrochemical performance of GR/VN NSP and GR/V2O5 NSP
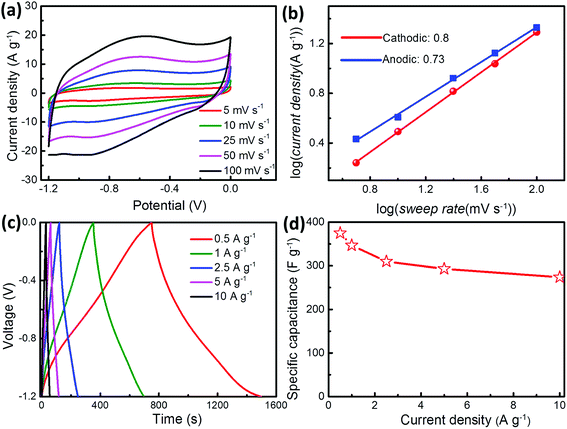
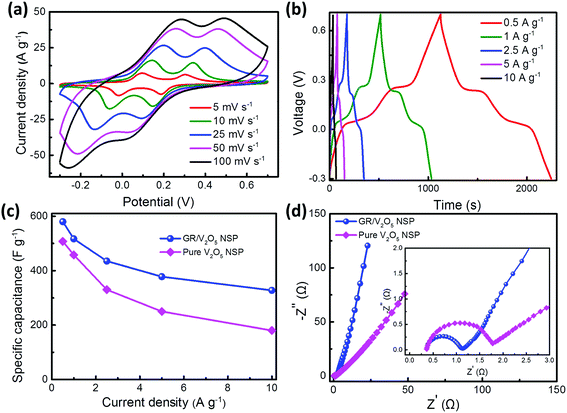
Similarly, the electrochemical properties of as-formed GR/V2O5 NSP were also evaluated using CV curves and the galvanostatic test. Representative CV curves of V2O5-based electrode material at sweep rates ranging from 5 to 100 mV s−1 in the potential range of −0.3–0.7 V are shown in Fig. 5a. Apparently, the redox peaks are visible in CV curves, indicating the capacitance of GR/V2O5 NSP is mainly dominated by the redox mechanism. In addition, it can be seen clearly from Fig. 5a that the redox peaks of each CV curve keep explicit and symmetric as the sweep rates increase from 5 to 100 mV s−1, suggesting the perfect electrochemical reversibility.43 As shown in Fig. 5b, the GCD curves at various current densities exhibit symmetrical distribution, implying the high coulombic efficiency for the sample during consecutive charge/discharge process. Utilizing the discharge curves, the specific capacitance of GR/V2O5 NSP electrode as a function of current density is 580, 517, 453.3, 378, and 327.5 F g−1, at current densities of 0.5, 1, 2.5, 5, and 10 A g−1, respectively (Fig. 5c). Notably, with the augment of current density up to 10 A g−1, GR/V2O5 NSP electrode can still deliver a high capacitance retention (56%), compared with 35% (180 F g−1) for the pure V2O5 NSP (Fig. 5c), which sufficiently proves the superior rate capability of GR/V2O5 NSP. The enhanced electrochemical performance of GR/V2O5 NSP may be attributed to the interconnected electrical conductive network consisting of GR and synergistic effect between GR and V2O5 nanospheres. The EIS tests were carried out to further understand their capacitive behaviors. As shown in Fig. 5d, differing from the pure V2O5 nanospheres, the semicircle in high-frequency range is very small and the deviation in the slope of the line in low-frequency range is close to the 90° phase angle, manifesting the good conductivity and excellent operation rate of the GR/V2O5 NSP as the electrode material. Inset of Fig. 5d is the magnified area of the high frequency portion, from which the charge transfer resistance (Rct) of the pure V2O5 NSP electrode can be obtained as 1.8 Ω, whereas that of the composite material electrode is only 1.1 Ω, which further confirms its good electrochemical performance. Both GR/VN NSP and GR/V2O5 NSP composite electrode materials exhibit the good electrochemical performance, especially high specific capacitances. This is mainly attributed to the combination of redox capacitance from pseudocapacitive species (V2O5 and VN) and electric double layer capacitance (EDLC) from graphene in the composite electrode materials. Furthermore, the porous network constructed by graphene nanosheets also expedites efficient charge transport for V2O5 and VN.
3.4 Hybrid supercapacitor based on GR/VN NSP and GR/V2O5 NSP
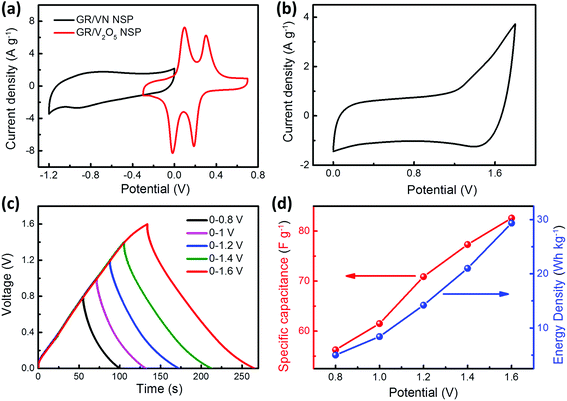
The hybrid supercapacitor using the GR/V2O5 NSP and GR/VN NSP as the positive electrode and negative electrode, respectively, was assembled as shown in Fig. 1 to further evaluate the practical application of the two samples. To assess the best total voltage of HSCs, CV curves were used to evaluate the applicable operation voltage window (OVW) at low sweep rate of 5 mV s−1, as shown in Fig. 6a. Utilizing the complementary potential windows ranges of GR/VN NSP and GR/V2O5 NSP (Fig. 6a), it is anticipated that the OVW for the assemble HSCs can reach 1.9 V. But in CV testing process, the obvious polarization derived from oxygen evolution reactions is occurring in Fig. 6b when the OVW is over 1.7 V. Thus, the maximum OVW for the HSCs based on GR/VN NSP and GR/V2O5 NSP should be 0–1.6 V. Fig. S5 (ESI†) shows the CV profiles of the GR/VN NSP//GR/V2O5 NSP HSCs at a sweep rate of 15 mV s−1 in different potential windows. When OVW is located at 1 V, a triangular CV curve implies an incomplete pseudocapacitive response from the HSCs. By increasing the OVW to 1.2 V, a pair of redox humps appears in the CV curves, showing the pseudocapacitive properties. Furthermore, at a high potential window up to 1.6 V, some distinct redox peaks arise in the CV curves, indicating deeper redox reactions on the surface of both electrode materials. As expected, the charge–discharge curves of the HSCs at current density of 1 A g−1 are still nearly symmetric at an operating potential as high as 1.6 V (Fig. 6c), indicating that the device exhibits ideal capacitive characteristics with a rapid I–V response and low equivalent series resistance. In addition, there is no significant change in internal resistance (from IR drop) as shown in Fig. S6 (ESI†), which confirms the low equivalent series resistance of the HSCs. Fig. 6d shows the specific capacitance of the HSCs based on galvanostatic charge–discharge curves collected at 1 A g−1 as a function of the potential window. It is worth mentioning that the calculated specific capacitance significantly increased from 55 to 83 F g−1 when voltage windows were extended from 0.8 to 1.6 V. Accordingly, the energy density of the HSCs is also greatly improved from 5 to 29.35 W h kg−1, an enhancement of more than 487%.Fig. 7a presents CV curves of the HSCs at different sweep rates ranging from 10 to 100 mV s−1 between 0 and 1.6 V. Each curve exhibits symmetric and same shape without shape distortion, even at a high sweep rate, illustrating the desirable rapid charge/discharge property as a result of the effective electronic/ionic transmission of the electrode materials. To further evaluate the performance of the HSCs, we measured GCD curves at various current densities from 0.5 to 10 A g−1, as shown in Fig. 7b. These linear shape discharge curves again confirm the excellent capacitive and good reaction reversibility of the HSCs, which is in congruent with CV analysis. The specific capacitances of the HSCs calculated based on the GCD curves are plotted as a function of the current density in Fig. 7C. The HSCs can deliver a high specific capacitance of 99 F g−1 at a current density of 0.5 A g−1, and the capacitance retention is about 69% (68.3 F g−1) with a twentyfold increase in the current density (Fig. 7c), indicating the sufficient redox reactions resulted from rapid ion diffusion even at high current densities. Meanwhile, the specific capacitance calculated based on the integral formula of CV curves also confirms the good kinetic performance. Based on the total mass of the active materials (Fig. 7a), the constructed HSC delivers a specific capacitance as high as 84.3 F g−1 at low sweep rate of 10 mV s−1, and can still keep about 50% of original specific capacitance even at high sweep rate of 100 mV s−1. To ascertain the durability for practical applications, the long-term cycling stability of the GR/VN//GN/V2O5 HSCs at a current density of 10 A g−1 is presented in Fig. 7d. Impressively, only 4.2% capacitance attenuation is observed during the early 3000 cycles, and it still keeps 90% of its original specific capacitance even after 7000 cycles. The morphologies of the electrode materials after cycling are given in Fig. S7 (ESI†). It can clearly see that there is no obvious change in the nanosphere morphology which is uniformly wrapped by crumpled graphene nanosheets after cycling. This result is mainly due to the good structural stability of our as-prepared electrode material. In addition, energy and power density are important parameters for evaluating the performance of energy-storage devices. The Ragone plots in Fig. 7e compare the performance of our HSCs to those of previously reported HSCs based on vanadium-based electrode materials with aqueous electrolyte. An energy density as high as 35.2 W h kg−1 can be achieved at a power density of 0.4 kW kg−1, and an energy density of 24.15 W h kg−1 is maintained even at a high power density of 8 kW kg−1. These values compare favorably to those of vanadium-based materials, such as the urchin-like VN (22 W h kg−1, 0.16 kW kg−1) and V2O5 nanoribbons (29 W h kg−1, 0.085 kW kg−1). The inset image in Fig. 7e further compares the specific capacitance of the corresponding materials and the as-prepared HSCs represent the highest specific capacitance at the same current density (1 A g−1). As concluded in Fig. 7f, the high performance of our HSCs is due to: (1) highly conductive GR wrapping on the surface of VN or V2O5 nanospheres, which not only enhances the electronic conductivity of the both electrodes but also suppresses electrochemical oxidation and dissolution of the VN; (2) the interpenetrating porous network structure consisting of intimately intertwined GR, which provides effective electron and electrolyte transport with more available active-sites; and (3) synergistic effect between pseudo-capacitive positive (GR/V2O5 NSP) and negative (GR/VN NSP) electrode materials with high specific capacitance values, which increases specific capacitance of the HSCs.
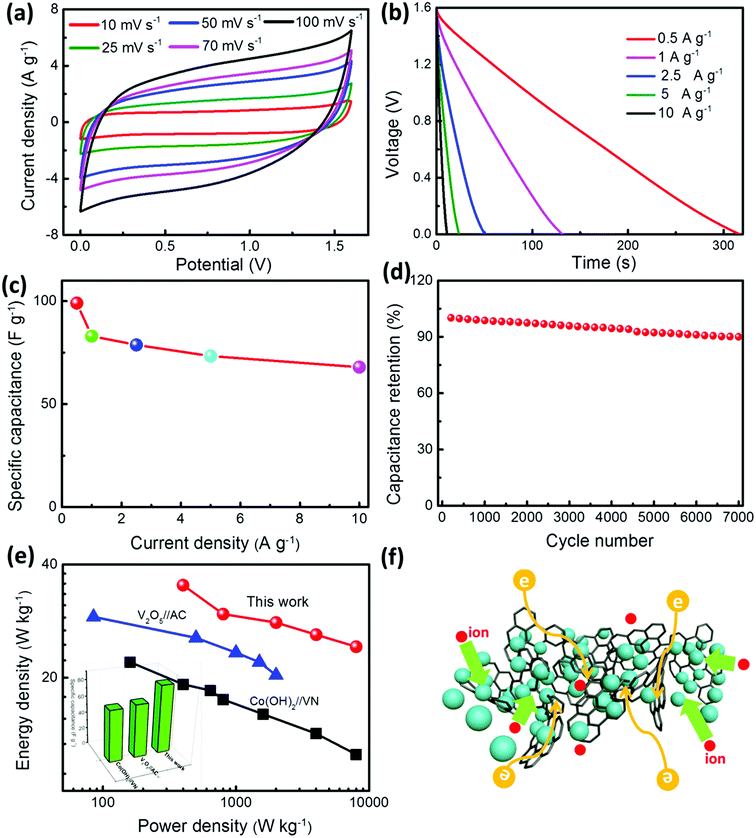 | ||
| Fig. 7 (a) CV curves of the as-fabricated HSCs measured at different sweep rates from 0 to 1.6 V. (b) Galvanostatic discharge curves collected at different current densities. (c) Specific capacitance calculated from discharge curves as a function of the current density. (d) Cycling performance at a constant current density of 10 A g−1. (e) Ragone plots of our HSCs in comparison with previously reported HSCs based on vanadium-based electrode materials with aqueous electrolyte (blue plots,44 black plots,16), inset image is the corresponding specific capacitance of these HSCs calculated from discharge curves at current density of 1 A g−1. (f) Schematic of intimate between the VN or V2O5 nanospheres and graphene facilitating rapid charge and electrolyte transport. | ||
4. Conclusion
To conclude, based on a facile strategy, a graphene oxide (GO)-wrapped VOx nanosphere (GO-wrapped VOx NSP) precursor has been fabricated via a one-step solvothermal method, and through different thermal treatments it can be steadily transformed to GR/VN NSP and GR/V2O5 NSP, suitable for both electrodes in HSCs. The conformally wrapped GR has a significant influence on the electrochemical performance of VN and V2O5, derived from the simultaneous improvements in electronic conductivity, structural stability, and electrolyte transport. Benefitting from these merits, the as-prepared GR/VN NSP and GR/V2O5 NSP exhibit excellent electrochemical performance for HSCs with high specific capacitance (83 F g−1) and good-long cycle life (90% specific capacitance retained after 7000 cycles). Furthermore, GR/VN NSP//GR/V2O5 NSP HSCs can deliver a high energy density of 35.2 W h kg−1 at 0.4 W kg−1 and maintains about 70% even at a high power density of 8 kW kg−1. The facile strategy of fabricating negative and positive electrode materials derived from a single precursor can be extended to other functional materials for different integrated devices and the impressive results presented here show great potential in vanadium-based electrode materials for promising applications in the high performance energy storage systems.Conflicts of interest
The authors declare no competing financial interest.Acknowledgements
The authors acknowledge the support of the National Natural Science Foundation of China (Granted No. U1503292, No. 51472182), the Fundamental Research Funds for the Central Universities, and the National Key Research and Development Program of China (Granted No. 2017YFA0204600).References
- D. Larcher and J. M. Tarascon, Nat. Chem., 2015, 7, 19–29 CrossRef PubMed.
- P. Simon, Y. Gogotsi and B. Dunn, Science, 2014, 343, 1210–1211 CrossRef PubMed.
- M. Zhi, C. Xiang, J. Li, M. Li and N. Wu, Nanoscale, 2013, 5, 72–88 RSC.
- G. Wang, L. Zhang and J. Zhang, Chem. Soc. Rev., 2012, 41, 797–828 RSC.
- Y. Gogotsi and P. Simon, Science, 2011, 334, 917–918 CrossRef PubMed.
- L. Yu, B. Guan, W. Xiao and X. W. Lou, Adv. Energy Mater., 2015, 5, 1500981 CrossRef.
- P. Simon and Y. Gogotsi, Nat. Mater., 2008, 7, 845–854 CrossRef PubMed.
- D. P. Dubal, O. Ayyad, V. Ruiz and P. Gómez-Romero, Chem. Soc. Rev., 2015, 44, 1777–1790 RSC.
- H. Xia, C. Hong, X. Shi, B. Li, G. Yuan, Q. Yao and J. Xie, J. Mater. Chem. A, 2015, 3, 1216–1221 RSC.
- N. Jabeen, A. Hussain, Q. Xia, S. Sun, J. Zhu and H. Xia, Adv. Mater., 2017, 29, 1700804 CrossRef PubMed.
- G. Saeed, S. Kumar, N. H. Kim and J. H. Lee, Chem. Eng. J., 2018, 352, 268–276 CrossRef.
- Y. Cheng, H. Zhang, S. Lu, C. V. Varanasi and J. Liu, Nanoscale, 2013, 5, 1067–1073 RSC.
- H. Kim, M. Y. Cho, M. H. Kim, K. Y. Park, H. Gwon, Y. Lee, K. C. Roh and K. Kang, Adv. Energy Mater., 2013, 3, 1500–1506 CrossRef.
- L. Huang, B. Yao, J. Sun, X. Gao, J. Wu, J. Wan, T. Li, Z. Hu and J. Zhou, J. Mater. Chem. A, 2017, 5, 2897–2903 RSC.
- L. Wang, H. Yang, X. Liu, R. Zeng, M. Li, Y. Huang and X. Hu, Angew. Chem., 2017, 129, 1125–1130 CrossRef.
- S. Kumar, G. Saeed, N. H. Kim and J. H. Lee, J. Mater. Chem. A, 2018, 6, 7182–7193 RSC.
- T. Zhai, X. Lu, Y. Ling, M. Yu, G. Wang, T. Liu, C. Liang, Y. Tong and Y. Li, Adv. Mater., 2014, 26, 5869–5875 CrossRef PubMed.
- S. Sun, T. Zhai, C. Liang, S. V. Savilov and H. Xia, Nano Energy, 2018, 45, 390–397 CrossRef.
- S. S. Raut and B. R. Sankapal, New J. Chem., 2016, 40, 2619–2627 RSC.
- R. Wang, X. Yan, J. Lang, Z. Zheng and P. Zhang, J. Mater. Chem. A, 2014, 2, 12724–12732 RSC.
- R. Wang, J. Lang, P. Zhang, Z. Lin and X. Yan, Adv. Funct. Mater., 2015, 25, 2270–2278 CrossRef.
- Y. Yang, K. Shen, Y. Liu, Y. Tan, X. Zhao, J. Wu, X. Niu and F. Ran, Nano-Micro Lett., 2017, 9, 6 CrossRef.
- J. Balamurugan, G. Karthikeyan, T. Thanh, N. Kim and J. Lee, J. Power Sources, 2016, 308, 149–157 CrossRef.
- X. Lu, M. Yu, T. Zhai, G. Wang, S. Xie, T. Liu, C. Liang, Y. Tong and Y. Li, Nano Lett., 2013, 13, 2628–2633 CrossRef PubMed.
- C. M. Ghimbeu, E. Raymundo-Piñero, P. Fioux, F. Beguin and C. Vix-Guterl, J. Mater. Chem., 2011, 21, 13268–13275 RSC.
- L. Zhang, C. Holt, E. Luber, B. Olsen, H. Wang, M. Danaie, X. Cui, X. Tan, V. Lui, W. Kalisvaart and D. Mitlin, J. Phys. Chem. C, 2011, 115, 24381–24393 CrossRef.
- Q. Zhang, X. Wang, Z. Pan, J. Sun, J. Zhao, J. Zhang, C. Zhang, L. Tang, J. Luo, B. Song, Z. Zhang, W. Lu, Q. Li, Y. Zhang and Y. Yao, Nano Lett., 2017, 17, 2719–2726 CrossRef PubMed.
- B. Yan, X. Li, Z. Bai, Y. Zhao, L. Dong, X. Song, D. Li, C. Langford and X. Sun, Nano Energy, 2006, 24, 32–44 CrossRef.
- Y. Wu, G. Gao, H. Yang, W. Bi, X. Liang, Y. Zhang, G. Zhang and G. Wu, J. Mater. Chem. A, 2015, 3, 15692–15699 RSC.
- W. Sun, A. Du, B. Zhou, J. Shen, S. Huang and J. Tang, J. Sol-Gel Sci. Technol., 2016, 80, 68–76 CrossRef.
- W. Sun, A. Du, G. Gao, J. Shen and G. Wu, Microporous Mesoporous Mater., 2017, 253, 71–79 CrossRef.
- Y. Wu, G. Gao and G. Wu, J. Mater. Chem. A, 2015, 3, 1828–1832 RSC.
- X. Xiao, X. Peng, H. Jin, T. Li, C. Zhang, B. Gao, B. Hu, K. Huo and J. Zhou, Adv. Mater., 2013, 25, 5091–5097 CrossRef PubMed.
- M. Cakici, R. R. Kakarla and F. Alonso-Marroquin, Chem. Eng. J., 2017, 309, 151–158 CrossRef.
- V. Augustyn, J. Come, M. A. Lowe, J. Kim, P. L. Taberna, S. H. Tolbert, H. D. Abruna, P. Simon and B. Dunn, Nat. Mater., 2013, 12, 518–522 CrossRef PubMed.
- A. Jayakumar, R. P. Antony, R. Wang and J. M. Lee, Small, 2017, 13, 1603102 CrossRef PubMed.
- T. Brousse, D. Bélanger and J. W. Long, J. Electrochem. Soc., 2015, 162, A5185–A5189 CrossRef.
- B. Li, F. Dai, Q. Xiao, L. Yang, J. Shen, C. Zhang and M. Cai, Energy Environ. Sci., 2016, 9, 102–106 RSC.
- G. Godillot, P. L. Taberna, B. Daffos, P. Simon, C. Delmas and L. Guerlou-Demourgues, J. Power Sources, 2016, 331, 277–284 CrossRef.
- W. Jiang, D. Yu, Q. Zhang, K. Goh, L. Wei, Y. Yong, R. Jiang, J. Wei and Y. Chen, Adv. Funct. Mater., 2015, 25, 1063–1073 CrossRef.
- A. M. Glushenkov, D. Hulicova-Jurcakova, D. Llewellyn, G. Q. Lu and Y. Chen, Chem. Mater., 2010, 22, 914–921 CrossRef.
- D. Choi, G. E. Blomgren and P. N. Kumta, Adv. Mater., 2006, 18, 1178–1182 CrossRef.
- M. Li, G. Sun, P. Yin, C. Ruan and K. Ai, ACS Appl. Mater. Interfaces, 2013, 5, 11462–11470 CrossRef PubMed.
- Q. T. Qu, Y. Shi, L. L. Li, W. L. Guo, Y. P. Wu, H. P. Zhang, S. Y. Guan and R. Holze, Electrochem. Commun., 2009, 11, 1325–1328 CrossRef.
Footnote |
| † Electronic supplementary information (ESI) available. See DOI: 10.1039/c8ra05298k |
| This journal is © The Royal Society of Chemistry 2018 |

