 Open Access Article
Selective adsorption and decomposition of pollutants using RGO-TiO2 with optimized surface functional groups†
Yunfei Sun *a,
Yanfeng Heb,
Bo Tang
 *b,
Zhengtian Wua,
Chongben Taoa,
Jianmin Bana,
Li Jianga and
Xiaohong Suna
aCollege of Electronic and Information Engineering, Suzhou University of Science and Technology, Suzhou, Jiangsu 215009, People's Republic of China. E-mail: yunfeisun_usts@126.com
bSchool of Petroleum Engineering, Changzhou University, Changzhou 213016, People's Republic of China. E-mail: tangbo@cczu.edu.cn
First published on 14th September 2018
Abstract
Reduced graphene oxide (RGO) samples with optimized types of surface functional groups were hybridized with TiO2 to achieve the selective adsorption and removal of various pollutants. A high ratio of hydroxyl groups was found to be remarkably advantageous for the adsorbtion and decomposition of rhodamine-B (and similar pollutants), while a high ratio of carboxyl groups was found to promote the ability to adsorb and decompose phenol. Moreover, the presence of carboxyl groups on the RGO edge provides a pre-condition to form a close chemical connection with TiO2, which has been proven by the obtained electron paramagnetic resonance (EPR) curve, infrared spectroscopy (IR) and electron lifetime. The resulting composite photocatalysts display excellent photocatalytic activities under both UV- and visible-light illumination, indicating that the well-designed surface micro-circumstances of the RGO are quite significant.
Introduction
Graphene assisted TiO2 composite photocatalysts have attracted increasing attention because of their significantly enhanced performances compared with those of the bare semiconductors.1–7 Based on previous reports, the advantages of adopting graphene as a modifier can be detailed by the following four points.4 Firstly, the large theoretical Brunauer–Emmett–Teller (BET) area of graphene makes this two-dimensional material a promising additive to enhance the absorption of pollutants, and also improves the corresponding decomposition rate constant. Secondly, graphene is deemed to act as a fast transport channel for photo-induced electrons to depress the recombination of electron–hole pairs in the TiO2 because of its outstanding intrinsic electrical properties.8 Thirdly, the semimetal property of graphene endows it as a perfect sensitizer to provide a visible-light activity for the resulting composite photocatalysts.9 Lastly, the combination of graphene and traditional semiconductor materials is convenient, and the hydrothermal method is widely employed to achieve the hybridization.8,9 In the past decade, some research on graphene assisted TiO2 composite photocatalysts has been carried out, and the significant studies have been reviewed.6 Zhang et al. studied the photocatalytic performance of a reduced graphene oxide (RGO)-TiO2 photocatalyst under UV- and visible-light illumination. The authors found that the corresponding photocatalytic mechanism was similar to that of other carbon material assisted TiO2 composite photocatalysts.1 Chen et al. fabricated visible-light responsive graphene oxide (GO)-TiO2 photocatalysts and suggested that the GO acts as a sensitizer in the composite.2 Although the resulting photocatalytic performances of these composites were much higher than that of the pure TiO2, the obtained decomposition rate constants are still much lower than those predicted.In order to further improve the photocatalytic activities of the graphene-TiO2 photocatalysts, some optimizations have been made. Zhai et al. adopted titanate nanotubes to replace TiO2 nanoparticles to combine with the RGO, and the BET area increased by approximately ten times (400 m2 g−1), which gave a better adsorption ability to the resulting photocatalysts.10 Our group made some attempts to optimize the quality of the adopted graphene to improve the separation ability of the photo-induced electron–hole pairs.9 First of all, high quality three-dimensional graphene networks (3DGNs) prepared by the chemical vapor deposition method were adopted as the modifier to reduce the recombination centers (defects) of the electron–hole pairs. 3DGNs are superior not only due to the low defect density but also their large BET area (>600 m2 g−1). However, the resulting photocatalytic performances were much lower than the predicted results (comparable with that of the RGO modified samples). After careful analysis, Hu's group and our group found that the poor wettability between the graphene basal plane and TiO2 leads to a degraded performance as a result of a high Schottky barrier at the interface which resists the transport of photo-generated electrons.3 Most recently, we found that the defects on the surface of the 3DGNs can play the part of a bridge to promote electron transport at the interface.5 Considering the balance between good wettability and the high intrinsic electrical properties, the defect density of the 3DGNs must be accurately designed.11 However, the control process for a limited defect density is rather complex, and a strict gas flow amount and severe cool rate are needed.5,11 Therefore, the mass manufacture of 3DGNs-TiO2 is difficult.
In contrast, for the RGO-TiO2 composite photocatalysts, a close contact between the graphene basal plane and the TiO2 nanoparticles can be achieved easily through the surface functional groups of the RGO, which has been proven by previous reports.8,12 Moreover, the total amount of functional groups can be controlled facilely by adjusting the reduction agent and time. However, the type of functional group (hydroxyl, carboxyl and epoxy groups) plays a vital role in enhancing the interface contact, which is not yet fully understood. With the development of a RGO preparation technique, a high-quality sample with a large BET area and a designed morphology can be achieved.8 Therefore, making a further improvement to the electron transport at the interface between the RGO and TiO2 to improve the resulting photocatalytic performances of the composite photocatalysts has promising prospects for practical applications.
In this study, the RGO samples with an optimized total amount and selected type of surface functional groups were prepared and adopted as the modifier for composite photocatalysts. The effects of each functional group in the adsorption and decomposition of various pollutants are revealed, and are proven by electron paramagnetic resonance (EPR), the decomposition rate constant and adsorption experiments. The results indicate that the selected adsorption and decomposition of specific pollutants can be achieved by optimizing the adopted RGO. Moreover, the interface contact (chemical bond strength) between the graphene basal plane and TiO2 is closely related to the functional group type, which determines the photo-generated electron transport ability at the interface, as well as the photocatalytic performance. Lastly, the resulting photocatalysts display satisfactory stabilities for high photocatalytic performances under both UV- and visible-light irradiation.
Results and discussion
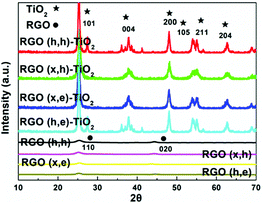
SEM images of the composite photocatalysts based on various RGO samples are shown in Fig. 1, and all of the specimens display similar appearances. The uniformly distributed TiO2 nanoparticles can be observed from the RGO (h, e)-TiO2 rather than from other specimens, implying that the aggregation behavior of TiO2 is closely related to the adopted RGO (the major difference is the functional groups). X-ray diffraction (XRD) curves of the RGO samples and as-prepared composite photocatalysts are listed in Fig. 2. The fingerprint peaks belonging to TiO2 are labeled in the patterns, while the corresponding signals from the RGO cannot be seen from the composite photocatalysts, which is in line with previous reports.13,14 This interesting phenomenon can be explained by the small average size and discontinuous periodic structure of the graphene basal plane in the RGO. Raman spectroscopy was utilized to further detect the distinctions between these adopted RGO samples. As a nondestructive tool, Raman spectroscopy is a powerful method to obtain the thickness, average size and defect density of graphite-like materials (based on the features of the G, D and 2D bands). Therefore, the value of ID/IG is directly proportional to the defect density of the graphene samples (Table 1, Fig. S1, ESI†).15,16 Two kinds of defects appear in the RGO samples, structural defects (carbon atom vacancy) and surface functional groups. XPS can be used to obtain the ratios of carbon atoms in various chemical states. Based on our recent study, the reduction degrees and proportions of various functional groups of these adopted RGO samples were abstracted (the values of mC![[thin space (1/6-em)]](https://www.rsc.org/images/entities/char_2009.gif) :
:![[thin space (1/6-em)]](https://www.rsc.org/images/entities/char_2009.gif) mO and melement
mO and melement![[thin space (1/6-em)]](https://www.rsc.org/images/entities/char_2009.gif) :
:![[thin space (1/6-em)]](https://www.rsc.org/images/entities/char_2009.gif) mfunctional were used as the criteria, Table 1) using XPS (Fig. S2, ESI†), which is in agreement with the Raman results (ID/IG).17 The corresponding XPS curves of the TiO2 are supplied in the ESI (Fig. S2,† only Ti and O atoms are contained in the TiO2), and all of the C–OH, C–OOH and C
mfunctional were used as the criteria, Table 1) using XPS (Fig. S2, ESI†), which is in agreement with the Raman results (ID/IG).17 The corresponding XPS curves of the TiO2 are supplied in the ESI (Fig. S2,† only Ti and O atoms are contained in the TiO2), and all of the C–OH, C–OOH and C![[double bond, length as m-dash]](https://www.rsc.org/images/entities/char_e001.gif) O functional groups result from the RGO modifier.
O functional groups result from the RGO modifier.
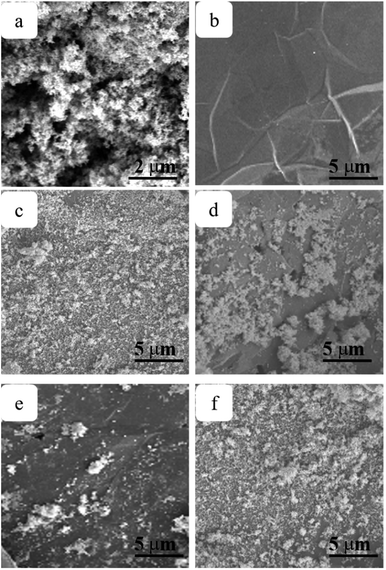 | ||
| Fig. 1 SEM images of (a) TiO2 (b) GO (c) RGO (h, e)-TiO2 (d) RGO (x, h)-TiO2 (e) RGO (h, h)-TiO2 and (f) RGO (x, e)-TiO2. | ||
| Samples | Parameters | |||
|---|---|---|---|---|
| mC/mO | Celement/Cfunctional | Celement![[thin space (1/6-em)]](https://www.rsc.org/images/entities/char_2009.gif) : :![[thin space (1/6-em)]](https://www.rsc.org/images/entities/char_2009.gif) Chydroxyl Chydroxyl![[thin space (1/6-em)]](https://www.rsc.org/images/entities/char_2009.gif) : :![[thin space (1/6-em)]](https://www.rsc.org/images/entities/char_2009.gif) Cepoxy Cepoxy![[thin space (1/6-em)]](https://www.rsc.org/images/entities/char_2009.gif) : :![[thin space (1/6-em)]](https://www.rsc.org/images/entities/char_2009.gif) Ccarboxyl Ccarboxyl |
ID/IG | |
| RGO (h, e) | 1.19![[thin space (1/6-em)]](https://www.rsc.org/images/entities/char_2009.gif) : :![[thin space (1/6-em)]](https://www.rsc.org/images/entities/char_2009.gif) 1 1 |
1.94![[thin space (1/6-em)]](https://www.rsc.org/images/entities/char_2009.gif) : :![[thin space (1/6-em)]](https://www.rsc.org/images/entities/char_2009.gif) 1 1 |
66![[thin space (1/6-em)]](https://www.rsc.org/images/entities/char_2009.gif) : :![[thin space (1/6-em)]](https://www.rsc.org/images/entities/char_2009.gif) 5 5![[thin space (1/6-em)]](https://www.rsc.org/images/entities/char_2009.gif) : :![[thin space (1/6-em)]](https://www.rsc.org/images/entities/char_2009.gif) 0 0![[thin space (1/6-em)]](https://www.rsc.org/images/entities/char_2009.gif) : :![[thin space (1/6-em)]](https://www.rsc.org/images/entities/char_2009.gif) 29 29 |
0.412 |
| RGO (h, e)–OOH | 1.07![[thin space (1/6-em)]](https://www.rsc.org/images/entities/char_2009.gif) : :![[thin space (1/6-em)]](https://www.rsc.org/images/entities/char_2009.gif) 1 1 |
1.86![[thin space (1/6-em)]](https://www.rsc.org/images/entities/char_2009.gif) : :![[thin space (1/6-em)]](https://www.rsc.org/images/entities/char_2009.gif) 1 1 |
65![[thin space (1/6-em)]](https://www.rsc.org/images/entities/char_2009.gif) : :![[thin space (1/6-em)]](https://www.rsc.org/images/entities/char_2009.gif) 0 0![[thin space (1/6-em)]](https://www.rsc.org/images/entities/char_2009.gif) : :![[thin space (1/6-em)]](https://www.rsc.org/images/entities/char_2009.gif) 0 0![[thin space (1/6-em)]](https://www.rsc.org/images/entities/char_2009.gif) : :![[thin space (1/6-em)]](https://www.rsc.org/images/entities/char_2009.gif) 35 35 |
0.405 |
| RGO (h, h) | 5.77![[thin space (1/6-em)]](https://www.rsc.org/images/entities/char_2009.gif) : :![[thin space (1/6-em)]](https://www.rsc.org/images/entities/char_2009.gif) 1 1 |
11.5![[thin space (1/6-em)]](https://www.rsc.org/images/entities/char_2009.gif) : :![[thin space (1/6-em)]](https://www.rsc.org/images/entities/char_2009.gif) 1 1 |
92![[thin space (1/6-em)]](https://www.rsc.org/images/entities/char_2009.gif) : :![[thin space (1/6-em)]](https://www.rsc.org/images/entities/char_2009.gif) 2 2![[thin space (1/6-em)]](https://www.rsc.org/images/entities/char_2009.gif) : :![[thin space (1/6-em)]](https://www.rsc.org/images/entities/char_2009.gif) 1 1![[thin space (1/6-em)]](https://www.rsc.org/images/entities/char_2009.gif) : :![[thin space (1/6-em)]](https://www.rsc.org/images/entities/char_2009.gif) 5 5 |
0.306 |
| RGO (x, e) | 1.59![[thin space (1/6-em)]](https://www.rsc.org/images/entities/char_2009.gif) : :![[thin space (1/6-em)]](https://www.rsc.org/images/entities/char_2009.gif) 1 1 |
1.63![[thin space (1/6-em)]](https://www.rsc.org/images/entities/char_2009.gif) : :![[thin space (1/6-em)]](https://www.rsc.org/images/entities/char_2009.gif) 1 1 |
62![[thin space (1/6-em)]](https://www.rsc.org/images/entities/char_2009.gif) : :![[thin space (1/6-em)]](https://www.rsc.org/images/entities/char_2009.gif) 28 28![[thin space (1/6-em)]](https://www.rsc.org/images/entities/char_2009.gif) : :![[thin space (1/6-em)]](https://www.rsc.org/images/entities/char_2009.gif) 1 1![[thin space (1/6-em)]](https://www.rsc.org/images/entities/char_2009.gif) : :![[thin space (1/6-em)]](https://www.rsc.org/images/entities/char_2009.gif) 9 9 |
0.382 |
| RGO (x, h) | 9.38![[thin space (1/6-em)]](https://www.rsc.org/images/entities/char_2009.gif) : :![[thin space (1/6-em)]](https://www.rsc.org/images/entities/char_2009.gif) 1 1 |
15.7![[thin space (1/6-em)]](https://www.rsc.org/images/entities/char_2009.gif) : :![[thin space (1/6-em)]](https://www.rsc.org/images/entities/char_2009.gif) 1 1 |
94![[thin space (1/6-em)]](https://www.rsc.org/images/entities/char_2009.gif) : :![[thin space (1/6-em)]](https://www.rsc.org/images/entities/char_2009.gif) 4 4![[thin space (1/6-em)]](https://www.rsc.org/images/entities/char_2009.gif) : :![[thin space (1/6-em)]](https://www.rsc.org/images/entities/char_2009.gif) 0 0![[thin space (1/6-em)]](https://www.rsc.org/images/entities/char_2009.gif) : :![[thin space (1/6-em)]](https://www.rsc.org/images/entities/char_2009.gif) 2 2 |
0.258 |
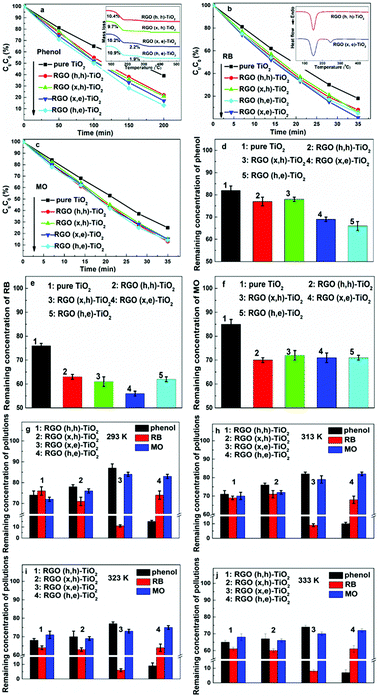
The photocatalytic abilities of these composites are estimated by the decomposition of Rhodamine-B (RB), methyl orange (MO) and phenol, and the resulting performances are shown in the Fig. 3a–c (UV-light illumination, which are much better than those obtained from pure TiO2). As can be seen, the corresponding photocatalytic performances display remarkable distinctions, although the mass fractions and reduction degrees of these employed RGO are identical. Moreover, the specific photocatalytic activities are dependent on the adopted pollutant. The above phenomena indicate that the type of functional groups present on the RGO are closely related to the resulting photocatalytic performances. In other words, the selective decomposition of pollutants can be achieved by adjusting the type of functional groups. In this study, the superior photocatalytic performance could be due to two possible reasons: an enhanced adsorption ability and a depressed recombination ratio of the electron–hole pairs. The TGA curves of these as-prepared composite photocatalysts are shown in the inset of Fig. 3a, and similar weight loss stages can be seen from the RGO (h, e) and RGO (x, e) assisted samples (the mass fractions of all of the RGO modifiers are identical, 5 wt%). The first significant stage ranging from 100–180 °C is caused by the evaporation of the adsorbed water on the surface (∼10 wt%), while the second weight loss stage located at 240–290 °C is attributed to the removal of the residual functional groups from the RGO modifier (∼2 wt%). On the contrary, this stage almost disappears from the curves of the RGO (h, h) and RGO (x, h) modified specimens, confirming that the majority of the functional groups on them have been removed by using hydrazine, which is in line with the XPS results. Furthermore, the differential scanning calorimetry (DSC) curves of the composite photocatalysts are displayed in the inset of Fig. 3b, and the corresponding signal peaks coincide with the results of the TGA curves. As for the adsorption abilities, the residual amounts of various pollutants after using the as-prepared photocatalysts are shown in Fig. 3d–f, and the selective adsorption based on the specific structures of the pollutants and functional groups types of the RGO can be abstracted (the error bars are marked). The RGO (h, e)-TiO2 and RGO (x, e)-TiO2 display better adsorption abilities compared to that of the RGO (h, h)-TiO2 and RGO (x, h)-TiO2 when the phenol is used as the adsorbate. Similarly, when RB is utilized, the RGO (x, e)-TiO2 and RGO (h, e)-TiO2 show better adsorption abilities. However, the order changes from RGO (h, e)-TiO2 > RGO (x, e)-TiO2 > RGO (h, h)-TiO2 > RGO (x, h)-TiO2 for adsorbing phenol, to RGO (x, e)-TiO2 > RGO (h, e)-TiO2 > RGO (x, h)-TiO2 > RGO (h, h)-TiO2 for adsorbing RB. Moreover, all of the photocatalysts display similar adsorption abilities for the MO. It is reasonable to explain these results when the chemical structures of these pollutants are taken into account. Phenol molecules contain a hydroxyl group, therefore, an enhanced adsorption ability can be observed when the photocatalyst has more carboxyl groups (RGO (h, e) possesses the most carboxyl groups among all the samples, Table 1). In order to confirm this point, the hydroxy groups of the RGO sample were translated into carboxyl groups, and the adsorption ability was enhanced further (named RGO (h, e)–OOH, Table 1). The presence of the carboxyl group in the RB molecular leads to a better adsorption performance from the RGO (x, e)-TiO2 specimen which possesses the most hydroxyl groups (the schematic diagram is shown in Fig. 4). All of the photocatalysts display similar adsorption abilities for the MO because no hydroxyl or carboxyl groups were contained in the pollutant. Therefore, these photocatalysts display similar adsorption abilities due to their similar BET areas (Table 2). In order to further prove the selective adsorption of the composite photocatalysts, a mixed aqueous solution containing various pollutants was used as the adsorbate. The mixed solution includes phenol (15 mL phenol solution, 60 mg L−1), RB (15 mL RB solution, 10 mg L−1) and MO (20 mL MO solution, 10 mg L−1), and the corresponding residual amounts of various pollutants after the adsorption equilibrium are shown in Fig. 3g. By using the RGO (h, h) and RGO (x, h) assisted samples, the residual concentrations of the various pollutants are similar. On the other hand, the concentration changes to the phenol (RB) are more remarkable than those of the MO for the RGO (h, e) (RGO (x, e)) based photocatalyst, indicating the prior adsorption of pollutants that possess hydroxyl (carboxyl) groups. By carefully comparing the residual amounts of various pollutants, the phenol and RB were determined to be the favored adsorbates for the RGO (h, e)-TiO2 and RGO (x, e)-TiO2, respectively. These obtained results manifest that designating the type of functional groups for the RGO (x, e) and RGO (h, e) modifiers imposes a significant influence on the adsorption order of various adsorbates, confirming the selective adsorption of the as-prepared composite photocatalysts. Moreover, the influence of temperature on the resulting adsorption abilities are revealed (Fig. 3h–j). Although a relatively high temperature promotes the diffusion rate of the dye molecules and reduces the adsorption barrier, the heating process leads to a high cost.
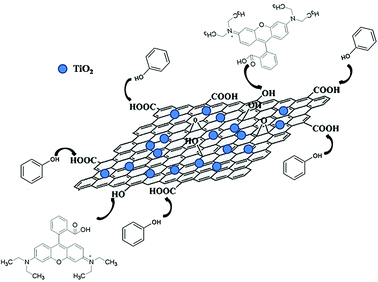 | ||
| Fig. 4 Schematic diagram of the adsorption process of the composite photocatalysts for phenol and RB. | ||
| Samples | Parameters | ||||||
|---|---|---|---|---|---|---|---|
| BET area (m2 g−1) | Decomposition rate constant (× 10−3 min−1) | ||||||
| UV-light irradiation | Visible-light irradiation | ||||||
| RB | phenol | MO | RB | phenol | MO | ||
| Pure TiO2 | 51.447 | 48.9 | 4.71 | 39.6 | ∼0 | ∼0 | ∼0 |
| RGO (h, h)-TiO2 | 108.268 | 72.2 | 7.57 | 57.3 | 44.6 | 3.67 | 26.2 |
| RGO (x, h)-TiO2 | 114.732 | 80.4 | 7.80 | 54.2 | 48.9 | 4.34 | 28.4 |
| RGO (x, e)-TiO2 | 116.719 | 132 | 8.86 | 54.2 | 65.8 | 4.71 | 29.2 |
| RGO (h, e)-TiO2 | 108.691 | 85.6 | 10.2 | 58.3 | 56.2 | 5.11 | 27.8 |
In addition to the adsorption ability, the utilization of photo-induced electrons exerts a significant influence on the observed photocatalytic performances. The electron loss results from three parts in the composites: RGO, TiO2 and their interface area. The corresponding losses in the RGO and TiO2 of all the photocatalysts can be deemed as identical because of the similar defect density of the adopted RGO and the same TiO2 raw material. Therefore, the distinctions between the electron loss ratios among these composites are due to the influence from the different interface conditions. As is already known, some hydroxyl groups appear on the TiO2 surface due to the oxygen vacancies, which can form a strong chemical contact with the carboxyl groups.18 Therefore, the RGO (h, e) and TiO2 should possess the closest interface contact for electron transport. In order to confirm this point, infra-red (IR) curves were recorded (Fig. 5a). As for the pristine TiO2, the low frequency absorption below 1000 cm−1 was assigned to the T–O–Ti vibration, while the broad absorption from 3000 to 3700 cm−1 is attributed to the O–H stretching vibration.1,19 After combining with various RGO samples, a new absorption around 1600 cm−1, which was ascribed to the skeletal vibration of the graphene basal plane, can be seen.20 Moreover, the signal belonging to the Ti–O–Ti vibration becomes wider in the composite photocatalysts. According to previous reports, the broader peak contains the Ti–O–C vibration, manifesting the formation of a chemical bond between the RGO and TiO2.10 The corresponding peak intensity from the RGO (h, e)-TiO2 is much stronger than that of the other specimens, which is in line with the decomposition experiments. Although IR spectroscopy is a useful tool to analyze functional groups of various organic matters, detailed information on the functional groups of the RGO is difficult to abstract because the corresponding total amount is limited (IR spectroscopy is more suitable for use with organic matter rather than inorganic substances).
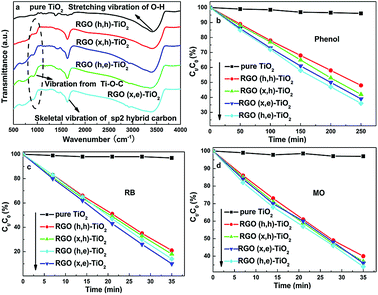 | ||
| Fig. 5 (a) IR curves of the various samples, decomposition of (b) phenol (c) RB and (d) MO by using various photocatalysts under visible-light irradiation. | ||
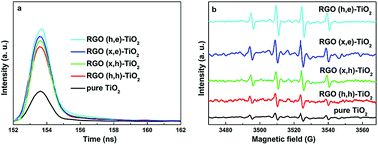
Photo-induced electron lifetime (which is defined as the average time span from the generation to annihilation of the photo-induced electrons) is the key parameter for the resulting photocatalytic performance, and a long lifetime implies a low recombination rate of the electron–hole pairs. All of the composite photocatalysts display a relative long electron lifetime compared with that of the origin TiO2 because the presence of graphene acts as an electron tank to depress the recombination process. Therefore, the RGO (h, e)-TiO2 displays the highest value (which is 26% higher than the corresponding value for the pure TiO2, Fig. 6a), indicating that the improved interface contact between the RGO and TiO2 imposes a positive effect on the electron lifetime (as well as the photocatalytic performance). According to the photocatalytic mechanism,3,10 the photo-generated electrons and holes will react with O2 and OH− to yield oxygen free radicals (O2−) and a superoxide anion (OH˙), which act as the oxidizing agents to decompose the pollutants.9,10 Therefore, the total amounts of O2− and OH˙ determine the resulting photocatalytic performances of the composites, which can be detected by EPR (5,5-dimethyl-1-pyrroline-N-oxide, DMPO is adopted as the capture agent). As shown in Fig. 6b, some obvious signals belonging to the DMPO-OH˙ can be seen for all the specimens under UV-light irradiation, and the corresponding intensities from composite photocatalysts are much stronger than that of the pristine TiO2. Therefore, the RGO (h, e)-TiO2 displays the strongest intensity, which is in line with the electron lifetime results.
In addition to the excellent UV-light activity, visible-light performances of the as-prepared composite photocatalysts are quite important for their practical applications. Under visible-light irradiation, the corresponding photocatalytic performances of these samples are listed in Fig. 5b–d. Pure TiO2 showed a poor activity for all of the pollutants due to its wide band gap (∼3.2 eV). Moreover, all the composite photocatalysts displayed different photocatalytic performances for specific pollutants. A similar case is observed under UV-light irradiation, indicating that the type of surface functional groups plays a vital role in both the UV- and visible-light irradiation. As we know, graphene can act as a sensitizer in the composite under visible-light irradiation, and the interface condition determines the electron transport ability from graphene to TiO2. According to the results of our previous study, a Schottky barrier appears at their interface, and the height and width of the barrier determines the electron transport process.3,5 The width depends on the graphene thickness, while the height is determined by the interface contact. Therefore, a strong chemical bond between the graphene basal plane and TiO2 is important for the visible-light activity of the photocatalysts. In order to further confirm that the visible-light activity results from the sensitization effect rather than carbon atom doping, the UV-visible diffuse scattering spectra were recorded. In all of the curves, the significant increase in the absorption at the wavelength of ∼390 nm results from the intrinsic band gap of TiO2 (Fig. S3, ESI†). After adding the RGO modifier, no obvious shift can be seen in the absorption edge, indicating that no impurity energy level appears, which is in agreement with previous reports.3,5,10
Based on the above discussion, optimizing the types of functional groups for the adopted RGO has a significant effect on the resulting composite photocatalysts. After careful optimization, the recommend RGO modifiers with a controlled reduction degree and functional group types were proposed for different target pollutants, and the corresponding decomposition rate constants are listed in Table 2. The increased decomposition rate constants of RB, MO and phenol reached ∼26, ∼6 and ∼39% compared with the specimen that had not undergone the optimizing process. In fact, similar results can be obtained for congeneric pollutants. Lastly, the photocatalytic stabilities of these composite were tested, and all of the samples showed good performances after 20 cycles (Fig. 7, the decomposition rate constants are maintained at more than 92% compared with that obtained on the first use), manifesting the prospect of potential applications.
 | ||
| Fig. 7 Photocatalytic performance stabilities of the (a) RGO (h, e)-TiO2 under UV-light illumination and (b) RGO (x, e)-TiO2 under visible-light illumination. | ||
Experimental
Materials
Nanoscale TiO2 was purchased from Shanghai Jianghu industrial Co., Ltd and was sintered at 400 °C for 2 h to remove organics and dust before subsequent experiments. Natural graphite power was obtained from Alfa Aesar Co. Rhodamine-B (RB), methyl orange (MO), trichloroiminocyanuric acid (TCCA), sodium bromide, chloroacetic acid, phenol and sodium dodecyl sulfate (SDS) were obtained commercially from the Beijing Chemical Reagent Plant. Deionized water (resistivity 18 MΩ cm) was utilized to prepare all aqueous solutions and to rinse the specimens.Preparation
The GO samples were prepared using a modified Hummers' method and the approach reported by Zhang et al., and the obtained GO products were labeled as GO (h) and GO (x), respectively.21,22 The major surface functional groups of the GO (h) and GO (x) were carboxyl and hydroxyl, respectively.17 Two methods were used to reduce the GO samples and achieve the designated reduction degree and type of functional group in the resulting RGO. In the first method, alcohol was used as the reduction agent to react with the GO (h) and GO (x). Briefly, a certain amount of GO sample was dispersed in 50 mL of ethylene glycol and a 60 min sonication treatment was performed. Then, the suspension was heated to 160 °C for 5 h under vigorous stirring. After a subsequent centrifuge process (1 h), the sample was washed using deionized water three times. Lastly, the obtained paste was dried at 60 °C in a vacuum oven (named RGO (h, e) and RGO (x, e)). By using ethylene glycol, the epoxy groups were almost removed, while partial hydroxyl and carboxyl groups were retained. In the second method, hydrazine was employed to reduce the GO samples. Briefly, 2 mL hydrazine was added to a 30 mL GO solution (2 mg mL−1) dropwise at 98 °C for a certain time (4 h, the obtained products named RGO (h, h) and RGO (x, h)). By using hydrazine as the reducing agent, all of the functional groups were removed simultaneously. According to our previous study, the ratio of Celement![[thin space (1/6-em)]](https://www.rsc.org/images/entities/char_2009.gif) :
:![[thin space (1/6-em)]](https://www.rsc.org/images/entities/char_2009.gif) Cfunctional can be adjusted from 0.72 to 13.7 when the reduction time changes from 0 h to 12 h.23 Moreover, in order to precisely adjust the ratio of the carboxyl to hydroxyl groups, partial hydroxyl groups can be converted into carboxyl groups by using the NaOH and chloroacetic acid.24 Briefly, an aqueous suspension of GO was sonicated in a water bath for 1 h to obtain a solution. NaOH (1.2 g) and chloroacetic acid (1 g) were added into the suspension with sonication treatment to achieve the conversion of the hydroxyl groups to carboxyl groups. Recently, RGO samples with designated types and total amounts of surface functional groups have been prepared by our group.25 Preparation of the RGO-TiO2 composite photocatalysts has been described in our previous reports.9,13,26 The mass fraction of RGO in the resulting photocatalysts was 5 wt% (according to our previous study, this mass fraction is an optimized ratio).9
Cfunctional can be adjusted from 0.72 to 13.7 when the reduction time changes from 0 h to 12 h.23 Moreover, in order to precisely adjust the ratio of the carboxyl to hydroxyl groups, partial hydroxyl groups can be converted into carboxyl groups by using the NaOH and chloroacetic acid.24 Briefly, an aqueous suspension of GO was sonicated in a water bath for 1 h to obtain a solution. NaOH (1.2 g) and chloroacetic acid (1 g) were added into the suspension with sonication treatment to achieve the conversion of the hydroxyl groups to carboxyl groups. Recently, RGO samples with designated types and total amounts of surface functional groups have been prepared by our group.25 Preparation of the RGO-TiO2 composite photocatalysts has been described in our previous reports.9,13,26 The mass fraction of RGO in the resulting photocatalysts was 5 wt% (according to our previous study, this mass fraction is an optimized ratio).9
Characterization
Morphology images of the prepared samples were recorded using scanning electron microscope (SEM) (FEI Sirion 200 scanning electron microscope working at 5 kV). Raman curves were performed using a LabRam-1B Raman microspectrometer at 514.5 nm (Horiba Jobin Yvon, France). XPS measurements were performed on a RBD upgraded PHI-5000C ESCA system (PerkinElmer). BET surface areas of the photocatalysts were measured on a Nova 100 using N2 as the adsorption gas. EPR results were recorded on an EPR-8 (Bruker BioSpin Corp., Germany). IR spectroscopy curves were measured on an IR Prestige-21 system (PerkinElmer). XRD patterns were recorded on a Bruker D8 Advance (Cu Kα radiation 0.154 nm). The lifetimes of the photo-generated electrons were measured on a QM4CW (Photo Technology International). UV-vis diffuse reflectance spectra were recorded on a TU-1901 UV-vis spectrophotometer. Thermogravimetric analysis (TGA) was measured with a Pyris I TGA instrument (PerkinElmer, USA). Differential scanning calorimetry (DSC) curves were obtained using the Diamond DSC (PerkinElmer, USA).The photocatalytic reaction system consists of a 500 W xenon lamp and a cutoff filter (1 mol L−1 NaNO2 solution in an enclosed vessel, λ > 400 nm). Photocatalytic activities of all photocatalysts were evaluated by the degradation of phenol, MO and RB. In a typical process, 15 mg of the photocatalyst was immersed into 50 mL phenol solution (60 mg L−1) and 50 mL RB (or MO) solution (10 mg L−1) with stirring for 30 min in the dark to reach an adsorption balance. The resulting solution was irradiated under the photocatalytic reaction system, and 2 mL solution was taken to analyze the concentration of phenol (or MO, RB) at specified time intervals.
Conclusions
A series of graphene based composite photocatalysts with controlled types and ratios of surface functional groups were prepared to reveal the corresponding influences of the resulting photocatalytic performances from the interface contact. Based on the adsorption ability tests and pollutant decomposition experiments, the types of surface functional groups on the RGO exert a significant influence on the chemical adsorption ability and photocatalytic activities of the resulting composite photocatalysts, which is proven by the EPR results. Moreover, the presence of carboxyl groups of the RGO is beneficial to forming a close chemical bond with the TiO2 nanoparticles, which promotes the electron transport ability at their interface and prolongs the photo-induced electron lifetime. These as-prepared photocatalysts possess high performances under both UV- and visible-light irradiation (as well as a high stability for cycle use), implying promising prospects for their practical application.Conflicts of interest
There are no conflicts to declare.Acknowledgements
This work is supported by the National Natural Science Foundation of China (No. 51506012, 61401297, 51574044 and 61701333), the Natural Science Foundation of Jiangsu Province (No. BK20150266), the Foundation of Key Laboratory in Science and Technology Development Project of Suzhou city (No. SZS201609), the Natural Science Foundation of the Higher Education Institutions of Jiangsu Province (No. 17KJB120011), and the Science and Technology Projects Fund of Suzhou City (No. SYG201708).Notes and references
- H. Zhang, X. J. Lv, Y. M. Li, Y. Wang and J. H. Li, ACS Nano, 2010, 4, 380–386 CrossRef PubMed.
- C. Chen, W. M. Cai, M. C. Long, B. X. Zhou, Y. H. Wu, D. Y. Wu and Y. J. Feng, ACS Nano, 2010, 4, 6425–6432 CrossRef PubMed.
- G. X. Hu and B. Tang, Mater. Chem. Phys., 2013, 138, 608–614 CrossRef.
- M. Rostami, RSC Adv., 2017, 7, 43424–43431 RSC.
- B. Tang, H. Q. Chen, Y. F. He, Z. W. Wang, J. Zhang and J. P. Wang, Compos. Sci. Technol., 2017, 150, 54–64 CrossRef.
- R. Giovannetti, E. Rommozzi, M. Zannotti, C. A. D'Amato, S. Ferraro, M. Cespi, G. Bonacucina, M. Minicucci and A. Di Cicco, RSC Adv., 2016, 6, 93048–93055 RSC.
- Z. Y. Zhu, F. Zhou, S. Zhan, Y. Tian and Q. C. He, Appl. Surf. Sci., 2018, 430, 116–124 CrossRef.
- B. Tang, G. J. Ji, Z. W. Wang, H. Q. Chen, X. F. Li, H. G. Yu, S. Li and H. Liu, RSC Adv., 2017, 7, 45280–45286 RSC.
- Y. F. Sun, X. B. Wang, B. Tang, J. M. Ban, Y. F. He, C. B. Tao, H. Luo and J. D. Sun, Mater. Lett., 2017, 189, 54–57 CrossRef.
- Q. Q. Zhai, B. Tang and G. X. Hu, J. Hazard. Mater., 2011, 198, 78–86 CrossRef PubMed.
- B. Tang, H. Q. Chen, Y. F. Sun, M. G. Li, Z. W. Wang, H. G. Yu, T. T. Ma and S. Li, RSC Adv., 2018, 8, 27811–27817 RSC.
- J. Zhang, S. Li, B. Tang, Z. W. Wang, G. J. Ji, W. Q. Huang and J. P. Wang, Nanoscale Res. Lett., 2017, 12, 457–461 CrossRef PubMed.
- H. C. Lee, W. W. Liu, S. P. Chai, A. R. Mohamed, A. Aziz, C. S. Khe, N. M. S. Hidayah and U. Hashim, RSC Adv., 2017, 7, 15644–15693 RSC.
- P. A. Gokturk, N. Kakenov, C. Kocabas and S. Suzer, Appl. Surf. Sci., 2017, 425, 1130–1137 CrossRef.
- B. Tang, S. L. Wang, J. Zhang, Z. W. Wang, Y. F. He and W. Q. Huang, Int. Mater. Rev., 2018, 63, 204–225 CrossRef.
- B. Tang, Z. W. Wang, W. Q. Huang, S. Li, T. T. Ma, H. G. Yu and X. F. Li, Nanoscale Res. Lett., 2017, 12, 527–533 CrossRef PubMed.
- Y. F. Sun, Y. F. He, B. Tang, C. B. Tao, J. M. Ban and L. Jiang, RSC Adv., 2017, 7, 55790–55795 RSC.
- M. R. Hoffmann, S. T. Martin and W. Y. Chol, Chem. Rev., 1995, 95, 69–96 CrossRef.
- B. Neumann, P. Bogdanoff, H. Tributsch, S. Sakthivel and H. Kisch, J. Phys. Chem. B, 2005, 109, 16579–16586 CrossRef PubMed.
- Q. Xiao, J. Zhang and C. Xiao, Sol. Energy, 2008, 82, 706–713 CrossRef.
- W. S. Hummers and R. E. Offeman, J. Am. Chem. Soc., 1958, 80, 1339 CrossRef.
- G. X. Zhang, Y. Q. Xu, L. Wang and X. M. Sun, Sci. China Mater., 2015, 58, 534–543 CrossRef.
- Y. F. Sun, B. Tang, W. Q. Huang, S. L. Wang and Z. W. Wang, Appl. Therm. Eng., 2016, 103, 892–900 CrossRef.
- R. L. White, C. M. White, H. Turgut, A. Massoud and Z. R. Tian, J. Taiwan Inst. Chem. Eng., 2018, 85, 18–28 CrossRef.
- B. Tang, H. G. Yu, H. P. Peng, Z. W. Wang, S. Li, T. T. Ma and W. Q. Huang, RSC Adv., 2018, 8, 29220–29227 RSC.
- B. Tang, H. Q. Chen, H. P. Peng, Z. W. Wang and W. Q. Huang, Nanomaterials, 2018, 8, 104–131 CrossRef PubMed.
Footnote |
| † Electronic supplementary information (ESI) available. See DOI: 10.1039/c8ra05345f |
| This journal is © The Royal Society of Chemistry 2018 |

