 Open Access Article
Temporal–spatial-resolved mapping of the electrical double layer changes by surface plasmon resonance imaging
Xueyi Luo,
Shijie Deng and
Peng Wang *
*
State Key Laboratory of Precision Measurement Technology and Instruments, Department of Precision Instrument, Tsinghua University, Beijing 100084, PR China. E-mail: peng@mail.tsinghua.edu.cn
First published on 7th August 2018
Abstract
An electrical double layer (EDL) is a specific distribution of ions at the electrolyte/electrode interface. As EDL plays a decisive role in the interfacial physical and chemical characteristics, a comprehensive and quantitative understanding of the EDL structure and its change dynamics is important for a wide range of fields, ranging from electrochemistry, energy storage and semiconductor materials to biotechnology. In this paper, we proposed a proof of concept method for temporal- and spatial-resolved mapping of the EDL structure and its change dynamics. A potential was applied on the interface and the potential induced ion re-arrangement process was monitored by surface plasmon resonance (SPR) imaging in real time. NaCl experiments were repeated six times and the coefficient of variation of the results was 5.17%, confirming the potential-induced SPR response. Experiments with different potential excitations, ion concentrations and species were performed and results indicated that the electron density change and ion re-arrangement contributed comparably to the potential induced SPR response. Additionally, the lateral distribution of the EDL formed at the interface between NaCl solutions and an Au film coated with arrays of 11-MUA spots was mapped. This method is temporally and spatially resolved, and thus has the potential to be a promising tool for EDL studies at heterogeneous interfaces.
1 Introduction
An electrical double layer (EDL) is a specific distribution of ions at the electrolyte/electrode interface.1 As ions exchange and electron transfer occurs at the interface, the EDL structure and its change dynamics plays a decisive role on the interfacial physical and chemical characteristics.2,3 Since the introduction of the concept of EDL by Helmholtz, it has been extensively applied in various studies, ranging from electrochemistry, energy storage and semiconductor materials to biotechnology.2,4–6 A comprehensive and quantitative understanding of the EDL structure and its change dynamics is important for these interface studies.Theoretical models describing the distribution of ions at the electrode/electrolyte interface laid the foundation for the understanding of EDL.7 The classical Gouy–Chapman–Stern model, based on equilibrium and mean-field solutions of the Poisson–Boltzmann equation, has been widely adopted to interpret the interfacial physical and chemical characteristics. More recently, molecular simulations based on density functional theory,8 molecular dynamics9 and Monte Carlo simulation10 provide more detailed molecular-scale structure and dynamics of the interfacial EDL. On the other hand, based on a number of assumptions and empirical parameters to fit to theoretical models, the EDL structure could also be understood by measuring the interfacial differential capacitance, electrical impedance or surface tension. However, they usually assume homogeneous surface areas and integrate laterally over large, thus providing less lateral structure information.
Experimental methods based on X-ray reflectivity,11,12 X-ray photoelectron spectroscopy,13 neutron scattering,14 and electrochemical quartz crystal microbalance15 provide a direct means to elucidate the structure and composition of EDL. The probe scanning method, including scanning tunneling microscope (STM) and atomic force microscope (AFM), uses probes to scan through the sample surface and can map the EDL structure locally with atomic-level resolution.16–18 Gnahm et al.17 applied STM measurements to reveal marked structural differences of Au(111) and 1-butyl-3-methyl-imidazolium hexafluorophosphate interface at positive and negative of the potential of zero total charge. Siretanu et al.16 used high-resolution AFM to reveal the ordered and templated adsorption of the mono- and divalent ions to heterogeneous gibbsite/silica surfaces in contact with aqueous electrolytes. The probe scanning methods are of high spatial resolution for interfacial microcosmic structure mapping; but it is time-consuming and is difficult to study the EDL change dynamics.
Recently, with the development of new materials, such as the room temperature ionic liquids and their applications in electrochemical energy storage and voltage-controlled friction, researches on the lateral distribution of ions and charge density has drawn increasing more interest.19–23 For instance, reports show that the structure of the electrode surface influences the properties of the capacitors.24 Thus it is helpful to improve the energy densities in capacitors by researching and controlling the surface structure. However, it was difficult to image the electrode surface structure and measure the EDL change dynamics simultaneously. In addition, the lateral EDL structure could not be resolved, and thus its influence mechanism could not be researched experimentally. Surface plasmon resonance (SPR) is a collective charge density oscillation that occurs at the metal–dielectric interface.25 As it is extremely sensitive to changes in the interfacial region, SPR has developed as a powerful tool for real time characterization of the metal–dielectric interface.26–28 Combined with electrochemistry, EC-SPR has been employed to characterize the properties of films at the electrode surface in response to potential excitations,29–33 and to monitor electrochemical reactions of small molecules at electrode surfaces.34–37 Furthermore, SPR imaging even enables the visualization of the spatial distribution of surface charge and local electric field.22,23,38,39 As the EDL structure change is the re-arrangement of ions at the electrode interface, SPR imaging can be also used to optically map the lateral distribution of EDL and its changing dynamics. Therefore, it could provide direct insight into the EDL changes at the heterogeneous electrode surface and be used to research in situ the influence of the electrode surface structure on the capacitance. In this paper, we report the first probe-free imaging method that can directly visualize the EDL change process, providing essential information for its spatial distribution.
2. Materials and methods
2.1 Experimental setup and sensing chip
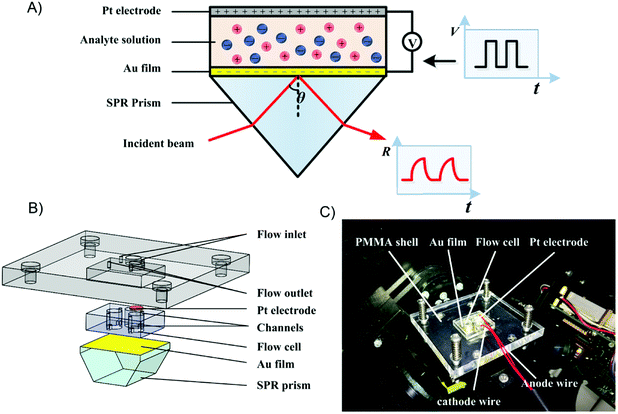
The experimental setup was composed of a home-built SPR differential interferometric imaging system and a programmable voltage source, as illustrated in Fig. 1A. The SPR imaging system has been described in a previous publication.40 Briefly, a p-polarized collimated beam of light was projected onto the sensing chip. The reflected light was split into two orthogonal polarized light beams and imaged with two CCD cameras. Two interferograms with 180 degrees of phase difference were simultaneously obtained at a frequency of 3 frames per second. The ratio of the difference and sum of the two interferograms was approximately linear with the RI variation of the dielectric on the sensing surface; thus it was called refractive index relative factor (RIRF) and could be used to quantify the SPR response.The sensing chip, as illustrated in Fig. 1B, consisted of a SPR prism, a poly(dimethylsiloxane) (PDMS) body, a platinum electrode, and a polymethylmethacrylate (PMMA) sheet. The SPR prism coated with 2 nm of chromium following with 42 nm of gold. A cathode wire was electrically connected to the edge of the gold film using silver conductive adhesive. The PDMS body was fabricated using the replica molding method.41 It consisted of two sensing cells and a weld cell. The two sensing cells were connected with outlets through flow channels to replace the analyte solutions, and the weld cell was reserved for welding the electric connection to the Au film. The assembly of the sensor chip was installed in the SPR setup using clamp bolts, as shown in Fig. 1C. The programmable voltage source (HMC 8042, Rohde & Schwarz) was used to apply different patterns of voltage excitation on the sensing chip to change the EDL structure at the Au-liquid interface.
2.2 SPR imaging of potential-induced EDL changes
Prior to experiments, one sensing cell was filled with salt solution (0.1 M, 0.5 M, or 1.0 M NaCl or KCl solutions) as the experimental group, and the other sensing cell was filled with DI water as the control group. The programmable voltage source output a series of square waves with a period of 266 s, initial pulse height of 0.05 V, and an increase of 0.05 V every two cycles to a maximum of 0.25 V. The SPR images were recorded simultaneously. For each salt solution, the experiment was repeated 3 times. The experimental cell was flushed with DI water before changing the salt solution in each experiment.2.3 Cyclic voltammetry
To verify the electrochemical reactions when potential excitation was applied on the sensing cell, cyclic voltammetry experiments were carried out using an electrochemical workstation (CS350, Wuhan Corrtest Instrument Co. Ltd., China). The electrochemical cell was filled with 0.5 M NaCl or KCl solution, and the working electrode and counting electrode were both platinum gauze electrode. The applied potential was scanned from −1.0 V to 1.0 V at the rate of 100 mV s−1. For each experiment, the potential was scanned for 5 times.3. Results and discussion
3.1 Characterization of the SPR imaging system
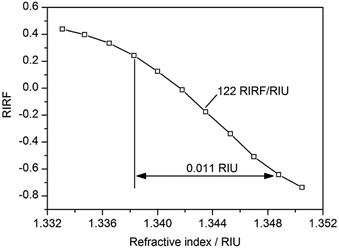
NaCl solutions exhibit great linearity of refractive index (RI) versus concentration and thus was used to test the sensitivity of the SPR imaging system. A gradient concentration of 0% (DI water), 1%, 2%, 3%, 4%, 5%, 6%, 7%, 8%, 9% and 10% NaCl solutions, with RI linearly ranging from 1.3331 to 1.3505, were sequentially injected into the sensing cells. The experimental result is shown in Fig. 2. It demonstrated that the RIRF was approximately linear with the RI variation in the range from 1.3383 to 1.3488 RIU, and the sensitivity was nearly 122 RIRF/RIU. It is worth mentioning that the potential induced SPR response in the manuscript reveals not only the effective RI change, but also the electron density change. However, RIU was just the unit of RI change. Therefore, RIRF was used in the manuscript to quantify the potential induced SPR response that results from both the effective RI change and the electron density change.3.2 SPR imaging of potential-induced EDL changes
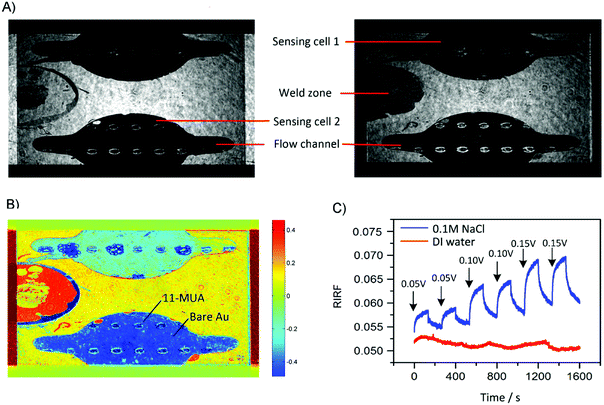
The typical experimental result of SPR imaging of potential-induced EDL changes is shown in Fig. 3. Fig. 3A shows the two raw SPR interferograms with 180-degree phase difference. After difference operations between the two interferograms, the RIRF distribution across the sensing area was obtained as shown in Fig. 3B. It is obvious that the RIRFs of the two sensing cells, the weld zone and other sensing areas were distinct. Upon potential excitations, temporal dynamics of the EDL changing process could also been monitored. Fig. 3C shows typical sensorgrams of the averaged RIRF in the regions of interest. It can be seen that, upon the potential excitations, the SPR response of the experimental cell filled with NaCl solutions rose rapidly and then tended to equilibrium gradually, and the value of the equilibrium response increased with the potential amplitude. When the potential was removed, the SPR response showed an opposite variation trend. However, the SPR response of the control cell filled with DI water was nearly immune to the potential excitations. The RIRF variation may result from the bulk RI drift. Based on the SPR imaging method, both the spatial distribution and temporal dynamics of the EDL changes could be obtained.To validate the effect of potential-induced EDL changes on the SPR response, a periodic square wave of 0.15 V was applied on the sensing cell filled with 0.1 M NaCl solutions. The experimental results are shown in Fig. 4. The sensorgrams were normalized to remove the bulk RI drift. These sensorgrams showed similar trends. The RIRF increased rapidly at the rising edge of the square wave, and tended to equilibrium gradually. At the falling edge of the square wave, the RIRF declined steeply and the descent rate gradually decreased. The average of the maximum RIRF was 0.0105 ± 0.0005, and the coefficient of variation (CV) was 5.17%.
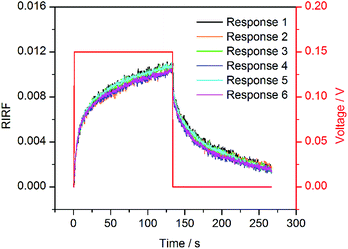 | ||
| Fig. 4 Six independent SPR sensorgrams of 0.1 M NaCl solution upon the potential excitation with a square wave of 0.15 V. | ||
When the potential excitation was applied on the sensing cell, there may exist three types of changes at the interface, including the electron density changes, the electrochemical reactions and the re-arrangement of ions.23,42 The surface plasmon mode is influenced by the dielectric constants of the analyte solutions and Au film, according to43
 | (1) |
 | (2) |
On the other hand, the applied potential excitation will change the ion arrangement in the analyte solutions. Because of the exponentially decaying nature of the surface plasmon wave, the contribution of the local ion concentration change to the SPR response varies at different height above the sensing surface. Thus the SPR response is sensitive to the effective RI which is an integration of the local RI with different weights. When applying a negative voltage on the Au film, cations concentrated and anions de-concentrated near the Au film. Although the overall concentration of the anions and cations remained unchanged, the ion re-arrangement could still change the effective refractive index, Δneff, as eqn (3) and evokes the SPR response.
 | (3) |
If electrochemical reaction occurs at the sensing surface, the reaction consumption and product will also cause the SPR response. To verify the electrochemical reactions at the interface, cyclic voltammetry measurements were conducted. The cyclic voltammograms of NaCl and KCl solutions were similar and both showed a well-defined couple of reduction and oxidation peaks at −1.0 and 1.0 V, respectively. In the range between −0.25 V and 0 V, the Au film is chemically stable and the non-faradic current dominates the electrochemical current. The small current mainly resulted from the mobility of ions at the interface. Therefore, the contribution from the electrochemical reaction to the potential induced SPR response was excluded.
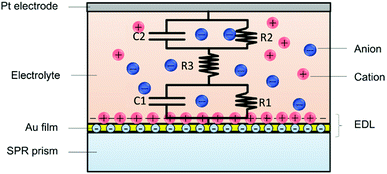
Based on the above analysis, the potential induced SPR response was attributed to both the electron density change and the ion re-arrangement. The EDL change process could be described by the ion re-arrangement. As shown in Fig. 5, the Au/liquid interface could be equivalent as an interfacial capacitance in parallel with a small resistance, and then in series with the solution resistance. The interfacial capacitance varies with the species and concentration of ions, as well as the applied potential amplitude. The cations concentration and anions de-concentration on the Au film could be described as the capacitance charging behaviour. Therefore, the EDL change dynamics in response to various factors could be mapped by SPR imaging.
3.3 Mapping of EDL changes in response to different potential amplitudes
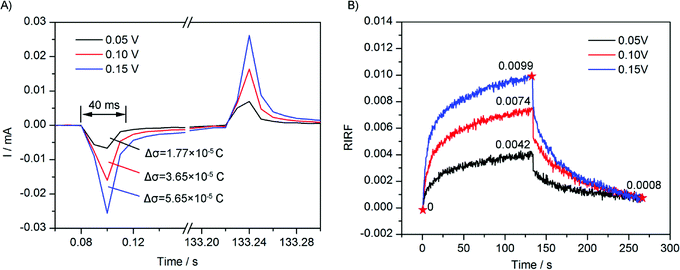
To study the effect of potential amplitude on the EDL change dynamics, square waves of 0.05 V, 0.10 V and 0.15 V were applied on the sensing cell filled with 0.1 M NaCl solution, and the EDL change process was monitored by SPR imaging in real time. The experimental results are shown in Fig. 6. Fig. 6A shows the electrode current that was simultaneously recorded. It could be seen that, upon the potential applying, a sudden large current appeared and followed by a small and gradually decreasing current. By integrating the current, the change of quantity of electric charge on the Au film could be estimated. Upon the applying of potential of 0.05 V, 0.10 V and 0.15 V, the integrations of the sudden current were 1.77 × 10⁻⁵ C, 3.65 × 10⁻⁵ C, and 5.65 × 10⁻⁵ C, respectively, showing a linear dependence on the potential amplitude. Because the charging was fast, the interfacial capacitance could be assumed to be unchanged. According to the capacitance charging equation σ = CV, the quantity of electric charge should be proportional to the applied voltage.Fig. 6B presents time courses of variations of the averaged RIRFs across the regions of interest. Upon the potential stimulation, the RIRF rose rapidly and then tended to equilibrium gradually. The peak value of RIRF increased with the voltage amplitude. The peak value of RIRF was 0.0042, 0.0074 and 0.0099, respectively. To estimate the effects of ion re-arrangement and the electron density change, a dual-exponential decay curve was used to fit the RIRF curves.
RIRF = A1![[thin space (1/6-em)]](https://www.rsc.org/images/entities/char_2009.gif) ![[thin space (1/6-em)]](https://www.rsc.org/images/entities/char_2009.gif) e−t/τ1 + A2 e−t/τ1 + A2![[thin space (1/6-em)]](https://www.rsc.org/images/entities/char_2009.gif) ![[thin space (1/6-em)]](https://www.rsc.org/images/entities/char_2009.gif) e−t/τ2 + y0 e−t/τ2 + y0
| (4) |
Fitting results were shown in Table 1. The fitting is very good with the R-square better than 0.98, validating the analysis that the potential induced SPR response was influenced by both the electron density change and the ion re-arrangement. The fitting A1 and A2 were approximately equal, indicating the contributions of the ion re-arrangement and the electron density change were comparable. Besides, the two fitting time constants τ1 and τ2 were a few seconds and dozens of seconds, respectively. Because the ion re-arrangement was much slower than the electron density change, the large time constants τ2 was used to estimate the ion re-arrangement rate. The fitting results indicated that, with the increasing potential, weights of the electron density change and the ion re-arrangement increased simultaneously, and the time constants decreased simultaneously. The linear relation between the fitting weight of the electron density change A1 and the potential amplitude agrees with the electrode current which shows a linear dependence on the potential amplitude as well. However, the fitting time constant of the electron density change τ1 was larger than that shown in the electrode current curves. The difference may result from the low acquisition speed of the SPRi system (3 Hz).
| A1 | τ1 | A2 | τ2 | |
|---|---|---|---|---|
| 0.1 M, 0.05 V | −0.00168 | 6.406 | −0.00247 | 85.250 |
| 0.1 M, 0.10 V | −0.00358 | 5.654 | −0.00435 | 63.021 |
| 0.1 M, 0.15 V | −0.00583 | 5.276 | −0.00521 | 59.176 |
With respect to the ion re-arrangement, the time constant τ2 equals to τ = RC, where R is the equivalent solution resistance and C is the equivalent interfacial capacitance. Because the concentration of bulk solution was unchanged, the solution resistance R was approximately constant. However, the experimental results show that the time constant τ2 decreased with the increasing voltage amplitude. It reveals that the interfacial capacitance C decreased with the voltage amplitude, which is consistent with the previous literature.18
3.4 Mapping of EDL changes in response to different ion concentrations
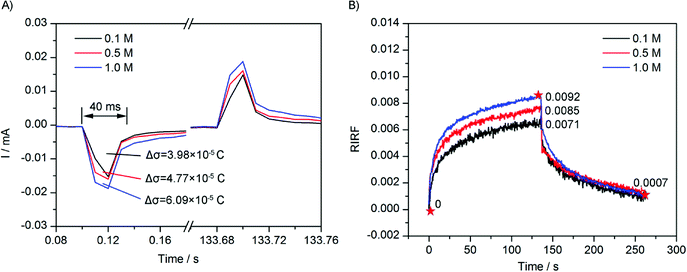
To study the effect of ionic concentration on the EDL charging dynamics, the sensing cell was filled with 0.1 M, 0.5 M, and 1.0 M NaCl solution respectively, and was stimulated with a square wave of 0.10 V. The experimental results are shown in Fig. 7. Fig. 7A shows the electrode current that was simultaneously recorded. It could be seen that the current variations were similar with those in Fig. 6A. The integrations of the sudden current were 3.98 × 10⁻⁵ C, 4.77 × 10⁻⁵ C, and 6.09 × 10⁻⁵ C, respectively. The variation also showed a linear dependence on the NaCl concentration, but with a non-zero intercept. According to the capacitance charging equation, with the applied voltage unchanged, the experimental results revealed the interfacial difference capacitance has a linear but with non-zero intercept dependence on the concentration of electrolyte.Fig. 7B depicts the averaged SPR response of 0.1 M, 0.5 M, and 1.0 M NaCl solution. The peak value of RIRF increased with the ion concentration (0.0071, 0.0085 and 0.0092, respectively). Fitting results were shown in Table 2. The fitting is very good as well. The fitting results indicated that, with the increasing ion concentration, the weight of the electron density change and the ion re-arrangement increased simultaneously, while the time constants show no clear variation trends. The linear but with non-zero intercept dependence of the fitting weight A1 of the electron density effect on the ion concentration agrees with that of the electrode current. The fitting time constant of the electron density change τ1 was also larger than that shown in the electrode current curves.
| A1 | τ1 | A2 | τ2 | |
|---|---|---|---|---|
| 0.1 M, 0.10 V | −0.00340 | 4.229 | −0.00385 | 66.082 |
| 0.5 M, 0.10 V | −0.00348 | 3.653 | −0.00426 | 45.770 |
| 1.0 M, 0.10 V | −0.00468 | 4.563 | −0.00445 | 55.202 |
With respect to the ion re-arrangement, the fitting time constant τ decreased initially and then increased, showing no clear variation trends. Theoretically, with increasing ion concentration, the solution resistance R decreased and the interfacial capacitance C increased, thus making it difficult to estimate the variation trend of the time constant.
3.5 Mapping of EDL changes in response to different ion species
To study the effect of ion species on the EDL change dynamics, the sensing cell was filled with 0.1 M and 0.5 M NaCl and KCl solution, respectively. The experimental results are shown in Fig. 8. The SPR sensorgrams of NaCl and KCl experiments showed a similar pattern. However, the responses of NaCl experiments presented larger peak values, compared with those in the KCl experiments. In theory, Na+ has a smaller diameter and thus forms thinner gaps between the electrode and the outer Helmholtz plane, generating a larger interfacial capacitance than K+. Therefore, with the same potential excitation, the Au film in NaCl solutions could gather more cations and thus generated larger SPR response than in KCl solutions.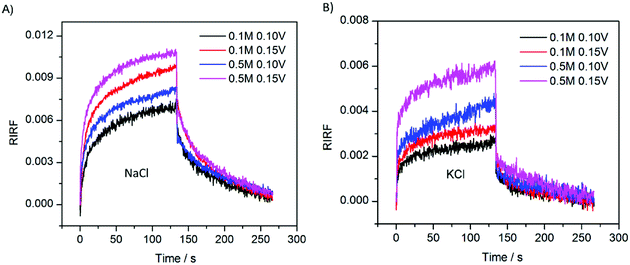 | ||
| Fig. 8 SPR responses with 0.1 M and 0.5 M NaCl (A) and KCl (B) solution upon stimulation with square waves of 0.10 V and 0.15 V. | ||
3.6 Mapping of EDL changes across the heterogeneous surface
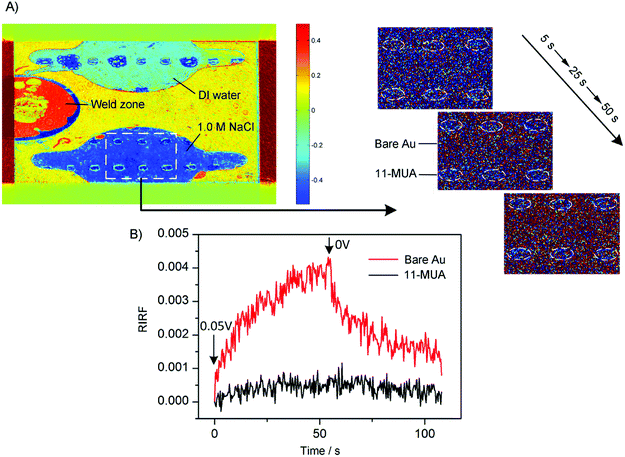
To demonstrate the spatial-resolved EDL imaging capability, the Au film was coated with arrays of 11-MUA spotsand SPR imaging was used to monitor the EDL formed at the interface between the heterogeneous Au film and 1.0 M NaCl solutions. Fig. 9A shows a typical RIRF distribution across the sensing area. The top and bottom sensing cells were filled with DI water and 1.0 M NaCl solutions, respectively. The array of the spots is the 11-MUA covered regions and exhibit distinct signal with the bare Au regions. Insets show the enlarged view of RIRF distribution changes in the region of interest at 5 s, 25 s, and 50 s, relative to the initial distribution at 0 s. With the applying of a 0.05 V voltage on the Au film, the RIRF distributions at the Au/solution interface exhibited a clear change. However, at the 11-MUA/solution interface, the change was not obvious. To quantify the change, the SPR responses from the areas of bare Au and 11-MUA were extracted and shown in Fig. 9B. The applied potential induced a 0.0045 RIRF change at the Au/solution interface and a nearly 0.005 RIRF change at the 11-MUA/solution interface. Because 11-MUA monolayer is thicker than the ion diameter, the capacitance formed at the 11-MUA/solution interface is much smaller than that at the Au/solution interface. According to the discussion in Section 3.2, the electron density change and the ion re-arrangement effect were both small at the 11-MUA/solution interface. Therefore, the RIRF change at the 11-MUA/solution interface was much smaller than that at the Au/solution interface. It is exactly the advantage of the SPRi-based method that could resolve the lateral distribution of EDL across the heterogeneous surface.4 Conclusions
In this paper, we presented a proof of concept method of using SPR imaging to map the spatial distribution and temporal dynamics of the EDL change on the heterogeneous surface. The potential applied on the SPR sensing cell gave rise to the electron density change and the re-arrangement of local ions, and caused a corresponding SPR response. NaCl experiments were repeated six times and the coefficient of variation of the results was 5.17%, confirming the potential-induced SPR response. Experiments with different potential excitations, ion concentrations and species were performed and results indicated that the electron density change and ion re-arrangement contributed comparably to the potential induced SPR response. The lateral distribution of the EDL formed at the interface between NaCl solutions and an Au film coated with arrays of 11-MUA spots was mapped. This method is temporal and spatial resolved to monitor the EDL changes, and thus has the potential to be a promising tool for EDL studies at heterogeneous interfaces.Conflicts of interest
There are no conflicts to declare.Acknowledgements
We thank Louis R. Nemzer, PhD for editing the English text of a draft of this manuscript.References
- M. V. Fedorov and A. A. Kornyshev, Chem. Rev., 2014, 114, 2978–3036 CrossRef PubMed
.
- A. A. Kornyshev and R. Qiao, J. Phys. Chem. C, 2014, 118, 18285–18290 CrossRef
.
- E. Schmidt, S. Shi, P. P. Ruden and C. D. Frisbie, ACS Appl. Mater. Interfaces, 2016, 8, 14879 CrossRef PubMed
.
- N. S. Choi, Z. Chen, S. A. Freunberger, X. Ji, Y. K. Sun, K. Amine, G. Yushin, L. F. Nazar, J. Cho and P. G. Bruce, Angew. Chem., Int. Ed., 2012, 51, 9994–10024 CrossRef PubMed
.
- A. Maity, X. Sui, C. R. Tarman, H. Pu, J. Chang, G. Zhou, R. Ren, S. Mao and J. Chen, ACS Sens., 2017, 2, 1653–1661 CrossRef PubMed
.
- B. K. Min, S. K. Kim, S. J. Kim, S. H. Kim, M. Kang, C. Y. Park, W. Song, S. Myung, J. Lim and K. S. An, Sci. Rep., 2015, 5, 16001 CrossRef PubMed
.
- H. Helmholtz, Ann. Phys., 1879, 243, 337–382 CrossRef
.
- D. E. Jiang and J. Wu, Nanoscale, 2014, 6, 5545–5550 RSC
.
- B. M. Lowe, Y. Maekawa, Y. Shibuta, T. Sakata, C. K. Skylaris and N. G. Green, Phys. Chem. Chem. Phys., 2016, 19, 2687–2701 RSC
.
- K. Kiyohara and K. Asaka, J. Chem. Phys., 2007, 126, 214704 CrossRef PubMed
.
- C. Park, P. A. Fenter, K. L. Nagy and N. C. Sturchio, Phys. Rev. Lett., 2006, 97, 16101 CrossRef PubMed
.
- E. Sloutskin, M. O. Benjamin, L. Tamam, I. Kuzmenko, A. Thomas Gog and M. Deutsch, J. Am. Chem. Soc., 2005, 127, 7796–7804 CrossRef PubMed
.
- G. Olivieri, A. Goel and M. A. Brown, Chem. Commun., 2016, 52, 9040–9043 RSC
.
- Y. Lauw, M. D. Horne, T. Rodopoulos, V. Lockett, B. Akgun, W. A. Hamilton and A. R. J. Nelson, Langmuir, 2012, 28, 7374–7381 CrossRef PubMed
.
- J. M. Griffin, A. C. Forse, W. Y. Tsai, P. L. Taberna, P. Simon and C. P. Grey, Nat. Mater., 2015, 14, 812 CrossRef PubMed
.
- I. Siretanu, D. Ebeling, M. P. Andersson, S. L. Stipp, A. Philipse, M. C. Stuart, D. D. E. Van and F. Mugele, Sci. Rep., 2014, 4, 4956 CrossRef PubMed
.
- M. Gnahm, C. Berger, M. Arkhipova, H. Kunkel, T. Pajkossy, G. Maas and D. M. Kolb, Phys. Chem. Chem. Phys., 2012, 14, 10647–10652 RSC
.
- M. Gnahm, T. Pajkossy and D. M. Kolb, Electrochim. Acta, 2010, 55, 6212–6217 CrossRef
.
- C. Mccallum, S. Pennathur and D. Gillespie, Langmuir, 2017, 33, 5642–5651 CrossRef PubMed
.
- Y. Lauw, M. D. Horne, T. Rodopoulos, V. Lockett, B. Akgun, W. A. Hamilton and A. R. Nelson, Langmuir, 2012, 28, 7374–7381 CrossRef PubMed
.
- S. H. Loh and S. P. Jarvis, Langmuir, 2010, 26, 9176–9178 CrossRef PubMed
.
- T. Liu, M. Li, Y. Wang, Y. Fang and W. Wang, Chem. Sci., 2018, 9, 4424–4429 RSC
.
- L. Yuan, N. Tao and W. Wang, Annu. Rev. Anal. Chem., 2017, 10, 183–200 CrossRef PubMed
.
- J. Vatamanu, L. Cao, O. Borodin, D. Bedrov and G. D. Smith, J. Phys. Chem. Lett., 2011, 2, 2267 CrossRef
.
- J. Homola, Electromagnetic Theory of Surface Plasmons, Springer, Berlin, Heidelberg, 2006 Search PubMed
.
- L. Bo, C. Nylander and I. Lunström, Sensors and Actuators, 1983, 4, 299–304 CrossRef
.
- J. Homola, S. S. Yee and G. Gauglitz, Anal. Bioanal. Chem., 1999, 377, 528–539 CrossRef PubMed
.
- J. Homola, Chem. Rev., 2008, 39, 462–493 CrossRef PubMed
.
- X. Yao, J. Wang, F. Zhou, A. Jun Wang and N. Tao, J. Phys. Chem. B, 2015, 108, 7206–7212 CrossRef
.
- N. Nishi, Y. Hirano, T. Motokawa and T. Kakiuchi, Phys. Chem. Chem. Phys., 2013, 15, 11615–11619 RSC
.
- X. Kang, Y. Jin, A. Guangjin Cheng and S. Dong, Langmuir, 2005, 18, 10305–10310 CrossRef
.
- V. Lioubimov, A. Kolomenskii, A. Mershin, D. V. Nanopoulos and H. A. Schuessler, Appl. Opt., 2004, 43, 3426–3432 CrossRef PubMed
.
- W. Knoll, Annu. Rev. Phys. Chem., 1998, 49, 569–638 CrossRef PubMed
.
- Y. Fang, H. Wang, H. Yu, X. Liu, W. Wang, H. Y. Chen and N. J. Tao, Acc. Chem. Res., 2016, 136, 12584–12587 Search PubMed
.
- X. Shan, Science, 2010, 327, 1363 CrossRef PubMed
.
- S. Wang, X. Huang, X. Shan, K. J. Foley and N. Tao, Anal. Chem., 2010, 82, 935–941 CrossRef PubMed
.
- O. Andersson, C. Ulrich, F. Bj Refors and B. Liedberg, Sens. Actuators, B, 2008, 134, 545–550 CrossRef
.
- M. Hasheminejad, Y. Fang, M. Li, Y. Jiang, W. Wang and H. Chen, Angew. Chem., 2017, 129, 1651–1655 CrossRef
.
- Y. Wang, X. Shan, S. Wang, N. Tao, P. Y. Blanchard, K. Hu and M. V. Mirkin, Anal. Chem., 2015, 88, 1547 CrossRef PubMed
.
- D. Wang, L. Ding, W. Zhang, Z. Luo, H. Ou, E. Zhang and X. Yu, Meas. Sci. Technol., 2012, 23, 65701–65710 CrossRef
.
- S. Deng, P. Wang, L. Ding and X. Yu, Sens. Actuators, A, 2014, 218, 41–48 CrossRef
.
- A. B. Dahlin, B. Dielacher, P. Rajendran, K. Sugihara, T. Sannomiya, M. Zenobiwong and J. Vörös, Anal. Bioanal. Chem., 2012, 402, 1773–1784 CrossRef PubMed
.
- K. J. Foley, X. Shan and N. Tao, Anal. Chem., 2008, 80, 5146–5151 CrossRef PubMed
.
| This journal is © The Royal Society of Chemistry 2018 |

