 Open Access Article
The synergistic effect of oxygen-containing functional groups on CO2 adsorption by the glucose–potassium citrate-derived activated carbon†
Baogen Liua,
Haoyang Lib,
Xianchen Maa,
Ruofei Chenac,
Shaobin Wangc and
Liqing Li *a
*a
aSchool of Energy Science and Engineering, Central South University, Changsha 410083, China. E-mail: liqingli@hotmail.com; Tel: +86-731-8887-9863
bSchool of Material Science and Engineering, Central South University, Changsha 410083, China
cDepartment of Chemical Engineering, Curtin University, GPO Box U1987, Perth, Australia
First published on 20th November 2018
Abstract
A high surface area activated carbon prepared by an innovative approach using glucose as a carbon source and neutral potassium citrate (PC) as an activator was compared with the porous carbon from glucose using corrosive potassium hydroxide (KOH) as an activator. The PC method showed two notable advantages over KOH activation. The PC method not only significantly increased the yield of the activated carbon, particularly at high carbonization temperatures without sacrificing porosity, but also enhanced the oxygen content in the activated carbon. After investigating CO2 adsorption on these activated carbons, a remarkable uptake of 3.57 mmol g−1 at 25 °C at 1 bar was observed by the glucose–PC-derived carbon sample, which possessed the highest oxygen content. In addition, the glucose–PC-derived carbon samples exhibited higher CO2/N2 selectivity than the glucose–KOH derived samples. Coupled with the density functional theory (DFT) analysis that focused on the binding energy calculation, the doped oxygen-containing functional groups, such as carboxyl and hydroxyl groups, could effectively enhance the adsorption of CO2.
1. Introduction
Carbon materials, which have been synthesized and used for more than 3000 years, have attracted considerable interest due to their potential applications in catalysts, gas storage devices, super capacitors, and adsorbents.1–4 And the reasons why these materials are so valued are richness in porosity, low economic cost, abundance in resource and ease of operation.5 As one of the most promising applications of activated carbon, the adsorption of CO2, a greenhouse gas emitted from the massive combustion of fossil fuels, has been demonstrated by many researchers.6–8 The incorporation of nitrogen groups into the carbon network favors CO2 adsorption by enhancing the interaction between the acidic CO2 molecule and the relative basic carbon surface caused by nitrogen functionalities, which has been well documented in the literature.9,10 General approaches for nitrogen doping involve the carbonization of nitrogen-containing polymers or biomass, which are generally oxygen-rich. Our hypothesis is that the potentially existing oxygen-containing functional groups are somehow capable of CO2 adsorption; however, the evaluation of the role of different oxygen-containing functional groups toward CO2 adsorption has been rarely reported.Activated carbon obtained by KOH (potassium hydroxide) activation is considered as an excellent adsorption material due to its excellent porous structure and large specific surface area.11–13 Since the first employment of KOH as an activator in 1978, the activation mechanism of KOH has been investigated in detail, but not yet well-established because of the complexity of activation process derived from the variables both in the actual experimental parameters and the reaction with different carbon sources.14 In general, the reaction of KOH with carbon sources involves two main mechanisms. The first mechanism involves the oxidation of carbon to form carbon dioxide and carbonate. The second mechanism involves the formation of carbon-reduced metallic K, the penetration of K metal vapors into graphene layers, and the expansion of the carbon structure caused by the inserted K vapors.14,15
In recent studies, researchers developed a series of successful porous carbon samples from the direct pyrolysis of organic salts that contain both a carbon source and a certain metal element, which can generate sufficient pores.16–18 Among them, carbon derived from potassium citrate (PC), a common and neutral K compound, aroused our great attention due to its ultrahigh specific surface area.19 Motivated by this finding, in this study, we employed PC as a new activator instead of corrosive KOH to prepare activated carbons. In order to investigate the performance of PC, glucose (GC), a widely used biomass, was chosen as the carbon source. The physical and chemical properties of the as-prepared carbons from both the PC activation and KOH activation methods were compared along with their CO2 adsorption performance. In addition, the impact of the physical and chemical properties on the as-prepared activated carbons toward CO2 adsorption and the specific interactions between oxygen groups and CO2 molecules calculated by density functional theory (DFT) were studied.
2. Experimental
2.1 Chemicals
Potassium citrate tribasic monohydrate (K3C6H5O7·H2O), glucose (C6H12O6), and potassium hydroxide (KOH) applied in this study were purchased from Sinopharm Chemical Regent Co., Ltd., China and used without purification.2.2 Synthesis of materials
In a typical synthesis, a mixture of PC and GC (PGC, mass ratio: PC/GC = 2) was placed in a tube furnace, heated to desired temperatures (5 °C min−1. 750 °C, 800 °C, 850 °C, 900 °C), and held at these temperatures for 1 h under nitrogen atmosphere. The collected black residue was first washed with hydrochloric acid (HCl, 5%) for three times to remove K species, and then washed with enough distilled water until pH 7 was achieved, following which the product was dried overnight and named PGC-X (X indicates temperature). For comparison, GC was also chemically activated by KOH at the same mass ratio (KGC, KOH/GC = 2) and the obtained carbon material was named as KGC-X.2.3 Characterization
Thermogravimetric analysis (TGA) was recorded on SDT Q600 (TA Instruments, USA) from room temperature to 900 °C at a heating rate of 5 °C min−1 under Argon flow. The nitrogen sorption isotherms of various samples were measured at −196 °C on a JW-BK132Z specific surface area analyzer (Beijing JWGB Sci &Tech Co., Ltd., China). The specific surface area was calculated from nitrogen sorption isotherms using the Brunauer–Emmett–Teller (BET) equation. The total pore volume was obtained at relative pressure p/p0 = 0.95. The micropore volume was obtained using the Horvath–Kawazoe (HK) equation. The mesopore and macropore volume were determined from the difference between the total volume and micropore volume. The morphology of various samples was examined by scanning electron microscopy (SEM, LEO-1530, Germany). The crystal structure of the samples were recorded using a Raman spectrometer (LabRam Hr800) and an X-ray diffractometer (XRD, PANalytical, The Netherlands) using Cu/Kα as the radiation source and operating at 40 mA and 40 kV with a scanning range from 5° to 80°. In addition, the surface chemistry of the as-prepared carbons was determined by Fourier-transform infrared spectroscopy (FTIR) spectra (Nicolet 6700 FT-IR, Thermo Fisher Scientific, Inc., USA) and K-Alpha 1063 X-ray photoelectron spectroscopy (XPS, Thermo Fisher Scientific Inc. USA).2.4 Measurement of adsorption
The CO2 adsorption test was performed using a JW-BK132Z static volumetric analyzer (Beijing JWGB Sci &Tech Co., Ltd., China). Before the adsorption test, the samples were activated by evacuation in vacuum at 150 °C for 3 h. CO2 adsorption experiments were performed at 0 °C and 25 °C. The adsorption temperature was controlled by a water bath within ±0.1 °C.2.5 Computational details
First-principles calculations were performed at DMol3 code on the base of DFT to obtain the energy values of the interactions between the oxygen groups and CO2 molecule.20 The generalized gradient approximation (GGA) with the Perdew–Burke–Ernzerhof function (PBE) was chosen to simulate the electron exchange. Atomic orbitals were described by the double numerical basis set with polarization (DNP). Density functional semicore pseudopotentials (DSPP) were adopted to establish the type of core processing. The real-space orbital global cutoff was set to 3.7 Å. The basis set superposition error (BSSE) was not considered in this study since the convergence threshold parameters for the optimization were 10−5 (energy), 2 × 10⁻³ (gradient), and 5 × 10⁻³ (displacement).21 The binding energy (BE) of CO2 molecule adsorbed on the carbon surface was calculated as follows:| BE = Esurface+CO2 − (Esurface + ECO2) |
3. Results and discussions
3.1 The formation of activated carbons
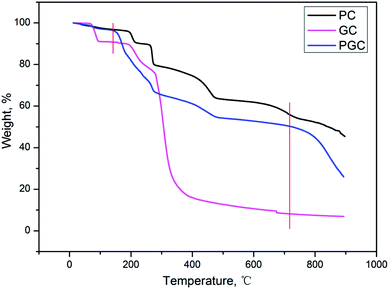
The activation mechanism of PC is quite similar to that of KOH where the K compounds play a crucial role in the generation of micropores,19 which can be described by the following procedure: (a) the pyrolysis of organic moiety with the formation of K2CO3 at a temperature below 700 °C, (b) the decomposition of K2CO3 with the formation of K2O, and (c) the reduction of K2O by carbon with the formation of metallic K at a temperature above 700 °C.TGA was first performed to prove that PC in PGC actually acts as an activator instead of just simply mixing the two different carbons derived from PC and GC. As can be inferred from Fig. 1, the TGA curve of PGC displays two evident sharp declines compared with that of PC and GC. The first decline appears at around 130 °C, which can be attributed to the presence of alkali metal in the mixture. In fact, the oxidation of carbon to form carbon oxide and carbonate can be catalyzed by alkali metals, thus accelerating the decomposition of GC.14 The second decline occurs at around 720 °C, which could be ascribed to the enhanced formation of the carbon-reduced metallic K caused by the extra carbon source from the GC. Indeed, the two sharp declines correspond to the two activation steps as previously described, strongly demonstrating that employing PC as an activator is feasible. Compared with the KOH activation, the PC method showed a notable advantage in increasing the carbon yield to a large extent (about 15% higher) due to the introduction of the extra carbon from PC. Moreover, on employing higher carbonization temperatures (≥800 °C), the activated carbon obtained by the KOH activation could be ignored or considered null.23 In contrast, the PC method was still valid at such severe temperatures for the synthesis of activated carbon.
3.2 Structural and chemical characteristics
As evidenced by nitrogen adsorption–desorption isotherms of various samples in Fig. 2a, the isotherms of activated carbons derived from both KOH and PC methods can be regarded as type I according to IUPAC classification, indicating that micropores were the majority in the porous structure.24,25 However, a distinct hysteresis loop for PGC-900 was observed, suggesting that the mesopores generated with the increase in carbonization temperature.26 This can also be confirmed from the data in Table 1, which suggest that the mesopore volume of the PGC samples gradually increased with the rise in temperature. The BET surface area of the PGC samples increased from 1334 m2 g−1 at 750 °C to 2116 m2 g−1 at 850 °C, and then decreased to 1980 m2 g−1 at 900 °C. However, the total pore volume increased from 0.795 cm3 g−1 at 750 °C to 1.209 cm3 g−1 at 900 °C. Based on the calculated pore size distribution depicted in Fig. 2b, the pores of the as-prepared carbons are mostly micropores distributed in two systems, with size of approximately 0.5 nm and 0.7 nm. Additionally, compared with KGC-750, PGC-750 showed a slightly smaller BET surface area, but analogous pore structure with narrower micropores (<0.7 nm).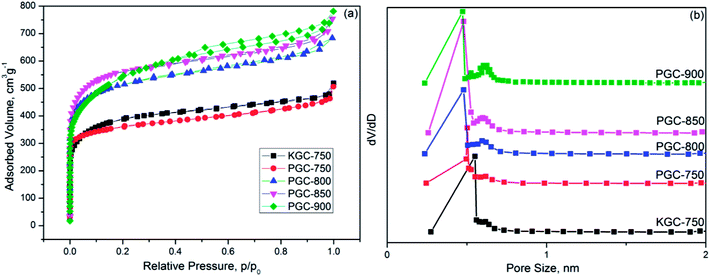 | ||
| Fig. 2 Nitrogen adsorption/desorption isotherms and (a) pore size distribution (b) of the as-prepared samples. | ||
| Samples | SBET m2 g−1 | Vtotal cm3 g−1 | Vmic cm3 g−1 | V(<0.7 nm) cm3 g−1 | Vmes cm3 g−1 |
|---|---|---|---|---|---|
| KGC-750 | 1430 | 0.795 | 0.571 | 0.424 | 0.224 |
| PGC-750 | 1334 | 0.784 | 0.542 | 0.473 | 0.242 |
| PGC-800 | 1914 | 1.057 | 0.768 | 0.604 | 0.298 |
| PGC-850 | 2116 | 1.167 | 0.844 | 0.632 | 0.323 |
| PGC-900 | 1980 | 1.209 | 0.790 | 0.534 | 0.419 |
The morphology of the as-prepared KGC-750 and PGC-750 was quite different, as examined by SEM (Fig. S1†). Unlike the irregular structure presented by KGC-750, flower-like structures are observed on the PGC-750 surface, and this sheet morphology that is typical of carbon-derived from potassium citrate becomes more pronounced.19 The XRD patterns of KGC-750 and PGC-750 are displayed in Fig. S2a†. The two broad and weak peaks at around 25°and 43° correspond to the (002) and (100) planes in hexagonal graphite, respectively,27 indicating a similar disordered and amorphous-like structure of the two samples.28 Moreover, no impurity peaks were found, which proved the complete elimination of potassium compounds achieved by washing with HCl. The graphitization degrees of KGC-750 and PGC-750 were estimated by Raman spectra. Perfectly ordered carbons such as graphite show only one peak at 1582 cm−1, while carbons with disordered morphology generally display two peaks, namely, the graphite (G) peak at 1582 cm−1 and the disorder-induced (D) peak at 1350 cm−1.29 As shown in Fig. S2b†, both KGC-750 and PGC-750 exhibit G and D peaks. Moreover, the intensity ratio ID/IG, which represents the degree of disorder of the two samples was 1.11 and 1.12, demonstrating the disordered amorphous structure with similar graphitization degree in KGC-750 and PGC-750.
FTIR spectra of the as-prepared samples are presented on Fig. S3†. The bands identified in the FTIR spectrum for various samples are roughly consistent and according to previous reports, they can be assigned as follows:30–32 (i) the broad band at 3450 cm−1 to O–H stretching vibrations in hydroxyl, carboxyl groups, or intrinsic moisture; (ii) peak at 1637 cm−1 to C![[double bond, length as m-dash]](https://www.rsc.org/images/entities/char_e001.gif) O stretching vibrations in carboxyl, carbonyl, quinone, or ester groups; (iii) band at 1000–1400 cm−1 to C–O stretching vibrations in hydroxyl and ester groups; and (iv) peak at 810 cm−1 to C–H stretching vibrations.
O stretching vibrations in carboxyl, carbonyl, quinone, or ester groups; (iii) band at 1000–1400 cm−1 to C–O stretching vibrations in hydroxyl and ester groups; and (iv) peak at 810 cm−1 to C–H stretching vibrations.
The evolution of surface chemistry on the as-prepared carbons was further studied by XPS. From the mass ratio of carbon to oxygen listed in Table 2, compared with KGC-750 with an oxygen content of 6.79%, PGC-750 possessed much higher oxygen content of 11.13%, whereas this ratio dropped to 6.20% when the carbonization temperature was raised to 900 °C. Accordingly, this result clearly reveals that the PC method is more conducive to the attachment of oxygen, which is an important issue that must be considered in the synthesis of activated carbon for most applications. Fig. S4† shows the high resolution of C 1s and O 1s photoelectron spectrum for the as-prepared samples. The fitted C 1s XPS spectrum can be assigned to five main peaks at 284.6 eV, 285.6 eV, 286.9 eV, 288.6 eV, and 290.1 eV, corresponding to C![[double bond, length as m-dash]](https://www.rsc.org/images/entities/char_e001.gif) C (C1), C–C (C2), C–O (C3), C
C (C1), C–C (C2), C–O (C3), C![[double bond, length as m-dash]](https://www.rsc.org/images/entities/char_e001.gif) O (C4), and COOH (C5).33,34 Moreover, the change in the type of oxygen-containing functional groups is highlighted by fitting the results of the O 1s spectrum. Peaks with binding energy at around 531.2 eV, 531.9 eV, 532.8 eV, 533.6 eV, and 536.1 eV can be assigned to COOH (O1), C
O (C4), and COOH (C5).33,34 Moreover, the change in the type of oxygen-containing functional groups is highlighted by fitting the results of the O 1s spectrum. Peaks with binding energy at around 531.2 eV, 531.9 eV, 532.8 eV, 533.6 eV, and 536.1 eV can be assigned to COOH (O1), C![[double bond, length as m-dash]](https://www.rsc.org/images/entities/char_e001.gif) O (O2), C–O (O3), O–H (O4), and adsorbed water of oxygen (O5), respectively.35 The contribution of different oxygen-containing functional groups is listed in Table 2. For PGC samples, the O1 and O2 groups gradually decreased with the increase in temperature because of their low thermal stability or conversion to other species.36
O (O2), C–O (O3), O–H (O4), and adsorbed water of oxygen (O5), respectively.35 The contribution of different oxygen-containing functional groups is listed in Table 2. For PGC samples, the O1 and O2 groups gradually decreased with the increase in temperature because of their low thermal stability or conversion to other species.36
| Sample | C (at%) | O (at%) | |||||
|---|---|---|---|---|---|---|---|
| Total | COOH | C![[double bond, length as m-dash]](https://www.rsc.org/images/entities/char_e001.gif) O O |
C–O | OH | H2O/O2 | ||
| KGC-750 | 93.21 | 6.79 | 0.78 | 1.80 | 1.44 | 1.72 | 1.05 |
| PGC-750 | 88.87 | 11.13 | 1.23 | 1.97 | 3.22 | 3.88 | 0.83 |
| PGC-800 | 92.04 | 7.96 | 1.13 | 1.91 | 2.01 | 2.07 | 0.84 |
| PGC-850 | 93.23 | 6.67 | 0.92 | 1.69 | 1.82 | 1.68 | 0.56 |
| PGC-900 | 93.80 | 6.20 | 0.31 | 0.94 | 2.41 | 1.98 | 0.56 |
3.3 CO2 adsorption performance
| Samples | CO2 capture capacity (mmol g−1) | |
|---|---|---|
| 0 °C 1 bar | 25 °C 1 bar | |
| KGC-750 | 4.23 | 2.32 |
| PGC-750 | 5.16 | 3.57 |
| PGC-800 | 5.12 | 2.97 |
| PGC-850 | 4.50 | 2.65 |
| PGC-900 | 3.78 | 2.31 |
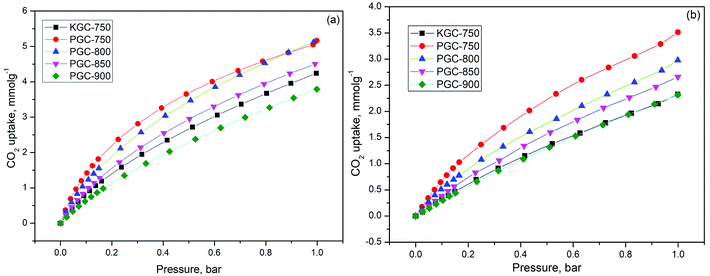
It is widely accepted that the adsorption process is related to both the pore structure and the surface chemistry. First, in order to reveal the influence of structure properties on adsorption, the linear correlation coefficients between different pore volumes and CO2 uptake for various samples were determined and displayed in Fig. S5†. Unfortunately, it was difficult to find any linear relationship between each volume and CO2 uptake. As a matter of fact, in conventional conditions (adsorption temperature: 0–25 °C, pressure: 0–1 bar), the adsorption of CO2 can be described as a volume-filling process. The supermicropore (0.8–2 nm) or mesopore (2–50 nm) structures are not capable of adsorbing enough CO2 molecules at low relative pressures since the enhancement of adsorption energy is negligible for pores that are two times wider than the diameter of the adsorbed molecule (kinetic diameter of CO2 is about 0.33 nm).43 Thus, it is well explained that there is no direct correlation between the CO2 adsorption capacity and the overall structure properties such as surface area, total pore volume, as well as micropore volume.
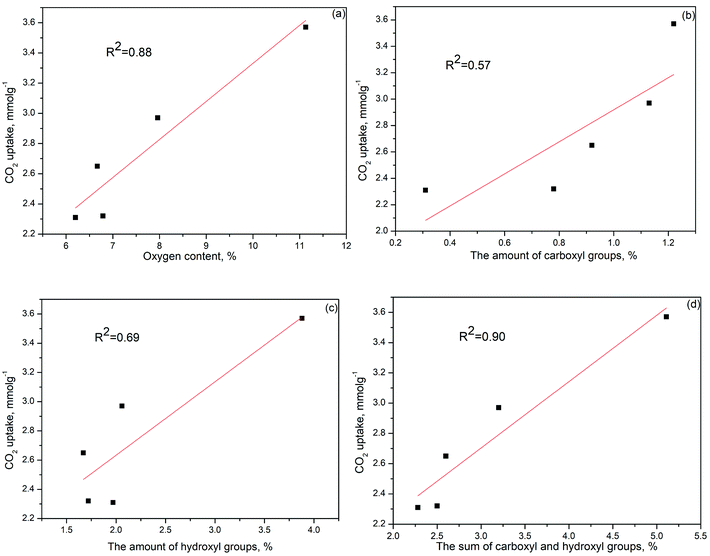
Many studies demonstrated that the CO2 adsorption capacity is mainly determined by the narrow micropore volume (<0.7 nm) since they have large adsorption potential that enhances the filling process for CO2 molecules.44–46 However, based on our result, the PGC-850 sample with the most narrow pore volume of 0.632 cm3 g−1 failed to act as the best CO2 adsorbent. No evident correlation between CO2 uptake at 25 °C and narrow pore volume was observed (Fig. S5d†). Conversely, PGC-750 having the highest oxygen content at 11.13% presented the best CO2 uptake. The linear correlation coefficient between the oxygen content and CO2 uptake was 0.88 (Fig. 4a), which indicated that the CO2 adsorption capacity for the as-prepared samples was almost dominated by oxygen functional groups. We hypothesized that the attached oxygen content could offer extra interactions to CO2 molecules, resulting in a strengthened micropore filling process and therefore a higher utilization of such pores.
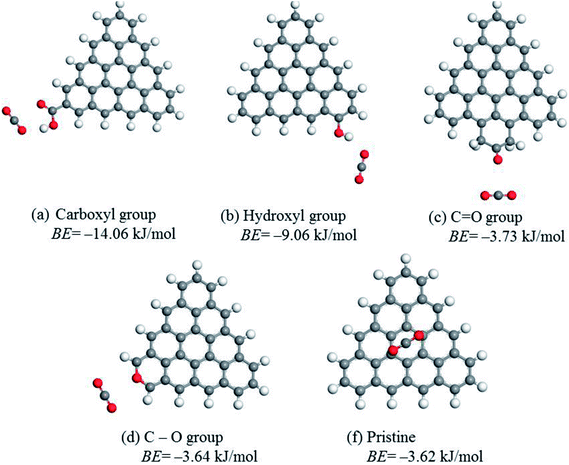
To determine the role of different oxygen groups on CO2 adsorption, the binding energy between CO2 molecules and edge-functionalized activated carbon was calculated using the DFT method. The optimized geometries and the best CO2 adsorption configurations for the functionalized carbon surface are displayed in Fig. 5. The calculated BE values provide a good explanation for oxygen-containing groups on activated carbon favoring the adsorption. The BE values of C![[double bond, length as m-dash]](https://www.rsc.org/images/entities/char_e001.gif) O and C–O groups are −3.73 kJ mol−1 and −3.64 kJ mol−1, respectively, which are similar to the pristine value of −3.62 kJ mol−1. This finding indicates that the effect of C
O and C–O groups are −3.73 kJ mol−1 and −3.64 kJ mol−1, respectively, which are similar to the pristine value of −3.62 kJ mol−1. This finding indicates that the effect of C![[double bond, length as m-dash]](https://www.rsc.org/images/entities/char_e001.gif) O and C–O groups on the enhancement of CO2 adsorption is negligible. However, the BE values of COOH and OH groups are −14.06 kJ mol−1 and −9.06 kJ mol−1, respectively, demonstrating that the two groups have a great positive influence on the CO2 adsorption. Specifically, the distance between O(CO2) and H(COOH) was 2.078 Å and that of O(CO2) and H(OH) was 2.115 Å, which suggests that the interactions between the above atoms are considered as the hydrogen bonding interaction. Similarly, the electrostatic interaction between C(CO2) and O (COOH) also occurred when the distance between the atoms was 2.957 Å.21,53 Despite the fact that both the hydroxyl and the carboxyl groups greatly favored the adsorption of CO2, there was no direct linear relationship between the amounts of hydroxyl or carboxyl groups and CO2 uptake since the linear correlation coefficient of each group is 0.57 (Fig. 4b) and 0.69 (Fig. 4c), respectively. However, the coefficient for the sum of the two groups is much higher (R2 = 0.90), as displayed in Fig. 4d. This value is also close to the correlation coefficient between oxygen content and CO2 uptake (R2 = 0.88), which suggests that the sum value is directly related to the CO2 adsorption. Therefore, a synergistic effect of the hydroxyl and carboxyl groups should be taken into account in order to explain the obtained high CO2 uptake.
O and C–O groups on the enhancement of CO2 adsorption is negligible. However, the BE values of COOH and OH groups are −14.06 kJ mol−1 and −9.06 kJ mol−1, respectively, demonstrating that the two groups have a great positive influence on the CO2 adsorption. Specifically, the distance between O(CO2) and H(COOH) was 2.078 Å and that of O(CO2) and H(OH) was 2.115 Å, which suggests that the interactions between the above atoms are considered as the hydrogen bonding interaction. Similarly, the electrostatic interaction between C(CO2) and O (COOH) also occurred when the distance between the atoms was 2.957 Å.21,53 Despite the fact that both the hydroxyl and the carboxyl groups greatly favored the adsorption of CO2, there was no direct linear relationship between the amounts of hydroxyl or carboxyl groups and CO2 uptake since the linear correlation coefficient of each group is 0.57 (Fig. 4b) and 0.69 (Fig. 4c), respectively. However, the coefficient for the sum of the two groups is much higher (R2 = 0.90), as displayed in Fig. 4d. This value is also close to the correlation coefficient between oxygen content and CO2 uptake (R2 = 0.88), which suggests that the sum value is directly related to the CO2 adsorption. Therefore, a synergistic effect of the hydroxyl and carboxyl groups should be taken into account in order to explain the obtained high CO2 uptake.
3.4 The regeneration performance and selective study of as-prepared samples
The industrial application for the adsorbent requires good regenerability. A total of 4 CO2 adsorption–desorption cyclic studies were performed on PGC-750 when the adsorption temperature was 25 °C and the desorption temperature was 150 °C. Results are depicted in Fig. 7a. After the four cycles, the CO2 adsorption capacity of PGC-750 was 3.48 mmol g−1, which dropped by only 2.52% compared with that of the first cycle. Therefore, this result proved that the as-prepared sample has good reusability.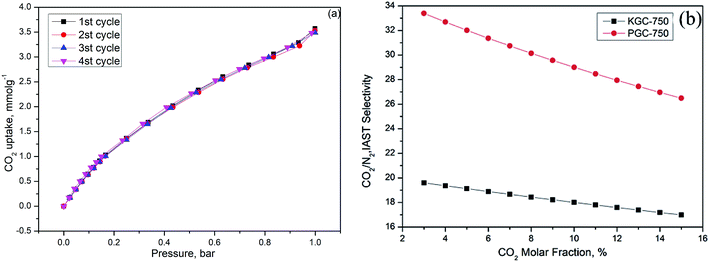 | ||
| Fig. 7 (a) Regeneration performance of PGC-750, (b) CO2/N2 selectivity of KGC-750 and PGC-750 as a function of CO2 molar fraction. | ||
To explore the selective adsorption capacity of the as-prepared activated carbons, the single-component N2 and CO2 adsorption isotherms were collected at 25 °C under pressure of about 1 bar. The ideal adsorption solution theory (IAST) was employed to calculate the selectivity of various samples based on the hypothesis that the mixed fuel gas comprised <15% CO2 and abundant nitrogen at 1 bar. At a given pressure, the adsorption selectivity (S) can be defined as follows:56
4. Conclusions
In summary, a series of high surface area activated carbons were prepared by employing glucose as a carbon precursor and neutral potassium citrate as an activator. The as-prepared carbons show significantly increased BET surface area from 1334 m2 g−1 at 750 °C to 2116 m2 g−1 at 850 °C, which then decreased to 1980 m2 g−1 at 900 °C. Compared with carbon obtained by activation with corrosive KOH, the use of potassium citrate as an activator not only significantly increased the yield of activated carbon (about 15% higher) without sacrificing porosity of carbon, but also favored more oxygen doping.Among all the as-prepared samples, PGC-750 had the lowest BET surface area, the highest oxygen content, and the best CO2 uptake of 5.16 mmol g−1 and 3.57 mmol g−1 at 0 °C and 25 °C, respectively. Combining the DFT simulation results for the binding energy between CO2 molecules and edge-functionalized activated carbons with the linear correlation analysis of oxygen functional groups on the CO2 uptake, we can conclude that the carboxyl and hydroxyl groups effectively enhanced the affinity between the carbon surface and CO2 molecules through either hydrogen-bonding interactions or electrostatic interactions. The as-prepared PGC-750 sample also showed promising CO2/N2 selectivity, which may be very useful in industrial applications.
Conflicts of interest
There are no conflicts to declare.Acknowledgements
This study was supported by the National Nature Science Foundation of China (No. 21376274), the National Key Technology R&D Program of China (No. 2015BAL04B02) and Hunan Collaborative Innovation Center of Building Energy Conservation & Environmental Control.References
- E. Ramasamy and J. Lee, Chem. Commun., 2010, 46, 2136 RSC.
- T. Yildirim and S. Ciraci, Phys. Rev. Lett., 2005, 94, 175501 CrossRef CAS PubMed.
- L. L. Zhang and X. S. Zhao, Chem. Soc. Rev., 2009, 38, 2520 RSC.
- A. Shahtalebi, M. Mar, K. Guérin and S. K. Bhatia, Carbon, 2016, 96, 565–577 CrossRef CAS.
- B. Hu, K. Wang, L. Wu, S. H. Yu, M. Antonietti and M. M. Titirici, Adv. Mater., 2010, 22, 813–828 CrossRef CAS PubMed.
- C. Lu, H. Bai, B. Wu, F. Su and J. F. Hwang, Energy Fuels, 2008, 22, 3050–3056 CrossRef CAS.
- H. Liu, V. R. Cooper, S. Dai and D. Jiang, J. Phys. Chem. Lett., 2012, 3, 3343–3347 CrossRef CAS.
- M. G. Plaza, C. Pevida, A. Arenillas, F. Rubiera and J. J. Pis, Fuel, 2007, 86, 2204–2212 CrossRef CAS.
- K. S. Lakhi, D. H. Park, S. Joseph, S. N. Talapaneni, U. Ravon, K. Al-Bahily and A. Vinu, Chem.–Asian J., 2017, 12, 595 CrossRef CAS PubMed.
- X. Zhang, D. Lin and W. Chen, RSC Adv., 2015, 5, 45136–45143 RSC.
- L. Wei, M. Sevilla, A. B. Fuertes, R. Mokaya and G. Yushin, Adv. Funct. Mater., 2012, 22, 827–834 CrossRef CAS.
- J. Kou and L. B. Sun, J. Mater. Chem. A, 2016, 4, 17299–17307 RSC.
- K. Labus, S. Gryglewicz and J. Machnikowski, Fuel, 2014, 118, 9–15 CrossRef CAS.
- J. Romanos, M. Beckner, T. Rash, L. Firlej, B. Kuchta, P. Yu, G. Suppes, C. Wexler and P. Pfeifer, Nanotechnology, 2012, 23, 015401 CrossRef CAS PubMed.
- K. Y. Foo and B. H. Hameed, Bioresour. Technol., 2011, 102, 9814 CrossRef CAS PubMed.
- G. A. Ferrero, M. Sevilla and A. B. Fuertes, Carbon, 2015, 88, 239–251 CrossRef CAS.
- M. Sevilla and A. Fuertes, J. Mater. Chem. A, 2013, 87, 13738 RSC.
- J. Ludwinowicz and M. Jaroniec, Carbon, 2015, 82, 297–303 CrossRef CAS.
- M. Sevilla and A. B. Fuertes, ACS Nano, 2014, 8, 5069 CrossRef CAS PubMed.
- L. Yang, L. Jing, C. Ming and C. Zheng, Fuel, 2012, 95, 521–527 CrossRef.
- X. Ma, L. Li, C. Ruofei, W. Chunhao, H. Li and W. Shaobin, Appl. Surf. Sci., 2017, 494–502 Search PubMed.
- X. Ma, L. Li, R. Chen, C. Wang, K. Zhou and H. Li, Fuel, 2019, 236, 942–948 CrossRef CAS.
- M. Sevilla, L. Yu, C. O. Ania and M. M. Titirici, ChemElectroChem, 2015, 1, 2138–2145 CrossRef.
- M. Zhu, Z. F. Tong, Z. Zhao, Y. Jiang and Z. Zhao, Ind. Eng. Chem. Res., 2016, 55, 3765–3774 CrossRef CAS.
- X. Ma, L. Li, R. Chen, C. Wang, K. Zhou and H. Li, Appl. Surf. Sci., 2018, 459, 657–664 CrossRef CAS.
- S. Subramanian, G. Pande, W. G. De, J. M. Giraudon, J. F. Lamonier and V. S. Batra, Ind. Crops Prod., 2013, 49, 108–116 CrossRef CAS.
- M. Zhu, K. Zhou, X. Sun, Z. Zhao, Z. Tong and Z. Zhao, Chem. Eng. J., 2017, 660–672 CrossRef CAS.
- G. Liu, Y. Liu, Z. Wang, X. Liao, S. Wu, W. Zhang and M. Jia, Microporous Mesoporous Mater., 2007, 116, 439–444 CrossRef.
- C. M. Babu, K. Binnemans and J. Roosen, Ind. Eng. Chem. Res., 2018, 57, 1487–1497 CrossRef CAS.
- R. Chen, L. Li, Z. Liu, M. Lu, C. Wang, H. Li, W. Ma and S. Wang, J. Air Waste Manage. Assoc., 2017, 67, 713–724 CrossRef CAS PubMed.
- M. Sevilla, J. A. Maciáagulló and A. B. Fuertes, Biomass Bioenergy, 2011, 35, 3152–3159 CrossRef CAS.
- J. Przepiorski, M. Skrodzewicz and A. W. Morawski, Appl. Surf. Sci., 2004, 225, 235–242 CrossRef CAS.
- C. Goel, H. Bhunia and P. K. Bajpai, RSC Adv., 2015, 5, 93563–93578 RSC.
- C. Goel, H. Bhunia and P. K. Bajpai, RSC Adv., 2015, 5, 46568–46582 RSC.
- C. M. Chen, Q. Zhang, X. C. Zhao, B. Zhang, Q. Q. Kong, M. G. Yang, Q. H. Yang, M. Z. Wang, Y. G. Yang and R. Schlögl, J. Mater. Chem., 2012, 22, 14076–14084 RSC.
- W. Zhou, H. Zhang, H. Nie, Y. Ma, Y. Zhang and H. Zhang, ACS Appl. Mater. Interfaces, 2015, 7, 3389–3397 CrossRef CAS PubMed.
- B. Zhu, K. Li, J. Liu, H. Liu, C. Sun, C. E. Snape and Z. Guo, J. Mater. Chem. A, 2014, 2, 5481–5489 RSC.
- J. Wang, I. Senkovska, M. Oschatz, M. Lohe, L. Borchardt, A. Heerwig, Q. Liu and S. Kaskel, J. Mater. Chem. A, 2013, 1, 10951–10961 RSC.
- H. Wei, S. Deng, B. Hu, Z. Chen, B. Wang, J. Huang and G. Yu, Chemsuschem, 2012, 5, 2354–2360 CrossRef CAS PubMed.
- Z. Zhang, B. Wang, C. Zhu, P. Gao, Z. Tang, N. Sun, W. Wei and Y. Sun, J. Mater. Chem. A, 2015, 3, 23990–23999 RSC.
- X. Hu, M. Radosz, K. A. Cychosz and M. Thommes, Environ. Sci. Technol., 2011, 45, 7068–7074 CrossRef CAS PubMed.
- W. Xing, C. Liu, Z. Zhou, L. Zhang, J. Zhou, S. Zhuo, Z. Yan, H. Gao, G. Wang and S. Z. Qiao, Energy Environ. Sci., 2012, 5, 7323–7327 RSC.
- M. Sevilla, J. B. Parra and A. B. Fuertes, ACS Appl. Mater. Interfaces, 2013, 5, 6360 CrossRef CAS PubMed.
- B. Zhu, C. Shang and Z. Guo, ACS Sustainable Chem. Eng., 2016, 1050–1057 CrossRef CAS.
- S. M. Hong, G. Lim, S. H. Kim, J. H. Kim, K. B. Lee and H. C. Ham, Microporous Mesoporous Mater., 2016, 219, 59–65 CrossRef CAS.
- J. Zhou, Z. Li, W. Xing, H. Shen, X. Bi, T. Zhu, Z. Qiu and S. Zhuo, Adv. Funct. Mater., 2016, 26, 7955–7964 CrossRef CAS.
- W. Tian, H. Zhang, H. Sun, A. Suvorova, M. Saunders, M. Tade and S. Wang, Adv. Funct. Mater., 2016, 26, 8650 CrossRef CAS.
- J. Fu, J. Wu, R. Custelcean and D. E. Jiang, J. Colloid Interface Sci., 2015, 438, 191–195 CrossRef CAS PubMed.
- G. P. Hao, W. C. Li, D. Qian and A. H. Lu, Adv. Mater., 2010, 22, 853 CrossRef CAS PubMed.
- S. Feng, W. Li, Q. Shi, Y. Li, J. Chen, Y. Ling, A. M. Asiri and D. Zhao, Chem. Commun., 2014, 50, 329 RSC.
- Y. Liu and J. Wilcox, Environ. Sci. Technol., 2013, 47, 95 CrossRef CAS PubMed.
- B. Ashourirad, P. Arab, T. Islamoglu, K. A. Cychosz, M. Thommes and H. M. Elkaderi, J. Mater. Chem. A, 2016, 4, 14693–14702 RSC.
- A. Torrisi, C. Mellotdraznieks and R. G. Bell, J. Chem. Phys., 2010, 132, 044705 CrossRef PubMed.
- L. Wan, J. Wang, C. Feng, Y. Sun and K. Li, Nanoscale, 2015, 7, 6534–6544 RSC.
- J. Wang, I. Senkovska, M. Oschatz, M. R. Lohe, L. Borchardt, A. Heerwig, Q. Liu and S. Kaskel, J. Mater. Chem. A, 2013, 1, 10951–10961 RSC.
- S. Khalili, B. Khoshandam and M. Jahanshahi, RSC Adv., 2016, 6, 35692–35704 RSC.
Footnote |
| † Electronic supplementary information (ESI) available. See DOI: 10.1039/c8ra05523h |
| This journal is © The Royal Society of Chemistry 2018 |

