 Open Access Article
Comparison of the physical and thermodynamic stability of amorphous azelnidipine and its coamorphous phase with piperazine†
Shuang Du‡
,
Wen Sheng Li‡,
Ya Rong Wu,
Yan Fu,
Caiqin Yang and
Jing Wang *
*
College of Pharmaceutical Sciences, Hebei Medical University, Shijiazhuang, 050017, People’s Republic of China. E-mail: jingwang@home.ipe.ac.cn; Fax: +86-311-86265622; Tel: +86-311-86265622
First published on 21st September 2018
Abstract
A major challenge in drug development is that the majority of drugs are water insoluble, and a powerful method to conquer this obstacle is to transfer a crystalline drug into its amorphous phase (AP) or coamorphous phase (CAP) with a coformer. In the present study, the physical and chemical stabilities of an AP and a CAP based on the dihydropyridine calcium ion antagonist azelnidipine (AZE) were investigated using thermal analysis and a solution chemistry method. The identification of two APs (named α-AP and β-AP, from crystalline α-AZE and β-AZE, respectively) and one AZE-piperazine CAP was attempted using powder X-ray diffraction, temperature modulated differential scanning calorimetry and Fourier-transform infrared spectroscopy. The transition thermodynamics from the two APs and the CAP to stable crystalline β-AZE (β-Cry) were investigated using a solubility method. The solubility of the two APs, the CAP and β-Cry in 0.01 M HCl medium at 298, 304, 310, 316 and 322 K was investigated; the values obtained were used to calculate the thermodynamic parameters of the transition reaction. The transition temperatures of α-AP, β-AP and the CAP to form β-Cry in 0.01 M HCl were 237.7, 400.3, and 231.4 K, respectively. The glass transition temperature (Tg) values of α-AP, β-AP and the CAP were 365.5, 358.9 and 347.6 K, respectively, indicating a high physical stability for α-AP. However, β-AP proved to be the most thermodynamically stable form at room temperature compared with α-AP and CAP in the 0.01 M HCl medium. As evidenced by those observations, no general relationship occurred between the solid physical stability and the solution chemical stability for AP and CAP. The kinetics of the solid-state decomposition, studied using DSC analysis, showed that the activation energies for decomposition of α-AP, β-AP and CAP at high temperatures were 133.0, 114.2 and 131.6 kJ mol−1, respectively.
Introduction
In recent years, the magnitude of research emphasizing the importance of different solid-state forms of a drug, such as crystalline, amorphous, or hydrate forms, in pharmaceutical development and manufacturing has increased significantly.1–4 These forms have different physical, chemical and mechanical properties, which not only affect the processability and stability of the drug product but can also lead to differences in bioavailability. For example, using the amorphous phase (AP) of an active pharmaceutical ingredient (API) can improve the physicochemical properties of an insoluble API. However, the main drawback of using an amorphous API in dosage forms is the limited and largely unpredictable physical stability of the AP in the solid state during manufacturing or storage.5 Another problem of some AP systems is solvent-induced crystallization upon oral application, that is, the thermodynamic stability in solution.6,7The physicochemical properties of the AP can be affected by the preparation method,8 thermal history,9 or starting crystalline form when a cryo-milling preparation method is used.3,10 Differences in the stability and physicochemical properties, regarding APs produced using various preparation techniques, have been reported for indomethacin, dipyridamole, and carbamazepine.8 Amorphous indomethacin prepared using spray drying had some remaining residual crystallinity, and AP samples produced using a grinding procedure had small degrees of undetected crystallinity remaining or differences in the hydrogen bonding in the different APs.8 The results of an investigation by Rades et al. indicate the existence of an AP for cryo-milled simvastatin that is spectrally distinguishable from the quench-cooled AP. The thermodynamic parameters suggest that this form is less disordered compared to the quench-cooled form.11 Furthermore, differences regarding the physical stability and recrystallization behavior for amorphous forms produced from different crystalline starting counterparts by ball-milling have been reported for anhydrate piroxicam form I and form II.3 The results indicate that amorphous piroxicam prepared from crystalline form I had a lower physical stability than that of amorphous piroxicam prepared from form II, which was linked to the higher residual order in the amorphous samples prepared from crystalline form I; the recrystallization behavior of the amorphous samples prepared from anhydrate piroxicam form I was closely related to the starting material, whereas the recrystallization behavior of the amorphous samples prepared from form II resembled that of form III. Because these APs are formed via different intermediate states (melt, solution, solid) or different polymorphic forms, the question arises whether there are indeed differences in the amorphous solids formed. Hancock et al. used the term “pseudopolyamorphism” for those different amorphous forms.12 For true polyamorphs, a first-order transition between them would have to be observed, which has never been seen in any organic substance.11 Although, using melting techniques, the amorphous state is obtained through destruction of the existing molecular order, it is not clear if the differences exist in APs produced from different crystalline starting counterparts by melting or if local molecular order may still be present in the APs.
However, an AP with a high internal energy and specific volume relative to the crystalline state has a possibility that it may undergo partial crystallization during processing (mechanical stress) and storage (temperature and humidity stress) or in a solvent medium. Hence, exploitation of the full potential of amorphous solids requires their stabilization in the solid state and in solvent media as well as during application. A coamorphous phase (CAP), an amorphous combination consisting of the active pharmaceutical ingredient (API) and a small molecule coformer, possesses special advantages in improving the solubility and dissolution rate of the API and enhancing the stability of single amorphous drugs.13–15 For this reason, the CAP is considered as an efficient replacement for drug-polymer molecular association (solid dispersions) and cocrystals. This approach creates solubility advantages and stabilizes the amorphous system through intermolecular interactions, such as hydrogen bonds, and might conquer shortcomings associated with solid dispersions. However, there are very few reports on the thermodynamic mechanism for improving the stability of the CAP compared to the single AP.
Azelnidipine (AZE) is a new long-acting dihydropyridine calcium channel blocker for the treatment of patients with hypertension. It belongs to the group of polymorph drugs that have two, α and β, polymorphs, and the α form is a metastable phase that easily transforms to the β form under suitable conditions. In our previous studies, the thermodynamic stability of crystalline AZE polymorphs was investigated.16 The present paper addresses the question of whether the different polymorphs result in differing forms of the AP using a melting technique. Furthermore, AZE is a good model API to screen API-coformer amorphous combinations and many CAPs were obtained in our previous study.14,15
Based on the above considerations, the purpose of this study is to investigate the physical and thermodynamic stabilities of the AP and CAP and to find out if there is a general rule for the relationship between the physical stability in the solid state and the thermodynamic stability in solution. In this study, we present our results on the measurement of solubility in a 0.01 M HCl solution for different APs prepared from two polymorphs and a new CAP produced from AZE and piperazine (PEZ); the solubility data at different temperatures were used to investigate and evaluate the thermodynamic stability of the CAP compared to the single AP. Furthermore, the physical stability in the solid state and the thermal decomposition of the two APs and the CAP were also investigated.
Experimental
Chemicals
The AZE polymorphs (M = 582.64 g mol−1), α (α-Cry, Tm = 123.0 °C) and β (β-Cry, Tm = 199.0 °C), were purchased from the Wuhan Yuancheng Gongchuang Technology Co., Ltd. Hexahydrate PEZ was supplied by Damao Chemical Reagents Factory (Tianjin, China). All other chemicals in this work were used as received.Preparation of the two APs from the AZE polymorphs
Chemically pure amorphous AZE, confirmed by high performance liquid chromatography (HPLC), was obtained by melting and quench cooling of the α and β crystalline forms. Crystalline form α or β was heated in a stainless steel beaker to 150 °C for α or 240 °C for β in an oven and held at this temperature for 3 min. Then, the resulting melt was taken out of the oven and quenched using liquid nitrogen at once. Subsequently, the resulting melt that had been cooled to room temperature was milled under the conditions of pouring liquid nitrogen; the obtained powder, α-AP or β-AP, was passed through BSS sieve no. 60. The as-prepared APs were retained in a vacuum desiccator until required for characterization.Preparation of the CAPs of AZE and PEZ
The CAPs of α-Cry and PEZ were prepared by grinding a mixture of α-Cry and PEZ for 30 min in a laboratory-scale oscillatory disc mill (Mixer Mill RS200, Retsch GmbH, Dusseldorf, Germany) using a molar ratio of α-Cry/PEZ of 1![[thin space (1/6-em)]](https://www.rsc.org/images/entities/char_2009.gif) :
:![[thin space (1/6-em)]](https://www.rsc.org/images/entities/char_2009.gif) 2 without any other solvents. The mixer mill was stopped every 10 min during the grinding process for 3 min, to scrape the wall of the steel jar and homogenize the mixture. Unnecessary heat generated during grinding was also dispersed during the stopping intervals.
2 without any other solvents. The mixer mill was stopped every 10 min during the grinding process for 3 min, to scrape the wall of the steel jar and homogenize the mixture. Unnecessary heat generated during grinding was also dispersed during the stopping intervals.
Characterization
Powder X-ray diffraction (PXRD)
The solid-state of the crystalline forms, and the APs and CAPs produced from AZE were analyzed on a RINT 2100 X-ray diffractometer (Ultima Rigaku Co., Japan) using a Cu-Kα target with a 0.3 mm receiving slit. Approximately 50 mg of the sample powder was gently consolidated in a glass holder and scanned at 20 kV and 20 mA from 3 to 40° (2θ) at a step size of 0.0002° (2θ). The sample surface was flattened softly to avoid particle orientation before determination.Fourier-transform infrared (FTIR) spectroscopy
FT-IR spectra were recorded on a Bruker Equinox 55 FT-IR spectrometer in the 4000–400 cm−1 range. The spectrum was an average of 40 scans with a spectral resolution of 2 cm−1. The samples were prepared by grinding 4 mg of the sample with 160 mg of spectral grade KBr in an agate mortar.Differential scanning calorimetry (DSC) and temperature modulated differential scanning calorimetry (TMDSC) measurements
DSC and TMDSC were performed using a DSC 214 (NETZSCH Company, Germany) equipped with a refrigerated cooling accessory (IC40) and a data analyzer (Proteus Analysis7.0) under a nitrogen atmosphere. For the TMDSC, the temperature was modulated by 0.5 K every 60 s with a heating rate of 2 K min−1 from 273 to 473 K, to determine the glass transition temperature (Tg) of the APs and CAP. Accurately weighed specimens of about 5 mg were placed in hermetically sealed aluminum pans with empty aluminum pans used as a reference. Thermogravimetric (TG) analysis of the samples was performed using a TG 209 thermogravimetric analysis instrument (NETZSCH company, Germany) at a heating rate of 10 K min−1 from 298 to 723 K with nitrogen purging at a flow rate of 20 mL min−1. To explore the decomposition process of the two APs and the CAP, DSC measurements were performed at heating rates of 10, 20, 30, and 40°C min−1 within the temperature range of 298–723 K. The relationship between the heating rate β and the temperature of solid-state decomposition is given by the Kissinger equation:17β represents the heating rate (K min−1), Tm is the temperature of the first endothermic decomposition peak in the DSC curve, and E is the activation energy of decomposition. Then, a curve was drawn with ln
![[thin space (1/6-em)]](https://www.rsc.org/images/entities/char_2009.gif) β/Tm2 as the Y-coordinate versus 1/Tm as the abscissa. E, the activation energy of solid-state decomposition, can be calculated from the slope of this curve.
β/Tm2 as the Y-coordinate versus 1/Tm as the abscissa. E, the activation energy of solid-state decomposition, can be calculated from the slope of this curve.
Physical stability
The two APs and the CAP samples were stored in a desiccator under 75% RH conditions (saturated NaCl solution) at 40 °C for three weeks. Samples were repeatedly analysed, once a week, using XRD to investigate possible recrystallization.Analysis of the solubility, transition temperature, and thermodynamics
The saturated solubility values of the crystalline forms α and β, the α- and β-AP, and the CAP of AZE-PEZ in 0.01 M HCl medium were determined at 298, 304, 310, 316 and 322 K, respectively. All the APs and CAP were passed through a BSS sieve no. 60 after milling to exclude the impact of particle size on the solubility and dissolution rate. An excess amount of sample was placed in a 50 mL screw-capped vial containing 30 mL of 0.01 M HCl medium under the conditions of oscillation at 150 rpm in a SPH-200B air-bath shaker (Shiping Tech. Co., Ltd., Shanghai, China) for 72 h. The concentration of AZE in the solvent was determined at 259 nm using an UV spectrophotometer (UV-160 A, Shimadzu Co., Japan) after filtering through a 0.45 μm membrane filter. All the samples were tested thrice.As mentioned above, the solubility of the different forms of AZE was investigated; the values obtained were used to calculate the transition temperature and thermodynamic parameters of the transition reaction using the thermodynamics formulas in ref. 16.
Briefly, at standard conditions, when different forms of AZE coexist in solvent, the relationship between ΔGθ, ΔHθ, and ΔSθ of the transition reaction of two forms A and B is given by eqn (1) and (2):
 | (1) |
 | (2) |
According to Henry’s law, we get:
 | (3) |
 | (4) |
T indicates the transition temperature when cA = cB. Then:
| ΔHθA,B = TΔSA,Bθ T = Tt |
Using eqn (3), a line was drawn with ln![[thin space (1/6-em)]](https://www.rsc.org/images/entities/char_2009.gif) c as the Y-axis versus
c as the Y-axis versus  as the X-axis. The Tt can be obtained from the point of intersection of the two curves of the two different forms. Afterwards, using eqn (4), a curve was drawn with ln
![[thin space (1/6-em)]](https://www.rsc.org/images/entities/char_2009.gif) cA/cB as the Y-coordinate versus
cA/cB as the Y-coordinate versus  as the abscissa. The values of ΔHθA,B and ΔSA,Bθ can be calculated according to the slope and intercept of the curves, and the value of ΔGA,Bθ was obtained from:
| ΔGA,Bθ = ΔHθA,B − TΔSA,Bθ. |
Results and discussion
Identification and characterization of the AP and CAP
![[thin space (1/6-em)]](https://www.rsc.org/images/entities/char_2009.gif) :
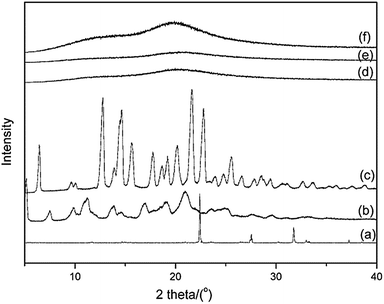
:![[thin space (1/6-em)]](https://www.rsc.org/images/entities/char_2009.gif) 2 for 30 min, the XRD peaks attributed to α-Cry disappeared and a clear halo pattern was observed (Fig. 1f), indicating the formation of a CAP of AZE and PEZ.
2 for 30 min, the XRD peaks attributed to α-Cry disappeared and a clear halo pattern was observed (Fig. 1f), indicating the formation of a CAP of AZE and PEZ.
![[thin space (1/6-em)]](https://www.rsc.org/images/entities/char_2009.gif) :
:![[thin space (1/6-em)]](https://www.rsc.org/images/entities/char_2009.gif) 2 showed a lower Tg, which seemingly followed the observation reported by Dengale et al.,18 stating that the Tg of a binary amorphous system tends to be closer to the Tg of the component present in excess within the mixture. So, although the Tg value of the native PEZ amorphous phase was not obtained in our study, the low Tg value of the AZE-PEZ CAP depends largely on the PEZ. More evidence was deduced from the result of the Tg of a curcumin-PEZ CAP. Although pure amorphous curcumin has a higher Tg of 82 °C, the Tg of the curcumin-PEZ CAP was lowered to 33 °C owing to the introduction of PEZ.19 Fortunately, the Tg of the AZE-PEZ CAP is much higher than room temperature, which would make it possible for it to be developed as an actual pharmaceutical composition.
2 showed a lower Tg, which seemingly followed the observation reported by Dengale et al.,18 stating that the Tg of a binary amorphous system tends to be closer to the Tg of the component present in excess within the mixture. So, although the Tg value of the native PEZ amorphous phase was not obtained in our study, the low Tg value of the AZE-PEZ CAP depends largely on the PEZ. More evidence was deduced from the result of the Tg of a curcumin-PEZ CAP. Although pure amorphous curcumin has a higher Tg of 82 °C, the Tg of the curcumin-PEZ CAP was lowered to 33 °C owing to the introduction of PEZ.19 Fortunately, the Tg of the AZE-PEZ CAP is much higher than room temperature, which would make it possible for it to be developed as an actual pharmaceutical composition.
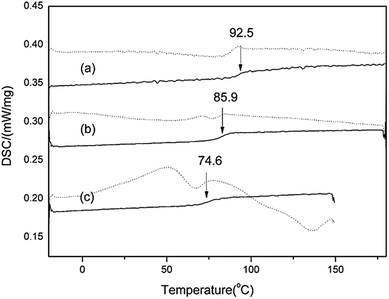 | ||
| Fig. 2 TMDSC total heat flow signal (dash) and reversing heat flow signal (solid) for AZE amorphous systems: (a) α-AP; (b) β-AP; (c) α-AZE-PEZ CAP. TMDSC curves of the two APs were obtained from the data presented by Pan et al.15 | ||
![[double bond, length as m-dash]](https://www.rsc.org/images/entities/char_e001.gif) O–R stretching vibration is pronounced, then in the range 1000–1300 cm−1 where C–O was observed, and in the range 800–860 cm−1 where absorption bands were present due to C–H vibrations of benzene rings.16
O–R stretching vibration is pronounced, then in the range 1000–1300 cm−1 where C–O was observed, and in the range 800–860 cm−1 where absorption bands were present due to C–H vibrations of benzene rings.16Here, we focus on the differences between crystalline and amorphous forms. IR spectroscopy is used extensively to investigate hydrogen bonding because the peak position of the X–H stretch is very sensitive to the extent of association. Peak positions and assignments for selected interesting peaks which are related to hydrogen bonding for the crystalline and amorphous phases (AP and CAP) are shown in Fig. 3. The spectra of polymorphs α and β were compared with their amorphous counterparts to clarify the nature of the hydrogen bond interactions in the amorphous phase. Apparently, in addition to a broadening of the peaks in the amorphous sample, changes in peak shape, intensity, and position between the crystalline phases and their amorphous counterparts have occurred in the IR spectra. As can be seen in the spectrum of α-AP (Fig. 3d), the N–H peak has shifted slightly by 2 cm−1 to a higher wavenumber; simultaneously, the peaks for the C![[double bond, length as m-dash]](https://www.rsc.org/images/entities/char_e001.gif) O groups merged into one peak. Generally, an unbonded X–H stretch gives rise to a relatively sharp peak, whereas on formation of a hydrogen bond X–H⋯Y (where Y is the acceptor atom), the peak shifts to a lower wavenumber and becomes much broader.20 The downward shift is caused by the lengthening of the X–H bond, which occurs on hydrogen bond formation. Based on this consideration, a stronger hydrogen bond will lengthen X–H more and produce a shift to a lower wavenumber. In contrast to the crystalline state, a small upward shift of the N–H vibration occurred for the amorphous α, indicating that the hydrogen bond strength slightly increased or remained almost unchanged with loss of order in the crystalline structure.
O groups merged into one peak. Generally, an unbonded X–H stretch gives rise to a relatively sharp peak, whereas on formation of a hydrogen bond X–H⋯Y (where Y is the acceptor atom), the peak shifts to a lower wavenumber and becomes much broader.20 The downward shift is caused by the lengthening of the X–H bond, which occurs on hydrogen bond formation. Based on this consideration, a stronger hydrogen bond will lengthen X–H more and produce a shift to a lower wavenumber. In contrast to the crystalline state, a small upward shift of the N–H vibration occurred for the amorphous α, indicating that the hydrogen bond strength slightly increased or remained almost unchanged with loss of order in the crystalline structure.
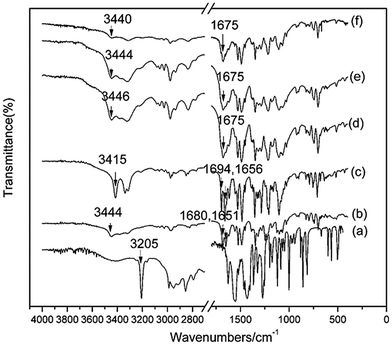 | ||
| Fig. 3 FT-IR spectra of crystalline and amorphous phases of AZE. (a) PEZ; (b) α-Cry; (c) β-Cry; (d) α-AP; (e) β-AP; (f) CAP of AZE-PEZ. | ||
A similar type of analysis of the IR spectral data was carried out for β-Cry and β-AP. On comparing with β-Cry, the N–H peak is broader and has shifted dramatically by 30 cm−1 to a higher wavenumber for β-AP. Moreover, the peaks for the C![[double bond, length as m-dash]](https://www.rsc.org/images/entities/char_e001.gif) O groups also merged into one peak. A large upward shift of the N–H vibration in β-AP indicates that the hydrogen bond strength dramatically decreases with loss of the crystalline structure. It seems amazing that hydrogen bond strength slightly increases for form α but decreases for form β when the crystalline structure is destroyed. This difference may be derived from the differences in the crystalline structure between α-Cry and β-Cry. Single crystal XRD analysis revealed that β-Cry crystallized in an acentric space group of Pca21, in which hydrogen bonds played a crucial role in the 1D, 2D network in the crystal structure.14 When the crystal structure is destroyed, hydrogen bond interactions in β-Cry, which are responsible for stabilization the crystal structure, disappear. The reformed hydrogen bonds in the amorphous form are weaker than those in the crystalline form. Unfortunately, a single crystal of α-Cry has not been obtained and no crystal structure is referenced. Due to an almost unchanging hydrogen bond strength before and after transferring from the crystalline to amorphous phase, we can deduce reasonably that π⋯π intermolecular interactions but not hydrogen bonds play an important role in the crystal structure of α-Cry.
O groups also merged into one peak. A large upward shift of the N–H vibration in β-AP indicates that the hydrogen bond strength dramatically decreases with loss of the crystalline structure. It seems amazing that hydrogen bond strength slightly increases for form α but decreases for form β when the crystalline structure is destroyed. This difference may be derived from the differences in the crystalline structure between α-Cry and β-Cry. Single crystal XRD analysis revealed that β-Cry crystallized in an acentric space group of Pca21, in which hydrogen bonds played a crucial role in the 1D, 2D network in the crystal structure.14 When the crystal structure is destroyed, hydrogen bond interactions in β-Cry, which are responsible for stabilization the crystal structure, disappear. The reformed hydrogen bonds in the amorphous form are weaker than those in the crystalline form. Unfortunately, a single crystal of α-Cry has not been obtained and no crystal structure is referenced. Due to an almost unchanging hydrogen bond strength before and after transferring from the crystalline to amorphous phase, we can deduce reasonably that π⋯π intermolecular interactions but not hydrogen bonds play an important role in the crystal structure of α-Cry.
Using IR spectral data, the hydrogen bonding strength and pattern can be elucidated for the polymorphs and APs by monitoring the N–H (hydrogen bonding donor) and C![[double bond, length as m-dash]](https://www.rsc.org/images/entities/char_e001.gif) O (hydrogen bonding acceptor) stretching frequency. In α-Cry and β-Cry, the extent of variation in the N–H and C
O (hydrogen bonding acceptor) stretching frequency. In α-Cry and β-Cry, the extent of variation in the N–H and C![[double bond, length as m-dash]](https://www.rsc.org/images/entities/char_e001.gif) O peak positions suggests a difference in the hydrogen bonding patterns and thus in the strengths, which is consistent with the crystallographic data. However, the widths of the N–H and C
O peak positions suggests a difference in the hydrogen bonding patterns and thus in the strengths, which is consistent with the crystallographic data. However, the widths of the N–H and C![[double bond, length as m-dash]](https://www.rsc.org/images/entities/char_e001.gif) O peaks of the AP were greater than for the crystalline counterparts, which is consistent with a broader distribution of hydrogen bond lengths in the disordered phase. From Fig. 3, it was apparent, perhaps somewhat surprisingly, that form α appeared to have stronger hydrogen bonding on average in the amorphous state than in the crystalline state, while for form β, the opposite situation was observed, and the hydrogen bonding weakens on changing from the ordered to the disordered state. Obviously, there is no difference in the hydrogen bonding pattern and strength between α-AP and β-AP, but the opposite situation was observed for α-Cry and β-Cry. Different energetic barriers exist for rearrangement within the amorphous phase prior to crystallization depending on the differences in molecular association between α-Cry and β-Cry. There are few studies comparing the two polymorphs and amorphous forms. Based on the above observations, we can speculate that a weakening of the hydrogen bonding on progressing from an ordered to a disordered phase is probably more typical for form β than for form α because crystalline β is a stable form, in which hydrogen bonding interactions play a crucial role in the molecular packing.
O peaks of the AP were greater than for the crystalline counterparts, which is consistent with a broader distribution of hydrogen bond lengths in the disordered phase. From Fig. 3, it was apparent, perhaps somewhat surprisingly, that form α appeared to have stronger hydrogen bonding on average in the amorphous state than in the crystalline state, while for form β, the opposite situation was observed, and the hydrogen bonding weakens on changing from the ordered to the disordered state. Obviously, there is no difference in the hydrogen bonding pattern and strength between α-AP and β-AP, but the opposite situation was observed for α-Cry and β-Cry. Different energetic barriers exist for rearrangement within the amorphous phase prior to crystallization depending on the differences in molecular association between α-Cry and β-Cry. There are few studies comparing the two polymorphs and amorphous forms. Based on the above observations, we can speculate that a weakening of the hydrogen bonding on progressing from an ordered to a disordered phase is probably more typical for form β than for form α because crystalline β is a stable form, in which hydrogen bonding interactions play a crucial role in the molecular packing.
When the small molecule PEZ was introduced to destroy the order of the crystal structure of AZE, the same peak broadening in the IR spectrum occurred for AZE-PEZ CAP. Furthermore, compared with the crystalline AZE, a downward shift of the C![[double bond, length as m-dash]](https://www.rsc.org/images/entities/char_e001.gif) O vibration and disappearance of the N–H vibration from PEZ for the AZE-PEZ CAP indicated that hydrogen bonding occurred in the AZE-PEZ heterodimer and that the hydrogen bond strength increased in the heterodimer compared to the homogenous dimer. Furthermore, as can be seen in the spectra of the AP and CAP, the vibrations derived from the hydrogen bonding donors and acceptors in the AP and CAP appear at almost the same wavenumbers, suggesting the random weak interactions in the disordered phases are somewhat identical regardless hetero (AP) or homogenous (CAP) combination.
O vibration and disappearance of the N–H vibration from PEZ for the AZE-PEZ CAP indicated that hydrogen bonding occurred in the AZE-PEZ heterodimer and that the hydrogen bond strength increased in the heterodimer compared to the homogenous dimer. Furthermore, as can be seen in the spectra of the AP and CAP, the vibrations derived from the hydrogen bonding donors and acceptors in the AP and CAP appear at almost the same wavenumbers, suggesting the random weak interactions in the disordered phases are somewhat identical regardless hetero (AP) or homogenous (CAP) combination.
Thermodynamic stability of the AZE-based AP and CAP
Following characterization of the AP and CAP of AZE, we tried to understand the thermodynamic relationships between the different forms of AZE, especially between the AP (or CAP) and crystalline phase. In the present study, solubility measurements were used to determine the transition temperature (Tt) and relative stability of the AP and CAP. Temperature-dependent solubility data in a 0.01 M HCl medium at 298, 304, 310, 316 and 322 K for the AZE systems were determined and are shown in Table 1. Obviously, α-AP and CAP showed a higher solubility than that of crystalline AZE at the investigated temperatures. Unexpectedly, the solubility of β-AP was lower than that of crystalline AZE in the 0.01 M HCl medium.| Sample | Temperature (K) | ||||
|---|---|---|---|---|---|
| 298 | 304 | 310 | 316 | 322 | |
| α-Cry | 77.45 ± 2.85 | 132.38 ± 8.47 | 170.59 ± 13.30 | 240.18 ± 11.32 | 333.21 ± 5.47 |
| α-AP | 122.32 ± 4.01 | 188.34 ± 9.65 | 255.86 ± 13.72 | 310.59 ± 16.11 | 469.47 ± 9.33 |
| CAP | 117.97 ± 6.54 | 153.31 ± 3.82 | 217.76 ± 2.07 | 263.93 ± 14.35 | 420.81 ± 30.00 |
| β-Cry | 57.09 ± 0.75 | 82.49 ± 3.79 | 100.87 ± 8.62 | 117.69 ± 5.98 | 166.47 ± 6.42 |
| β-AP | 16.10 ± 1.22 | 24.37 ± 2.24 | 31.06 ± 0.70 | 38.19 ± 1.51 | 79.00 ± 5.59 |
Based on the solubility data, curves were drawn with ln![[thin space (1/6-em)]](https://www.rsc.org/images/entities/char_2009.gif) c as the Y-coordinate versus 1/T × 103 as the abscissa (Fig. 4). Tt can be obtained from the point of intersection of the two curves. The values of ΔHθα-AP, ΔHθβ-AP and ΔHθCAP obtained from the slopes of the curves were 36.31, 40.85, and 34.44 kJ mol−1, respectively. Since β-Cry was thermodynamically stable at room temperature,12 we especially discuss the transition reactions of three different transition pairs α-AP/β-Cry, β-AP/β-Cry, and CAP/β-Cry. Based on the solubility data of α-AP, β-AP, CAP and β-Cry, curves were drawn with ln
c as the Y-coordinate versus 1/T × 103 as the abscissa (Fig. 4). Tt can be obtained from the point of intersection of the two curves. The values of ΔHθα-AP, ΔHθβ-AP and ΔHθCAP obtained from the slopes of the curves were 36.31, 40.85, and 34.44 kJ mol−1, respectively. Since β-Cry was thermodynamically stable at room temperature,12 we especially discuss the transition reactions of three different transition pairs α-AP/β-Cry, β-AP/β-Cry, and CAP/β-Cry. Based on the solubility data of α-AP, β-AP, CAP and β-Cry, curves were drawn with ln![[thin space (1/6-em)]](https://www.rsc.org/images/entities/char_2009.gif) cA/cB as the Y-coordinate versus 1/T × 103 as the abscissa (Fig. S1†); the corresponding thermodynamic parameters and Tt for the transition reactions are listed in Table 2. The Tt values of the transition pairs α-AP/β-Cry and CAP/β-Cry were 237.5 K and 231.4 K, respectively, suggesting that α-AP and CAP are stable below those Tt values and β-Cry is stable above those Tt values, for example, at room temperature. While, the pair of β-AP/β-Cry showed a Tt of 400.3 K, indicating that the stable temperature range of β-AP is below this Tt value. β-AP manifested a broader stable temperature range compared to α-AP and CAP, including room temperature (ΔGθ > 0 meaning a nonspontaneous reaction of transition from β-AP to β-Cry at room temperature). However, α-AP and CAP were not stable at room temperature, they transformed to β-Cry spontaneously with a value of ΔGθ < 0 (Table 2).
cA/cB as the Y-coordinate versus 1/T × 103 as the abscissa (Fig. S1†); the corresponding thermodynamic parameters and Tt for the transition reactions are listed in Table 2. The Tt values of the transition pairs α-AP/β-Cry and CAP/β-Cry were 237.5 K and 231.4 K, respectively, suggesting that α-AP and CAP are stable below those Tt values and β-Cry is stable above those Tt values, for example, at room temperature. While, the pair of β-AP/β-Cry showed a Tt of 400.3 K, indicating that the stable temperature range of β-AP is below this Tt value. β-AP manifested a broader stable temperature range compared to α-AP and CAP, including room temperature (ΔGθ > 0 meaning a nonspontaneous reaction of transition from β-AP to β-Cry at room temperature). However, α-AP and CAP were not stable at room temperature, they transformed to β-Cry spontaneously with a value of ΔGθ < 0 (Table 2).
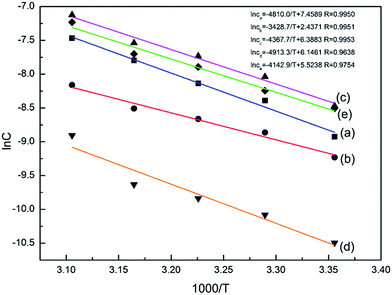 | ||
Fig. 4 Curves of ln![[thin space (1/6-em)]](https://www.rsc.org/images/entities/char_2009.gif) c vs. 1000/T for the AZE systems in 0.01 M HCl medium: (a) α-Cry; (b) β-Cry; (c) α-AP; (d) β-AP; (e) α-AZE-PEZ CAP. c vs. 1000/T for the AZE systems in 0.01 M HCl medium: (a) α-Cry; (b) β-Cry; (c) α-AP; (d) β-AP; (e) α-AZE-PEZ CAP. | ||
| T (K) | ΔGθ (kJ mol−1) | ΔHθ (kJ mol−1) | ΔSθ (J mol−1 K−1) | Tt (K) | |
|---|---|---|---|---|---|
| α-AP, β-Cry | 298 | −1.89 | 9.24 | 37.36 | 237.5 |
| 304 | −2.11 | ||||
| 310 | −2.34 | ||||
| 316 | −2.56 | ||||
| 322 | −2.79 | ||||
| β-AP, β-Cry | 298 | 3.31 | 14.91 | 38.93 | 400.3 |
| 304 | 3.07 | ||||
| 310 | 2.84 | ||||
| 316 | 2.61 | ||||
| 322 | 2.37 | ||||
| CAP, β-Cry | 298 | −1.61 | 7.77 | 31.47 | 231.4 |
| 304 | −1.80 | ||||
| 310 | −1.99 | ||||
| 316 | −2.18 | ||||
| 322 | −2.37 |
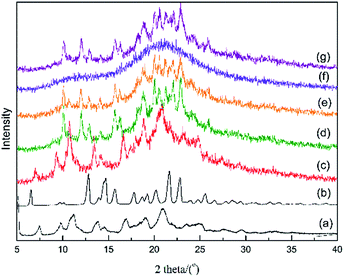
To verify the stability of the two APs and CAP in 0.01 M HCl solution, the remaining solids were collected and subjected to PXRD analysis after determination of the solubility of the crystalline and amorphous samples at room temperature; the patterns are shown in Fig. 5. For α- and β-Cry, the PXRD patterns showed subtle changes, such as the appearance of small new peaks, before and after the dissolving-recrystallization process in HCl medium (Fig. 5c and d). This indicated that AZE is ionized partially in a strong acid medium owing to the existence of -N-H in the molecular structure. In the PXRD patterns of the solids from the suspensions after solubility determination of the α-AP and CAP, peaks assigned to β-Cry emerged, indicating that α-AP and CAP are unstable in the 0.01 M HCl medium and transformed to β-Cry at room temperature (Fig. 5e and g). β-AP had maintained its amorphous nature after the solution procedure (Fig. 5f), which is consistent with the results deduced from the Tt values that β-AP is stable at room temperature in the 0.01 M HCl medium.
Physical stability
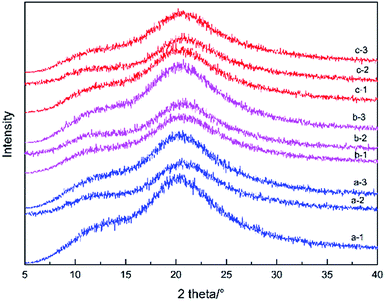
All the APs and the CAP remained physically stable for at least one year at room temperature under dry conditions, which was evidenced by typical amorphous halo XRD patterns and a single Tg peak in the TMDSC scans (data not shown). Furthermore, the two APs and the CAP remained amorphous at 40 °C/75% RH during a three-week accelerated experiment (Fig. 6). As mentioned above, the physical stability of the amorphous solid state is relevant to the Tg. The two APs and the CAP showed a high Tg of more than 70 °C, which is far from room temperature, suggesting a high physical stability under storage conditions. So, the CAP, with a high solubility and physical storage stability, was proven to be a potential solid form for application.Kinetics of solid-state decomposition
DSC curves of α-AP, β-AP and CAP at various temperatures are presented in Fig. 7 and 8. Based on the exothermic peak temperature corresponding to decomposition, curves were drawn with 1000/T as the abscissa versus ln![[thin space (1/6-em)]](https://www.rsc.org/images/entities/char_2009.gif) β/Tm2 as the Y-coordinate. The thermal decomposition activation energies are listed in Table 3. The difference in the activation energy between the α-AP and β-AP can be obtained from Table 3. As mentioned above for the TMDSC, the α- and β-APs showed minor differences at Tg owing to different crystalline starting counterparts and different melting temperatures. So, we speculated that some different local and short-range order exists in the α- and β-APs, which results in variation in the activation energy of solid-state decomposition. For the CAP, two endothermic peaks with less than a 10% weight loss were observed before 200 °C in the DSC (Fig. 8B) and TGA-TG (Fig. 8A) curves, which were due to the loss of absorbed solvent/water and crystal water. The exothermic peaks about 310 °C were due to decomposition of the CAP. No obvious exothermic peak due to decomposition of the PEZ in the CAP appeared in the DSC scan (Fig. 8B), but appearance of a minor peak at 280 °C in the DTG curve indicated decomposition of the PEZ. Here, we focus on the decomposition of the AZE in the CAP, that is, the event corresponding to the peak at 320 °C in the DTG curve. Based on the decomposition temperatures of the AZE in the CAP at different scan rates, the activation energy of solid-state decomposition for the AZE in the CAP was calculated. Interestingly, the activation energies for solid-state decomposition of the α-AP and the AZE in the CAP were almost identical (Table 3). As mentioned above, the AZE-PEZ CAP was prepared using α-Cry as the precursor using a grinding method, while α-AP was obtained through a melting and quench cooling method. It seemed that the remaining AP in the CAP after decomposition of the PEZ had the same local and short-range order as the intact α-AP, because they came from same precursor, α-Cry.
β/Tm2 as the Y-coordinate. The thermal decomposition activation energies are listed in Table 3. The difference in the activation energy between the α-AP and β-AP can be obtained from Table 3. As mentioned above for the TMDSC, the α- and β-APs showed minor differences at Tg owing to different crystalline starting counterparts and different melting temperatures. So, we speculated that some different local and short-range order exists in the α- and β-APs, which results in variation in the activation energy of solid-state decomposition. For the CAP, two endothermic peaks with less than a 10% weight loss were observed before 200 °C in the DSC (Fig. 8B) and TGA-TG (Fig. 8A) curves, which were due to the loss of absorbed solvent/water and crystal water. The exothermic peaks about 310 °C were due to decomposition of the CAP. No obvious exothermic peak due to decomposition of the PEZ in the CAP appeared in the DSC scan (Fig. 8B), but appearance of a minor peak at 280 °C in the DTG curve indicated decomposition of the PEZ. Here, we focus on the decomposition of the AZE in the CAP, that is, the event corresponding to the peak at 320 °C in the DTG curve. Based on the decomposition temperatures of the AZE in the CAP at different scan rates, the activation energy of solid-state decomposition for the AZE in the CAP was calculated. Interestingly, the activation energies for solid-state decomposition of the α-AP and the AZE in the CAP were almost identical (Table 3). As mentioned above, the AZE-PEZ CAP was prepared using α-Cry as the precursor using a grinding method, while α-AP was obtained through a melting and quench cooling method. It seemed that the remaining AP in the CAP after decomposition of the PEZ had the same local and short-range order as the intact α-AP, because they came from same precursor, α-Cry.
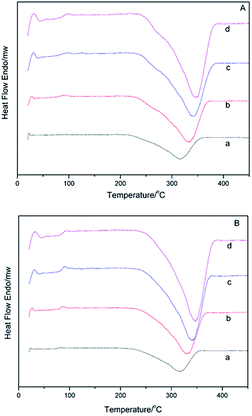 | ||
| Fig. 7 DSC curves for the α-AP (A) and β-AP (B) systems at different heating rates: (a) 10 °C min−1; (b) 20 °C min−1; (c) 30 °C min−1; (d) 40 °C min−1. | ||
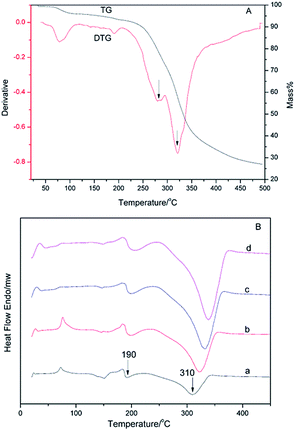 | ||
| Fig. 8 (A) DTG and TG curves for the AZE-PEZ CAP (20 °C min−1) and (B) DSC curves for the AZE-PEZ CAP at different heating rates: (a) 10 °C min−1; (b) 20 °C min−1; (c) 30 °C min−1; (d) 40 °C min−1. | ||
| Sample | β (°C min−1) | Tm/K | 1/Tm × 1000 | ln (β/Tm2) | r | E (kJ mol−1) |
|---|---|---|---|---|---|---|
| α-AP | 10 | 590 | 1.695 | −10.458 | 0.9874 | 133.0 |
| 20 | 605 | 1.652 | −9.816 | |||
| 30 | 615 | 1.625 | −9.443 | |||
| 40 | 617 | 1.618 | −9.164 | |||
| β-AP | 10 | 587 | 1.704 | −10.447 | 0.9944 | 114.2 |
| 20 | 601 | 1.663 | −9.802 | |||
| 30 | 614 | 1.629 | −9.439 | |||
| 40 | 620 | 1.614 | −9.170 | |||
| CAP | 10 | 583 | 1.716 | −10.43 | 0.9866 | 131.6 |
| 20 | 595 | 1.682 | −9.780 | |||
| 30 | 605 | 1.653 | −9.409 | |||
| 40 | 611 | 1.636 | −9.143 |
Conclusion
Generally, APs prepared by grinding, unlike those prepared by melting, usually possess characteristics of the original polymorph, that is, “polymorphic memory”, which would direct recrystallization toward the original polymorph.21 However, in the present study, two different APs were obtained and verified from two different polymorphs of AZE. Although, the two APs were obtained using a melting technique, in which the existing molecular long-range order was destroyed, the differences in the Tg, solubility, stability and thermal decomposition activation energy values of the two APs indicated differences in the local and short-range molecular order of the two APs. This phenomenon probably stems from the major difference in the melting points of the two polymorphs of AZE (129 vs. 199 °C). α-AP, with the highest Tg, was found to be thermodynamically unstable in the HCl medium, suggesting that no general relationship occurred between the solid physical stability and solution chemical stability for the APs and CAP. The thermodynamic parameters and precipitation tests have demonstrated that the CAP and α-AP of AZE, with higher physical stabilities and solubilities, are interesting options to explore when formulating poorly soluble drugs.Conflicts of interest
There are no conflicts to declare.Acknowledgements
Financial support of this work by the National Natural Science Funds of China (Grant No. 81202504) and the Natural Science Foundation of Hebei Province (Grant No. H2017206214, 2016206096) is greatly acknowledged. Thanks are also due to the Education Department of Hebei Province of China for funding through the innovative hundred talents support program (SLRC2017047).References
- K. Lehmkemper, S. O. Kyeremateng, O. Heinzerling, M. Degenhardt and G. Sadowski, Mol. Pharmaceutics, 2017, 14, 157–171 CrossRef PubMed.
- H. Meng-Lund, G. Kasten, K. T. Jensen, A. Poso, T. Pantsar, T. Rades, J. Rantanen and H. Grohganz, Eur. J. Pharm. Sci., 2018, 119, 31–38 CrossRef PubMed.
- K. Naelapää, J. P. Boetker, P. Veski and J. Rantanen, Int. J. Pharm., 2012, 429(1–2), 69–77 CrossRef PubMed.
- R. Paus, Y. Ji, F. Braak and G. Sadowski, Ind. Eng. Chem. Res., 2015, 54(2), 731–742 CrossRef.
- B. C. Hancock and G. Zografi, J. Pharm. Sci., 1997, 86(1), 1–12 CrossRef PubMed.
- J. Aaltonen and T. Rades, Dissolution Technol., 2009, 16(2), 47–54 CrossRef.
- B. Hancock and M. Parks, Pharm. Res., 2000, 17(4), 397–404 CrossRef.
- M. Savolainen, A. Heinz, C. Strachan, K. Gordon, J. Yliruusi, T. Rades and N. Sandler, Eur. J. Pharm. Sci., 2007, 30(2), 113–123 CrossRef PubMed.
- R. Surana, A. Pyne and R. Suryanarayanan, Pharm. Res., 2004, 21(7), 1167–1176 CrossRef.
- K. J. Crowley and G. Zografi, J. Pharm. Sci., 2010, 91(2), 492–507 CrossRef.
- K. A. Graeser, C. J. Strachan, J. E. Patterson, K. C. Gordon and T. Rades, Cryst. Growth Des., 2008, 8(1), 128–135 CrossRef.
- B. C. Hancock and M. Parks, Pharm. Res., 2000, 17(4), 397–404 CrossRef.
- K. Lobmann, R. Laitinen, H. Grohganz, K. C. Gordon, C. Strachan and T. Rades, Mol. Pharm., 2011, 8(5), 1919–1928 CrossRef PubMed.
- Y. Han, Y. Pan, J. Lv, W. Guo and J. Wang, Powder Technol., 2016, 291, 110–120 CrossRef.
- Y. Pan, W. Pang, J. Lv, J. Wang, C. Yang and W. Guo, J. Pharm. Biomed. Anal., 2017, 138, 302–315 CrossRef PubMed.
- D. Li, M. Wang, C. Yang, J. Wang and G. Ren, Chem. Pharm. Bull., 2012, 60(8), 995–1002 CrossRef PubMed.
- P. Budrugeac, E. Segal and J. Therm, Anal. Calorim., 2007, 88(3), 703–707 CrossRef.
- S. J. Dengale, S. S. Hussen, B. S. Krishna, P. B. Musmade, G. G. Shenoy and K. Bhat, Eur. J. Pharm. Biopharm., 2015, 89, 329–338 CrossRef PubMed.
- W. Pang, J. Lv, S. Du, J. Wang, J. Wang and Y. Zeng, Mol. Pharmaceutics, 2017, 14(9), 3013–3024 CrossRef PubMed.
- X. C. Tang, M. J. Pikal and L. S. Taylor, Pharm. Res., 2002, 19(4), 477–483 CrossRef.
- A. R. Sheth, S. Bates, F. X. Muller and D. J. W. Grant, Cryst. Growth Des., 2005, 5(2), 571–578 CrossRef.
Footnotes |
| † Electronic supplementary information (ESI) available. See DOI: 10.1039/c8ra05535a |
| ‡ Both authors have contributed equally. |
| This journal is © The Royal Society of Chemistry 2018 |


