 Open Access Article
Efficient in situ generation of H2O2 by novel magnesium–carbon nanotube composites†
Zhao Yanga,
Xiaobo Gong *ab,
Bingqing Wanga,
Dan Yanga,
Tao Fua and
Yong Liu*ab
aCollege of Chemistry and Material Science, Sichuan Normal University, Chengdu, Sichuan 610066, China. E-mail: gxb@sicnu.edu.cn; liuyong75@sicnu.edu.cn
bKey Laboratory of Treatment for Special Wastewater Treatment, Sichuan Province Higher Education System, Chengdu, Sichuan 610066, China
First published on 15th October 2018
Abstract
Hydrogen peroxide (H2O2) is widely employed as an environmentally friendly chemical oxidant and an energy source. In this study, a novel magnesium–carbon nanotube composite was prepared by a ball milling process in argon atmosphere using polyvinylidene fluoride (PVDF) as a binder. The resulting material was then tested for the in situ generation of H2O2. The preparation and operation conditions of the composite were systemically investigated and analyzed to improve the efficiency of the in situ generation of H2O2. Under the optimized conditions, while aerating with oxygen for 60 min, a maximum H2O2 concentration of 194.73 mg L−1 was achieved by the Mg–CNTs composite prepared using Mg![[thin space (1/6-em)]](https://www.rsc.org/images/entities/char_2009.gif) :
:![[thin space (1/6-em)]](https://www.rsc.org/images/entities/char_2009.gif) CNT
CNT![[thin space (1/6-em)]](https://www.rsc.org/images/entities/char_2009.gif) :
:![[thin space (1/6-em)]](https://www.rsc.org/images/entities/char_2009.gif) PVDF with a weight ratio of 5
PVDF with a weight ratio of 5![[thin space (1/6-em)]](https://www.rsc.org/images/entities/char_2009.gif) :
:![[thin space (1/6-em)]](https://www.rsc.org/images/entities/char_2009.gif) 1
1![[thin space (1/6-em)]](https://www.rsc.org/images/entities/char_2009.gif) :
:![[thin space (1/6-em)]](https://www.rsc.org/images/entities/char_2009.gif) 2.4. In the Mg–CNTs/O2 system, dissolved oxygen molecules were reduced to H2O2, while magnesium was oxidized owing to the electrochemical corrosion. In addition, a part of dissolved magnesium ions converted into magnesium hydroxide and precipitated as nanoflakes on the surfaces of CNTs. A mechanism was proposed, suggesting that the formation of a magnesium/carbon nanotubes corrosion cell on the Mg–CNT composite promoted the in situ synthesis of H2O2. Overall, this study provides a promising and environmentally friendly strategy to fabricate magnesium/CNT composites for the in situ generation of H2O2, which could be applied in energy conversion and advanced oxidation processes for refractory wastewater treatment.
2.4. In the Mg–CNTs/O2 system, dissolved oxygen molecules were reduced to H2O2, while magnesium was oxidized owing to the electrochemical corrosion. In addition, a part of dissolved magnesium ions converted into magnesium hydroxide and precipitated as nanoflakes on the surfaces of CNTs. A mechanism was proposed, suggesting that the formation of a magnesium/carbon nanotubes corrosion cell on the Mg–CNT composite promoted the in situ synthesis of H2O2. Overall, this study provides a promising and environmentally friendly strategy to fabricate magnesium/CNT composites for the in situ generation of H2O2, which could be applied in energy conversion and advanced oxidation processes for refractory wastewater treatment.
Introduction
Hydrogen peroxide (H2O2) is an environmentally friendly, highly efficient and versatile chemical oxidant owing to its elevated active oxygen content (47% w/w) and the green by-product, viz., water.1,2 As a result, H2O2 has been widely employed in chemical synthesis, energy conversion, medical disinfection, and refractory wastewater treatment.3–5 Currently, hydrogen peroxide is industrially produced by the anthraquinone route, and concentrated H2O2 (70 wt%) is obtained by extraction.6 Nevertheless, the anthraquinone process is not green due to its complexity and the requirement for a significant amount of energy combined with substantial waste generation.7,8 The storage, transportation and handling of concentrated H2O2 also face safety and economic issues.9 Moreover, most applications require diluted H2O2 prepared from concentrated solutions. Thus, novel and low-cost methods for the in situ generation of H2O2 in solution are highly desirable for many application fields.3,10,11H2O2 is often directly synthesized by the reaction between H2 and O2, which is catalyzed by noble metals. However, this process has several drawbacks, including the potential explosiveness of the gas mixture, the elevated cost of precious catalysts and the low solubility of O2/H2 in water.12 Consequently, tremendous research efforts have been devoted to the development of photocatalysts and electrochemical methods for the in situ generation of H2O2 through the cathodic reduction of dissolved oxygen.13–17 Moreover, bio-electrochemistry has also been applied for the in situ generation of H2O2 though bioreactions.18,19 However, the specific operating conditions, such as high electrolyte concentrations, electrical energy, luminous energy, nutrients or elevated voltage hindered the practical applications of these systems.2,20 Therefore, finding novel convenient and economic processes for the in situ generation and direct utilization of H2O2 is highly appreciated.
Several studies have demonstrated that the in situ generation of H2O2 can be obtained by micro-electrolysis based on electrochemical reactions between oxygen and metals. For instance, Fan et al. detected small amounts (about 180 μmol L−1) of H2O2 in an Al/O2 system.21 Zhang et al. obtained H2O2 on the surface of Fe0–CNTs by internal electrolysis.22 A similar phenomenon was also observed by Wen et al. in a Zn–ozone system.23 In these processes, oxygen molecules received electrons from the oxidation of zero-valent zinc to form H2O2 through the disproportionation of O2−. However, the yield of H2O2 was still too low for practical applications. The electrochemical corrosion theory suggests that the rate of the oxidation–reduction reaction occurring on the surface of a metal could be accelerated in galvanic-type corrosion cells without applying external power.24 In our previous study, a novel system based on zinc–carbon nanotube composites was thus successfully developed for the efficient in situ generation of hydrogen peroxide.25 Owing to the electrochemistry of zinc(0) as the anode in the corrosion cell, O2 was efficiently reduced to H2O2 through a two-electron route on CNTs. This novel system was also applied to wastewater treatment through the in situ utilization of H2O2.20,24,26,27 Compared with zinc, zero-valent magnesium (Mg) has greater efficiency due to its low cost, rich reserves, lightweight, low toxicity, environment friendliness and relatively high safety.28,29 Furthermore, magnesium possesses an elevated environmental compatibility due to its abundance in the earth's crust and seawater. Moreover, the preparation processes of Zn–CNT composites require high-temperature heat treatments, which results in a relative complexity with energy dissipation. Therefore, preparation methods of new metal–CNT composites through simple procedures for the in situ synthesis of H2O2 are of interest for many application fields.
Herein, a Mg–CNTs composite was prepared through a ball milling process with polyvinylidene fluoride as the binder under argon atmosphere. The obtained Mg–CNTs composite was characterized by several techniques, including X-ray diffraction (XRD), scanning electron microscopy (SEM), Raman spectroscopy, and Fourier transform infrared (FT-IR) spectroscopy. The properties of the Mg–CNTs composite towards the in situ generation of H2O2 were studied under oxygen atmosphere. The effects of preparation and operation conditions on the in situ generation of H2O2 were also investigated and optimized. A possible reaction mechanism for the in situ production of H2O2 in the Mg–CNTs/O2 system was tentatively proposed. Overall, the results indicated that the Mg–CNTs composite prepared through the proposed simple process is promising for the in situ synthesis of H2O2, in accordance with internal electrolysis corrosion of metals.
Experimental section
Materials
Hydroxyl-containing multi-walled CNTs (d < 8 nm, l = 10–30 μm) were purchased from Chengdu Organic Chemicals, Chinese Academy of Sciences (Chengdu, China). Polyvinylidene fluoride (PVDF, HSV900, Arkema) was purchased from Liyuan Lithium Battery (Taiyuan, China). The other reagents, including magnesium metal powder, H2SO4, NaOH, C4K2O9Ti·2H2O and H2O2 were all purchased from Kelong Chemical Reagent Factory (Chengdu, China). Deionized (DI) water was used in all preparations and experiments.Preparation of Mg–CNTs composite
The Mg–CNTs composite was manufactured by a simple ball milling process described previously.30,31 Briefly, a mixture containing magnesium metal powder (1.0 g), CNTs (0.2 g) and PVDF (0.48 g) was ball milled in planetary ball miller (QM-3SP4, Nanjing university instrument factory, Nanjing, China) under argon atmosphere with zirconia beads (ϕ 6 mm). The weight ratio of ball to powder was set to 100![[thin space (1/6-em)]](https://www.rsc.org/images/entities/char_2009.gif) :
:![[thin space (1/6-em)]](https://www.rsc.org/images/entities/char_2009.gif) 1 and the rotational speed was controlled at 400 rpm. After ball milling for 4 h, the composite was taken out from the milling jar in a glove box filled with argon to prevent the oxidation of Mg powder. The obtained composite prepared with PVDF as the binder was marked as Mg–CNTs, unless otherwise specified.
1 and the rotational speed was controlled at 400 rpm. After ball milling for 4 h, the composite was taken out from the milling jar in a glove box filled with argon to prevent the oxidation of Mg powder. The obtained composite prepared with PVDF as the binder was marked as Mg–CNTs, unless otherwise specified.
Characterization of Mg–CNT composites
Scanning electron microscopy (SEM) and energy dispersive spectrometry (EDS) analyses were performed using a Hitachi SU8010 SEM (Japan). Transmission electron microscopy (TEM) was performed using a JEM-2100F (JEOL, Japan). X-ray diffraction (XRD) analyses were performed on Bruker D8 Adv. (Germany) using Cu Kα radiation and operating conditions of 40 kV and 30 mA to identify the crystal phases of the as-prepared composites. The crystal groups of Mg–CNTs before and after the reaction were investigated by attenuated total reflectance Fourier transform infrared spectroscopy (FT-IR, PE1700 PerkinElmer, US). The elemental composition was analyzed by an Elemental Analyzer (EA3000, Euro Vector, Italy) and inductively coupled plasma atomic emission spectrometry (ICP-AES, Perkin Elmer Optima 8000, US.). Raman spectra were recorded on a LabRam HR800 (Horiba Jobin-Yvon, France). The Brunauer–Emmett–Teller (BET) surface area and pore distribution of the composites were calculated from N2 adsorption–desorption isotherms obtained on an Autosorb-iQ (Quantachrome, US).In situ synthesis of H2O2
The experiments related to the in situ synthesis of H2O2 were all performed in a 250 mL glass beaker at 25 °C. First, the as-prepared Mg–CNTs composite (0.3 g) was added into water (150 mL), and the mixture was stirred continuously under pure oxygen atmosphere. Next, H2SO4 (0.1 mol L−1) and NaOH (0.1 mol L−1) were used to adjust the initial pH of the solution. For each prescribed time interval, an aliquot (1 mL) was extracted and filtered off. H2O2 concentration was determined by a spectrophotometric method (Alpha-1500, Shanghai, China) using titanium potassium oxalate as the chromogenic reagent at the wavelength of 400 nm.32 The effects of the preparation and operating conditions were investigated and optimized for the in situ generation of H2O2 in the Mg–CNTs/O2 system. The leached Mg2+ was analyzed through inductively coupled plasma optical emission spectrometry (ICP-OES) using Perkin Elmer Optima 8000, US.Results and discussion
Characterizations of Mg–CNT composites
The morphology and structure of the ball milled composites prepared with and without PVDF were investigated by SEM and TEM, and the results are depicted in Fig. 1. It can be seen that the CNTs are highly dispersed on the Mg powder surface (Fig. 1a). In addition, the overall structure of the Mg–CNTs composite prepared by ball-milling without PVDF appears loose. After the addition of PVDF during the ball milling process (Fig. 1b and c), most highly dispersed CNTs vanished to leave a relatively smooth surface. This suggested that PVDF facilitated the effective binding of the Mg powder and CNTs during the ball milling process. Fig. 1d shows the TEM image of Mg–CNTs with PVDF. The CNTs were tightly bound to Mg in the composite. The diameter of Mg–CNTs prepared with PVDF was slightly larger than that of Mg–CNTs prepared without PVDF, indicating the tight integration of Mg and hydroxyl-containing multi-walled CNTs within PVDF.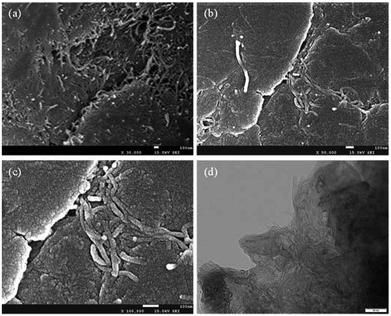 | ||
| Fig. 1 SEM images of Mg–CNTs prepared (a) without and (b) with PVDF, (c) the high-resolution SEM image and (d) TEM image of Mg-CNTs with PVDF. | ||
To determine the elemental distribution and the relative element content in Mg–CNTs prepared with PVDF, EDS was performed, and the data are shown in Fig. S1.† The weight percentages of Mg, F, O and C were estimated to be 58.36%, 13.54%, 4.85% and 23.27%, respectively. The elemental compositions were further analyzed through an elemental analyzer and ICP-AES, and the results showed that the weight percentages of Mg, F, O and C were 54.23%, 12.87%, 5.25% and 27.56%, respectively. The element contents were consistent with the proportions of added Mg and CNTs during the preparation process.
The integration and the crystal structures of the as-prepared composites under various conditions were further investigated and analyzed by XRD (Fig. 2). The broad diffraction peaks at around 26.1° in PVDF–CNT and Mg–CNT composites prepared with and without PVDF were assigned to the (002) reflection of CNTs, indicating the preservation of the graphitic structure of CNTs after ball milling. The diffraction peaks at 18.34° and 19.90° in PVDF–CNTs were attributed to the (020) and (110) crystal planes of PVDF (PDF #42-1650).33 In comparison, Mg–PVDF and Mg–CNTs prepared with PVDF showed only the diffraction peak of PVDF at 19.90°. These results confirmed that the loading of Mg might affect the crystal structure of PVDF. The peaks located at 32.12°, 34.36°, 36.54°, 47.76°, 57.30°, 63.02°, 68.56°, 69.96°, 72.50°, 77.80° and 81.52° were associated with the (100), (002), (101), (102), (110), (103), (112), (201), (004), (202) and (104) crystal planes of Mg (PDF #35-0821), respectively.31 This demonstrated the successful integration of Mg metal and CNTs within PVDF, which was used as the binder during the ball milling process.
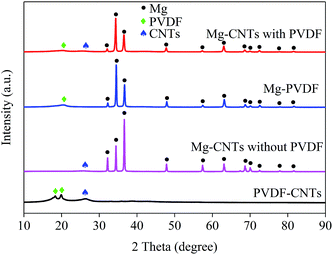 | ||
| Fig. 2 XRD patterns of the prepared composites of PVDF–CNTs, Mg–PVDF and Mg–CNTs with and without PVDF. | ||
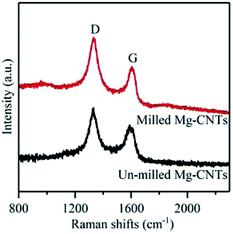
To gain further understanding of the structure, crystallization and the defects in Mg–CNTs, Raman spectroscopy was employed to characterize Mg–CNTs before and after ball milling. The G peak in Raman spectra corresponds to the perfect graphitic structure of CNTs, while the D peak is related to structural defects and disorder in the carbon lattice.34 Raman spectra of Mg–CNT composites before and after ball milling are presented in Fig. 3. The D peaks of Mg–CNT composites before and after ball milling are both located at 1331 cm−1, while the G peaks are observed at 1589 cm−1 and 1604 cm−1 before and after ball milling, respectively. The shift in the G peak was probably due to the change in the diameter distribution of CNTs during the ball milling process, which was observed in SEM images of Mg–CNTs (Fig. 1). The intensity ratio R (ID/IG) was also used to investigate the damage occurred to CNTs.35 After ball milling, the R rate increased to 1.342, which was about 6.68% higher than that of un-milled Mg–CNTs (1.258). Hence, ball-milling increased the intensity of the disordered carbon model, and the carbon nanotube structure was destroyed to form crystal defects.34,36,37 These structural defects in carbon nanotubes induced by ball milling might be more conducive to the oxygen transfer and would be beneficial for enhancing the oxygen reduction reaction (ORR) activity during the in situ H2O2 synthesis by the Mg–CNTs composite.
In situ generation of H2O2 in different systems
Control experiments were first conducted to compare the in situ generated H2O2 of various systems at an initial pH of 3.0 and a composite dosage of 2 g L−1. As shown in Fig. 4, almost no H2O2 was detected in the solution containing the CNTs–PVDF composite, indicating that Mg powder was necessary to generate H2O2. After the addition of Mg powder during ball milling, H2O2 was rapidly formed in the Mg–CNTs system with concentration reaching 194.73 mg L−1 after 60 min. The performances of Mg–PVDF (15.73 mg L−1) and Mg–CNTs prepared without PVDF (22.83 mg L−1) for the in situ generation of H2O2 seemed much lower than that of Mg–CNTs prepared with PVDF. This might be due to the highly separated Mg powder and carbon nanotubes in the Mg–CNTs/O2 system (Fig. 1a), which hindered the oxygen reduction reaction driven by internal electrolysis. Although the hydrophobic nature of PVDF favored the mass transfer of oxygen molecules, the Mg–PVDF/O2 system was not conducive to the electron transfer, resulting in low H2O2 concentration. The H2O2 yield produced by the Mg–CNTs system prepared with PVDF was much higher than that of Mg–PVDF, indicating the importance of CNTs in the in situ synthesis of H2O2. Additionally, the CNTs were the mainly occurred place of ORR production in Mg–CNTs/O2 system. It should be noted that the activity of un-milled Mg–CNTs prepared with PVDF (9.50 mg L−1 at 60 min) was much lower than that of Mg–CNTs formed with PVDF after ball milling as well as that of Mg–CNTs and Mg–PVDF. Hence, the milling process was not only conducive to the bonding between the matrix materials, but also to the formation of crystal defects in the composites to provide a large number of reaction sites. This in turn, should increase the rate of the ORR on the surface of the Mg–CNTs composite.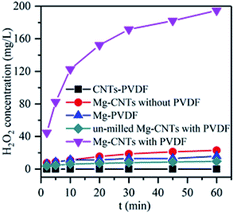 | ||
| Fig. 4 In situ generation of H2O2 by various systems at an initial pH of 3.0, a composite dosage of 2.0 g L−1, a temperature of 25 °C and an oxygen flow rate of 400 mL min−1. | ||
Influence of the composite ratio on the in situ synthesized synthesis of H2O2
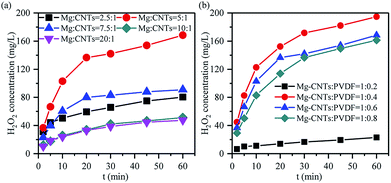
The in situ synthesis of H2O2 primarily contributed to the ORR occurring on the cathode surface in the corrosion cell catalyzed by the Mg–CNTs/O2 system, while Mg was oxidized to MgO or Mg(OH)2. The immediate contact and the homogeneous dispersion of magnesium and CNTs in the Mg–CNTs composite would not only reduce the ohmic resistance of the composites, but also increase the electron and oxygen transfer rates.25 Therefore, the ratio of CNTs and magnesium would affect the performance of the in situ generated H2O2 by Mg–CNTs/O2. Fig. 5a illustrates the effects of the magnesium![[thin space (1/6-em)]](https://www.rsc.org/images/entities/char_2009.gif) :
:![[thin space (1/6-em)]](https://www.rsc.org/images/entities/char_2009.gif) CNTs ratio on the in situ generated H2O2 at a fixed Mg–CNT mixture
CNTs ratio on the in situ generated H2O2 at a fixed Mg–CNT mixture![[thin space (1/6-em)]](https://www.rsc.org/images/entities/char_2009.gif) :
:![[thin space (1/6-em)]](https://www.rsc.org/images/entities/char_2009.gif) PVDF ratio of 1
PVDF ratio of 1![[thin space (1/6-em)]](https://www.rsc.org/images/entities/char_2009.gif) :
:![[thin space (1/6-em)]](https://www.rsc.org/images/entities/char_2009.gif) 0.6. As the magnesium
0.6. As the magnesium![[thin space (1/6-em)]](https://www.rsc.org/images/entities/char_2009.gif) :
:![[thin space (1/6-em)]](https://www.rsc.org/images/entities/char_2009.gif) CNTs ratio increased from 2.5
CNTs ratio increased from 2.5![[thin space (1/6-em)]](https://www.rsc.org/images/entities/char_2009.gif) :
:![[thin space (1/6-em)]](https://www.rsc.org/images/entities/char_2009.gif) 1 to 5
1 to 5![[thin space (1/6-em)]](https://www.rsc.org/images/entities/char_2009.gif) :
:![[thin space (1/6-em)]](https://www.rsc.org/images/entities/char_2009.gif) 1, the maximum accumulated H2O2 concentration after 60 min rose from 80.36 mg L−1 to 168.45 mg L−1. However, the further increase in the magnesium
1, the maximum accumulated H2O2 concentration after 60 min rose from 80.36 mg L−1 to 168.45 mg L−1. However, the further increase in the magnesium![[thin space (1/6-em)]](https://www.rsc.org/images/entities/char_2009.gif) :
:![[thin space (1/6-em)]](https://www.rsc.org/images/entities/char_2009.gif) CNTs ratio to 7.5
CNTs ratio to 7.5![[thin space (1/6-em)]](https://www.rsc.org/images/entities/char_2009.gif) :
:![[thin space (1/6-em)]](https://www.rsc.org/images/entities/char_2009.gif) 1, 10
1, 10![[thin space (1/6-em)]](https://www.rsc.org/images/entities/char_2009.gif) :
:![[thin space (1/6-em)]](https://www.rsc.org/images/entities/char_2009.gif) 1 and 20
1 and 20![[thin space (1/6-em)]](https://www.rsc.org/images/entities/char_2009.gif) :
:![[thin space (1/6-em)]](https://www.rsc.org/images/entities/char_2009.gif) 1 sharply dropped the concentration of H2O2 to 90.95 mg L−1, 47.55 mg L−1 and 33.91 mg L−1, respectively. This might be due to the excess magnesium powder covering the surface of CNTs as the ratio of the magnesium powder was large. This yielded less active surface area for the ORR and restricted the oxygen transfer on the Mg–CNTs composite. Thus, the redundancy of magnesium destroyed the structure of the primary cell and changed the reaction system from electrochemical corrosion to chemical corrosion, declining the ORR rate and the amount of produced H2O2.
1 sharply dropped the concentration of H2O2 to 90.95 mg L−1, 47.55 mg L−1 and 33.91 mg L−1, respectively. This might be due to the excess magnesium powder covering the surface of CNTs as the ratio of the magnesium powder was large. This yielded less active surface area for the ORR and restricted the oxygen transfer on the Mg–CNTs composite. Thus, the redundancy of magnesium destroyed the structure of the primary cell and changed the reaction system from electrochemical corrosion to chemical corrosion, declining the ORR rate and the amount of produced H2O2.
Since the hydrophobicity of PVDF should facilitate the oxygen transfer and insulated PVDF should inhibit the transfer of electrons,38,39 the ratio of Mg–CNTs and PVDF would also be an important factor that affects the properties of in situ generated H2O2. As demonstrated in Fig. 5b, the Mg–CNT composite with the Mg–CNTs![[thin space (1/6-em)]](https://www.rsc.org/images/entities/char_2009.gif) :
:![[thin space (1/6-em)]](https://www.rsc.org/images/entities/char_2009.gif) PVDF ratio of 1
PVDF ratio of 1![[thin space (1/6-em)]](https://www.rsc.org/images/entities/char_2009.gif) :
:![[thin space (1/6-em)]](https://www.rsc.org/images/entities/char_2009.gif) 0.4 led to an optimal yield of in situ produced H2O2. After 60 min of reaction, the concentration of H2O2 reached 194.73 mg L−1. The BET surface area and the average pore size determined by the nitrogen adsorption isotherm of Mg–CNTs containing 0.4 PVDF were estimated to be 3.14 m2 g−1 and 13.30 nm, respectively (Fig. 6). At the Mg–CNTs
0.4 led to an optimal yield of in situ produced H2O2. After 60 min of reaction, the concentration of H2O2 reached 194.73 mg L−1. The BET surface area and the average pore size determined by the nitrogen adsorption isotherm of Mg–CNTs containing 0.4 PVDF were estimated to be 3.14 m2 g−1 and 13.30 nm, respectively (Fig. 6). At the Mg–CNTs![[thin space (1/6-em)]](https://www.rsc.org/images/entities/char_2009.gif) :
:![[thin space (1/6-em)]](https://www.rsc.org/images/entities/char_2009.gif) PVDF ratio of 1
PVDF ratio of 1![[thin space (1/6-em)]](https://www.rsc.org/images/entities/char_2009.gif) :
:![[thin space (1/6-em)]](https://www.rsc.org/images/entities/char_2009.gif) 0.2, the maximum accumulated H2O2 concentration after 60 min was recorded as only 23 mg L−1. This indicated that small amounts of PVDF cannot strongly and uniformly bond the magnesium powder and CNTs. However, as the ratio of Mg–CNTs
0.2, the maximum accumulated H2O2 concentration after 60 min was recorded as only 23 mg L−1. This indicated that small amounts of PVDF cannot strongly and uniformly bond the magnesium powder and CNTs. However, as the ratio of Mg–CNTs![[thin space (1/6-em)]](https://www.rsc.org/images/entities/char_2009.gif) :
:![[thin space (1/6-em)]](https://www.rsc.org/images/entities/char_2009.gif) PVDF increased to 1
PVDF increased to 1![[thin space (1/6-em)]](https://www.rsc.org/images/entities/char_2009.gif) :
:![[thin space (1/6-em)]](https://www.rsc.org/images/entities/char_2009.gif) 0.6 and 1
0.6 and 1![[thin space (1/6-em)]](https://www.rsc.org/images/entities/char_2009.gif) :
:![[thin space (1/6-em)]](https://www.rsc.org/images/entities/char_2009.gif) 0.8, the concentration of H2O2 decreased to 168.45 and 161.18 mg L−1, respectively. This might be due to the declined surface area of Mg–CNT composites by redundant PVDF, which was reduced to 1.99 and 0.79 m2 g−1, while the average pore size increased to 16.38 and 18.02 nm, respectively. Thus, the decrease in the H2O2 generation performance at a high Mg–CNTs
0.8, the concentration of H2O2 decreased to 168.45 and 161.18 mg L−1, respectively. This might be due to the declined surface area of Mg–CNT composites by redundant PVDF, which was reduced to 1.99 and 0.79 m2 g−1, while the average pore size increased to 16.38 and 18.02 nm, respectively. Thus, the decrease in the H2O2 generation performance at a high Mg–CNTs![[thin space (1/6-em)]](https://www.rsc.org/images/entities/char_2009.gif) :
:![[thin space (1/6-em)]](https://www.rsc.org/images/entities/char_2009.gif) PVDF ratio could be attributed to excess PVDF that obstructed the porous structure of carbon nanotubes and hindered the transfer of both electrons and oxygen.
PVDF ratio could be attributed to excess PVDF that obstructed the porous structure of carbon nanotubes and hindered the transfer of both electrons and oxygen.
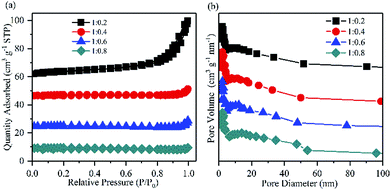 | ||
Fig. 6 (a) Nitrogen adsorption/desorption isotherms and (b) the pore size distributions of Mg–CNT composites with the Mg–CNTs![[thin space (1/6-em)]](https://www.rsc.org/images/entities/char_2009.gif) : :![[thin space (1/6-em)]](https://www.rsc.org/images/entities/char_2009.gif) PVDF weight ratios of 1 PVDF weight ratios of 1![[thin space (1/6-em)]](https://www.rsc.org/images/entities/char_2009.gif) : :![[thin space (1/6-em)]](https://www.rsc.org/images/entities/char_2009.gif) 0.2, 1 0.2, 1![[thin space (1/6-em)]](https://www.rsc.org/images/entities/char_2009.gif) : :![[thin space (1/6-em)]](https://www.rsc.org/images/entities/char_2009.gif) 0.4, 1 0.4, 1![[thin space (1/6-em)]](https://www.rsc.org/images/entities/char_2009.gif) : :![[thin space (1/6-em)]](https://www.rsc.org/images/entities/char_2009.gif) 0.6 and 1 0.6 and 1![[thin space (1/6-em)]](https://www.rsc.org/images/entities/char_2009.gif) : :![[thin space (1/6-em)]](https://www.rsc.org/images/entities/char_2009.gif) 0.8. 0.8. | ||
Influence of operational factors on the in situ generation of H2O2
Since the pH could remarkably influence the corrosion of Mg, various initial pH values were tested for the in situ H2O2 synthesis using the Mg–CNTs/O2 process (Fig. 7a). The concentrations of accumulated H2O2 were recorded as 194.73, 153.00, 145.20 and 115.73 mg L−1 and the average synthesis rates of H2O2 were 3.25, 2.55, 2.42 and 1.93 mg L−1 min−1 at the initial pH values of 3.0, 5.0, 7.0 and 9.0, respectively. The optimum initial pH for the in situ synthesis of H2O2 was determined as 3.0, and the maximum cumulative concentration after 60 min of reaction was 194.73 mg L−1. Clearly, as the initial pH increased, the accumulated H2O2 and the average synthesis rate decreased. The in situ generation of H2O2 by Mg–CNTs/O2 resulted from the presence of a large number of macroscopic galvanic cells formed between Mg and CNTs. The H2O2 was in situ produced on the surface of CNTs through a two-electron oxygen reduction reaction in acidic media.9 Therefore, lower initial solution pH was favourable for the in situ synthesis of higher amounts of H2O2.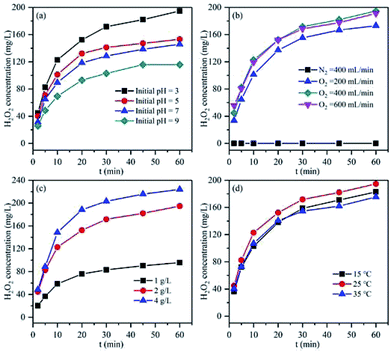 | ||
| Fig. 7 Effect of (a) pH, (b) oxygen flow rate, (c) Mg–CNT composite dosage and (d) operational temperature on the accumulation of in situ generated H2O2. | ||
The oxygen flow rate is an important factor for the in situ generation of H2O2 using the Mg–CNTs/O2 process owing to the role of mixed effects and the oxygen supply. As can be seen in Fig. 7b, almost no H2O2 is produced under N2 atmosphere, indicating the importance of O2 in the in situ formation of H2O2. The amount of H2O2 accumulated after 60 min increased from 173 to 194.73 mg L−1 as the flow rate of O2 rose from 200 to 400 mL min−1. Therefore, the generation rate of H2O2 can be greatly enhanced by adding pure oxygen to the solution, and the generation rate enhanced at elevated O2 flow rates. Nevertheless, when the O2 flow rate was increased to 600 mL min−1, the H2O2 concentration did not increase, but slightly declined to 191.18 mg L−1. The concentrations of dissolved oxygen molecules were recorded as 32.96, 36.83 and 37.12 mg L−1 at O2 flow rates of 200, 400 and 600 mL min−1, respectively. Clearly, a further increase in the O2 flow rate had a negligible effect on the dissolved oxygen concentration because dissolved oxygen basically reached oversaturation at 400 mL min−1, which was consistent with the result of our previous study.25 Furthermore, the limiting diffusion current density at the cathode exceeded the passive current density due to the intensive stirring effect at the O2 flow rate of 600 mL min−1. This led to fractional metal passivation.25 Fig. 7c displays the effect of the Mg–CNT composite dosage on the in situ generation of H2O2. The concentrations of accumulated H2O2 after 60 min were estimated to be 95.73, 194.73 and 223.91 mg L−1 at Mg–CNTs dosages of 1.0, 2.0 and 4.0 g L−1, respectively. The increase in the amount of accumulated H2O2 with the composite dosage could mainly be associated with the high amounts of active sites that would readily reduce O2.26
The influence of the operational temperature on the in situ formation of H2O2 was also investigated from 15 to 35 °C, and the results are depicted in Fig. 7d. As the temperature increased from 15 to 25 °C, the amount of accumulated H2O2 slightly increased from 182.83 mg L−1 to 194.73 mg L−1. The oxygen diffusion coefficient and the oxygen reduction reaction rate might enhance with temperature, which should increase the decomposition rate of H2O2 and reduce the solubility of dissolved O2.2,9,25 The effect of the Mg–CNT composite on the H2O2 decomposition at different temperatures is shown in Fig. S2.† The decomposition rates of H2O2 were calculated as 21.13% and 25.60% at the reaction temperatures of 15 and 25 °C, respectively. As the temperature rose to 35 °C, the decomposition rate of H2O2 sharply increased to 60.70%. Thus, the amount of accumulated H2O2 declined to 175.33 mg L−1 as the operational temperature rose to 35 °C. Therefore, lower temperature was more favorable for the in situ synthesis of H2O2 in the Mg–CNTs/O2 system.
Long-term operation of the Mg–CNTs/O2 system
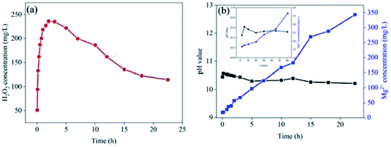
To measure the life-time of the Mg–CNTs/O2 system, Mg–CNT composites were subjected to a continuous O2 flow for a long-term and the concentration of dissolved Mg in the solution was determined. Fig. 8a indicates the concentration of generated H2O2 with the reaction time under continuous O2 aeration. During the first two hours of the reaction, H2O2 rapidly accumulated to reach a maximum value of 236.17 mg L−1. Subsequently, the concentration of hydrogen peroxide slowly decreased. Finally, after continuous reaction for 22.5 h, the H2O2 concentration was still as high as 114.5 mg L−1, accounting for 48.48% of maximum accumulation.Fig. 8b depicts the concentrations of the released magnesium ions and the pH values of the solution. The pH rose sharply during the first 5 min and then decreased slowly to 10.22 after 22.5 h. The solubility product (Ksp = 1.8 × 10⁻¹¹) of Mg(OH)2 indicates that the pH value should be around 10.9 when Mg(OH)2 reaches complete precipitation.40 Therefore, the concentration of magnesium ions in solution enhanced linearly with the reaction time although the partially released magnesium ions were converted to magnesium hydroxide, which precipitated on the surfaces of the composites. The formation of magnesium hydroxide was further confirmed by XRD (see next section). After operation for 22.5 h, the concentration of magnesium ions reached 342.9 mg L−1 and the mass of magnesium ions in solution was about 28.79% of total magnesium.
Mechanism of the in situ H2O2 synthesis using the Mg–CNTs/O2 system
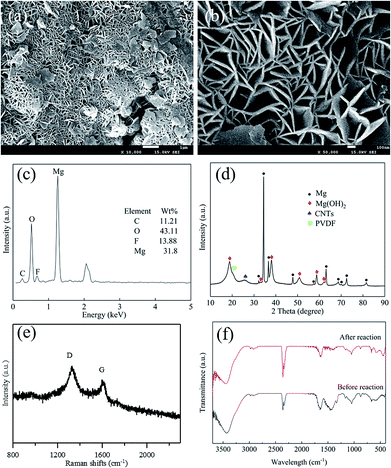
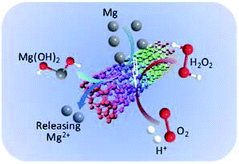
To clarify the mechanism of the Mg–CNTs/O2 system towards generation of H2O2, the morphology, crystal structure and elemental composition of the Mg–CNT composite were identified after H2O2 generation. The morphology of the reacted Mg–CNTs composite is presented in Fig. 9a and b. The surface of reacted Mg–CNTs exhibited several hexagonal crystal structures, possibly produced by magnesium hydroxide after the anodic oxidation reaction of magnesium. Those magnesium hydroxide nanoflakes with thicknesses of 30 nm or more were positioned perpendicular to the CNT surfaces to form a lamellar-like morphology.41,42 The porous structure of the magnesium hydroxide nanoflakes present on the composite surface maintained the oxygen transport to continuously generate H2O2. The nitrogen adsorption/desorption measurements estimated the BET surface area of the reacted Mg–CNTs composite to be 28.5 m2 g−1 and the average pore diameter to be 9.7 nm (Fig. S3†). Owing to presence of lamellar-like nanostructures on the reacted Mg–CNTs composite surface, the calculated surface area was much higher than that of the fresh Mg–CNTs with smooth surface morphology. After 60 min operation, EDS analyses were performed to determine the chemical composition of the reacted Mg–CNTs composite (Fig. 9c). After the in situ generation of H2O2, the proportion of oxygen significantly increased from 4.85 wt% to 43.11 wt%. ICP-AES and elemental analysis were also performed to determine the elemental contents. The Mg, F, O and C element contents were 35.22%, 12.21%, 39.69% and 12.88%, respectively, which were consistent with the results of EDS. The increase in the oxygen content might be attributed to oxidation of magnesium to magnesium hydroxide. To further confirm the presence of magnesium hydroxide in the composite, the composition and the crystal structure of Mg–CNTs after the reaction were analyzed by XRD (Fig. 9d). Strong diffraction peaks associated with Mg were still present. Nevertheless, clear peaks were detected at 2θ of 18.78°, 32.94°, 38.02°, 50.74°, 58.72° and 62.11°, corresponding to (001), (100), (101), (102), (110) and (111) crystal planes of Mg(OH)2 (PDF #84-2163), respectively.41,43 The latter demonstrated the precipitation of magnesium hydroxide on the surface of the Mg–CNTs composite, which was consistent with SEM and EDS analyses. After reaction for 60 min, the intensity ratio R (ID/IG) in the Raman spectrum of the Mg–CNTs composite increased to 1.535 owing to the production of nanoflakes of Mg(OH)2 and the increased disorder of carbon nanotubes structure. Furthermore, the FT-IR spectra of the Mg–CNT composite before and after the reaction were also investigated. Fig. 9f shows that the specific peaks of Mg(OH)2 appeared after the reaction, which also indicated the production of Mg(OH)2 during the reaction. The above results clearly confirmed the presence of magnesium hydroxide in reacted Mg–CNTs, indicating that Mg metal was oxidized and then converted into magnesium hydroxide through internal electrolysis in the Mg–CNTs corrosion cell during the in situ generation of H2O2.In our previous study, the ORR on the surface of CNTs was confirmed through electrochemical measurements.25 The oxygen molecules were reduced to hydrogen peroxide on the surface of CNTs through a two-electron pathway.44–46 By taking these results into account, a mechanism for the in situ H2O2 synthesis using the Mg–CNTs/O2 system was proposed and shown in Scheme 1. Using the Mg–CNTs/O2 system, Mg metal was oxidized and converted into magnesium hydroxide through internal electrolysis in the Mg–CNTs corrosion cell. The reduced Mg ions by the corrosion reaction was particular deposited on the composite surface and the remaining was released into the solution. Simultaneously, dissolved oxygen molecules were selectively reduced to form hydrogen peroxide, driven by the internal electrolysis of Mg. The performance of the Mg–CNTs/O2 system in the in situ generation of H2O2 was much higher than that produced by previously reported electrochemical systems.2,44,47 This highlighted that the novel Mg–CNTs/O2 system possesses superior activity and durability towards the in situ formation of H2O2, and hence holds great potential as an environmentally friendly process for both direct and indirect applications.
Conclusions
An Mg–CNTs composite was prepared through ball milling with PVDF as the binding agent, and the obtained system was tested for the in situ generation of H2O2. The Mg–CNT composite prepared with the weight ratio of Mg![[thin space (1/6-em)]](https://www.rsc.org/images/entities/char_2009.gif) :
:![[thin space (1/6-em)]](https://www.rsc.org/images/entities/char_2009.gif) CNT
CNT![[thin space (1/6-em)]](https://www.rsc.org/images/entities/char_2009.gif) :
:![[thin space (1/6-em)]](https://www.rsc.org/images/entities/char_2009.gif) PVDF = 5
PVDF = 5![[thin space (1/6-em)]](https://www.rsc.org/images/entities/char_2009.gif) :
:![[thin space (1/6-em)]](https://www.rsc.org/images/entities/char_2009.gif) 1
1![[thin space (1/6-em)]](https://www.rsc.org/images/entities/char_2009.gif) :
:![[thin space (1/6-em)]](https://www.rsc.org/images/entities/char_2009.gif) 2.4 exhibited the maximum accumulated H2O2 of 194.73 mg L−1 when operated at optimal conditions for 60 min. The Mg–CNTs composite showed long time operation ability for the efficient in situ H2O2 synthesis under oxygen atmosphere. Using the Mg–CNTs/O2 system, oxygen was selectively reduced to H2O2, which was driven by internal electrolysis in the formed Mg–CNTs corrosion cell. However, it should be mentioned that magnesium was consumed during the reaction, where most of it was present in solution as magnesium ions. The magnesium ions in solution could be reused by reduction or precipitated. Overall, the Mg–CNTs/O2 system is not only crucial for the efficient in situ H2O2 synthesis as an environmentally friendly reactant, but also could be suitable for energy conversion and refractory wastewater treatment applications based on advanced oxidation processes.
2.4 exhibited the maximum accumulated H2O2 of 194.73 mg L−1 when operated at optimal conditions for 60 min. The Mg–CNTs composite showed long time operation ability for the efficient in situ H2O2 synthesis under oxygen atmosphere. Using the Mg–CNTs/O2 system, oxygen was selectively reduced to H2O2, which was driven by internal electrolysis in the formed Mg–CNTs corrosion cell. However, it should be mentioned that magnesium was consumed during the reaction, where most of it was present in solution as magnesium ions. The magnesium ions in solution could be reused by reduction or precipitated. Overall, the Mg–CNTs/O2 system is not only crucial for the efficient in situ H2O2 synthesis as an environmentally friendly reactant, but also could be suitable for energy conversion and refractory wastewater treatment applications based on advanced oxidation processes.
Conflicts of interest
There are no conflicts of interest to declare.Acknowledgements
This research was supported by the National Natural Science Foundation of China (No. 51708374 and No. 51878427) and the Scientific Research Foundation of Education Department of Sichuan Province (No. 18ZA0399 and No. 18ZA0397).References
- W. Miran, M. Nawaz, J. Jang and D. S. Lee, Water Res., 2017, 117, 198–206 CrossRef CAS PubMed.
- Z. Qiang, J. H. Chang and C. P. Huang, Water Res., 2002, 36, 85–94 CrossRef CAS PubMed.
- S. Hu, X. Qu, P. Li, F. Wang, Q. Li, L. Song, Y. Zhao and X. Kang, Chem. Eng. J., 2018, 334, 410–418 CrossRef CAS.
- A. D. Bokare and W. Choi, J. Hazard. Mater., 2014, 275, 121–135 CrossRef CAS PubMed.
- Y. Y. Chen, Y. L. Ma, J. Yang, L. Q. Wang, J. M. Lv and C. J. Ren, Chem. Eng. J., 2016, 307, 15–23 CrossRef.
- Z. Khan, N. F. Dummer and J. K. Edwards, Philos. Trans. R. Soc., A, 2018, 376, 20170058 CrossRef PubMed.
- V. Perazzolo, C. Durante, R. Pilot, A. Paduano, J. Zheng, G. A. Rizzi, A. Martucci, G. Granozzi and A. Gennaro, Carbon, 2015, 95, 949–963 CrossRef CAS.
- J. Pérez, J. Llanos, C. Sáez, C. López, P. Cañizares and M. Rodrigo, Electrochem. Commun., 2016, 71, 65–68 CrossRef.
- B. Puértolas, A. K. Hill, T. García, B. Solsona and L. Torrente-Murciano, Catal. Today, 2015, 248, 115–127 CrossRef.
- S. Yuan, Y. Fan, Y. Zhang, M. Tong and P. Liao, Environ. Sci. Technol., 2011, 45, 8514–8520 CrossRef CAS PubMed.
- L. Peng, X. Gong, X. Wang, Z. Yang and Y. Liu, RSC Adv., 2018, 8, 26377–26382 RSC.
- M. S. Yalfani, S. Contreras, F. Medina and J. E. Sueiras, J. Hazard. Mater., 2011, 192, 340–346 CAS.
- S. Tian, Y. Li, H. Zeng, W. Guan, Y. Wang and X. Zhao, J. Colloid Interface Sci., 2016, 482, 205–211 CrossRef CAS PubMed.
- W. Liu, H. Liu and Z. Ai, J. Hazard. Mater., 2015, 288, 97–103 CrossRef CAS PubMed.
- X. Zong, H. Chen, B. Seger, T. Pedersen, M. S. Dargusch, E. W. McFarland, C. Li and L. Wang, Energy Environ. Sci., 2014, 7, 3347–3351 RSC.
- T.-P. Fellinger, F. d. r. Hasché, P. Strasser and M. Antonietti, J. Am. Chem. Soc., 2012, 134, 4072–4075 CrossRef CAS PubMed.
- J. F. Carneiro, R. S. Rocha, P. Hammer, R. Bertazzoli and M. R. V. Lanza, Appl. Catal., A, 2016, 517, 161–167 CrossRef CAS.
- C.-H. Feng, F.-B. Li, H.-J. Mai and X.-Z. Li, Environ. Sci. Technol., 2010, 44, 1875–1880 CrossRef CAS PubMed.
- L. Zhuang, S. Zhou, Y. Li, T. Liu and D. Huang, J. Power Sources, 2010, 195, 1379–1382 CrossRef CAS.
- Y. Liu, Y. Liu, Z. Yang and J. Wang, RSC Adv., 2017, 7, 49985–49994 RSC.
- J.-H. Fan, X. Liu and L.-m. Ma, Chem. Eng. J., 2015, 263, 71–82 CrossRef CAS.
- S. Zhang, D. Wang, L. Zhou, X. Zhang, P. Fan and X. Quan, Chem. Eng. J., 2013, 217, 99–107 CrossRef CAS.
- G. Wen, S.-J. Wang, J. Ma, T.-L. Huang, Z.-Q. Liu, L. Zhao and J.-F. Su, J. Hazard. Mater., 2014, 265, 69–78 CrossRef CAS PubMed.
- Y. Liu, A. Zhou, Y. Liu and J. Wang, Chemosphere, 2018, 191, 54–63 CrossRef CAS PubMed.
- X.-b. Gong, Z. Yang, L. Peng, A.-l. Zhou, Y.-l. Liu and Y. Liu, J. Power Sources, 2018, 378, 190–197 CrossRef CAS.
- Y. Liu, Q. Fan and J. Wang, J. Hazard. Mater., 2018, 342, 166 CrossRef CAS PubMed.
- Z. Yang, X.-b. Gong, L. Peng, D. Yang and Y. Liu, Chemosphere, 2018, 208, 665–673 CrossRef CAS PubMed.
- M. Deyab, J. Power Sources, 2016, 325, 98–103 CrossRef CAS.
- M. M. Dinesh, K. Saminathan, M. Selvam, S. Srither, V. Rajendran and K. V. Kaler, J. Power Sources, 2015, 276, 32–38 CrossRef.
- B. H. Chen, C. H. Kuo, J. R. Ku, P. S. Yan, C. J. Huang, M. S. Jeng and F. H. Tsau, J. Alloys Compd., 2013, 568, 78–83 CrossRef CAS.
- F. Sun, C. Shi, K. Y. Rhee and N. Zhao, J. Alloys Compd., 2013, 551, 496–501 CrossRef CAS.
- R. M. Sellers, Analyst, 1980, 105, 950–954 RSC.
- A. Muzaffar, M. B. Ahamed, K. Deshmukh, M. Faisal and S. K. Pasha, Mater. Lett., 2018, 218, 217–220 CrossRef CAS.
- M. Rashad, F. Pan, J. Zhang and M. Asif, J. Alloys Compd., 2015, 646, 223–232 CrossRef CAS.
- A. J. Albaaji, E. G. Castle, M. J. Reece, J. P. Hall and S. L. Evans, Mater. Des., 2017, 122, 296–306 CrossRef CAS.
- J. Y. Eom, D. Y. Kim and H. S. Kwon, J. Power Sources, 2006, 157, 507–514 CrossRef CAS.
- D. Poirier, R. Gauvin and R. A. L. Drew, Composites, Part A, 2009, 40, 1482–1489 CrossRef.
- G. D. Kang and Y. M. Cao, J. Membr. Sci., 2014, 463, 145–165 CrossRef CAS.
- H. Shi, L. Xue, A. Gao, Y. Fu, Q. Zhou and L. Zhu, J. Membr. Sci., 2016, 498, 39–47 CrossRef CAS.
- Q. L. Ren and Q. Luo, Key Eng. Mater., 2017, 726, 350–354 Search PubMed.
- C. Li, Z. Zhuang, F. Huang, Z. Wu, Y. Hong and Z. Lin, ACS Appl. Mater. Interfaces, 2013, 5, 9719–9725 CrossRef CAS PubMed.
- G. Zou, R. Liu, W. Chen and Z. Xu, Mater. Res. Bull., 2007, 42, 1153–1158 CrossRef CAS.
- Y. Chen, T. Zhou, H. Fang, S. Li, Y. Yao, B. Fan and J. Wang, Particuology, 2016, 24, 177–182 CrossRef CAS.
- A. R. Khataee, M. Safarpour, M. Zarei and S. Aber, J. Electroanal. Chem., 2011, 659, 63–68 CrossRef CAS.
- A. Khataee, S. Sajjadi, S. R. Pouran, A. Hasanzadeh and S. W. Joo, Electrochim. Acta, 2017, 244, 38–46 CrossRef CAS.
- D. S. Choi, Y. Ni, E. Fernández-Fueyo, M. Lee, F. Hollmann and C. B. Park, ACS Catal., 2017, 7, 1563–1567 CrossRef CAS.
- Y. Liu, X. Quan, X. Fan, H. Wang and S. Chen, Angew. Chem., 2015, 127, 6941–6945 CrossRef.
Footnote |
| † Electronic supplementary information (ESI) available: EDS spectrum of Mg–CNTs prepared with PVDF; effect of temperature on H2O2 decomposition; nitrogen adsorption/desorption isotherms and pore distribution of Mg–CNTs after catalytic process. See DOI: 10.1039/c8ra05907a |
| This journal is © The Royal Society of Chemistry 2018 |

