 Open Access Article
Synthesis and characterization of CdSxSe1−x alloy quantum dots with composition-dependent band gaps and paramagnetic properties
Yueh-Chi Chunga,
Chien-Hsin Yanga,
Hao-Wen Zhenga,
Ping-Szu Tsaib and
Tzong-Liu Wang *a
*a
aDepartment of Chemical and Materials Engineering, National University of Kaohsiung, Kaohsiung 811, Taiwan, Republic of China. E-mail: tlwang@nuk.edu.tw; Fax: +886-7-5919277; Tel: +886-7-5919278
bDepartment of Chemical and Materials Engineering, National Kaohsiung University of Science and Technology, Kaohsiung 807, Taiwan, Republic of China
First published on 24th August 2018
Abstract
Ternary CdSxSe1−x alloy quantum dots (QDs) and CdSxSe1−x/ZnS core/shell nanocrystals exhibiting composition dependent band gaps have been successfully synthesized. The ZnS shell was doped with 0.1% and 5% of paramagnetic manganese ions so as to be used as a fluorescent/paramagnetic bi-functional probe. Energy-dispersive X-ray spectroscopy (EDS) measurements confirmed the presence of Cd, S, and Se in CdSxSe1−x nanocrystals with the atomic ratios of Cd, S, and Se which are well consistent with our synthetic ratios. Wide angle X-ray diffraction (WAXD) indicated that the crystal structures of the CdSxSe1−x core QDs and CdSxSe1−x/ZnS core/shell QDs were zinc blende phases. Both dynamic light scattering (DLS) and transmission electron microscopy (TEM) revealed that the as-synthesized nanocrystals had a narrow size distribution and high crystallinity. The band gaps of CdSxSe1−x nanocrystals were adjustable by varying the ratio of S:Se in the CdSxSe1−x core and were in the range of 1.96 eV to 2.32 eV. Hence, when composition x was changed from 0 to 1, the fluorescence color of the nanocrystals varied from red to green. After shell coverage, the ternary alloy QDs exhibited a superior photoluminescence (PL) quantum yield up to 57%. In comparison with the alloy core QDs, the PL emission peaks of the CdSxSe1−x/ZnS core/shell QDs displayed a small redshift. Electron paramagnetic resonance (EPR) measurements for manganese-doped CdSxSe1−x/ZnS nanocrystals revealed paramagnetic properties for both low and high Mn2+ doping levels.
1. Introduction
Nowadays, the rapid advances in science and technology have made daily necessities become much more sophisticated and miniaturized. Because the size of semiconductor nanocrystals is very small, the special quantum confinement effect occurs when the size of three dimensions is reduced to the nanoscale. Semiconductor nanocrystals are nanomaterials and are also known as quantum dots (QDs) which show a significant change of the electronic and optical properties from their corresponding bulk properties. In recent decades, semiconductor quantum dots have drawn considerable attention in the fields of optoelectronics and biomedical imaging due to their size and shape dependent properties.1–5 The optoelectronic properties of semiconductor nanocrystals are dimension dependent, which leads to an increase in the band gap of the material with a decreasing crystallite size.Over the past two decades, the synthesis and identification of nanomaterials have developed as an emerging field of study. Most of their physical properties are relevant to particle size, so these materials are considered important. Many scholars are even more interested in the research of nano-sized semiconductor particles,6,7 and the unique optical properties of semiconductor materials play a significant role in their studies.8 There is a close correlation between photoelectric properties and the size for the nanoscale system,8–12 so the particle growth and chemical control of these properties are important.
Among various II–VI semiconductor quantum dots, CdS/CdSe nanocrystals are specifically promising for potential application in nanophotonic devices operating in the visible spectral range.13–16 The ternary CdSxSe1−x nanocrystals have attracted more research interest because the high absorption and tunable band gap of the ternary CdSSe render the alloy QDs applicable in optical devices such as light emitting diodes (LEDs) or solar cells. Their optical emission energy can be continuously tuned from 1.74 (for bulk CdSe) to 2.42 (for bulk CdS) eV by varying the composition x of the sulfur element.17–22 Thus, through the adjustment in the mole ratio of S![[thin space (1/6-em)]](https://www.rsc.org/images/entities/char_2009.gif) :
:![[thin space (1/6-em)]](https://www.rsc.org/images/entities/char_2009.gif) Se, the energy gap of CdSxSe1−x (0 < x < 1) can change from 1.74 eV to 2.42 eV, which implies that their fluorescent color can vary from red (713 nm) to green (512 nm).
Se, the energy gap of CdSxSe1−x (0 < x < 1) can change from 1.74 eV to 2.42 eV, which implies that their fluorescent color can vary from red (713 nm) to green (512 nm).
Quantum dots (QDs) are mostly used in core structures or core/shell structures. The core–shell structures are designed for passivating the surface by coating the outer periphery of the core material with a shell. There are many unpaired electrons on the core surface, and after the shell is coated, they will be in contact with the shell so that the inner layer region becomes stable. The outer shell is often a wide band gap material used to protect, passivate the core, prevent the core leaching, and improve the quantum yield (QY) of the quantum dots.23–27 It has been indicated that ZnS is the main coating material of CdSe and CdS nanocrystals, since ZnS has a low lattice mismatch with both of them, and the large band offset of ZnS can provide strong confinement.28–36
This research aims to design and synthesize CdSxSe1−x/ZnS multifunctional core/shell nanocrystals. In addition, the band gap of all alloy QDs can be fine-tuned by varying the composition ratio of S and Se in the multifunctional CdSxSe1−x/ZnS nanocrystals, so the light emission can change from green to red. Since the quantum dots have a toxic effect on cells, coating high energy gap ZnS to protect and passivate the core quantum dots, as well as prevent the leaching of the core are needed. The paramagnetic properties of core/shell nanocrystals in different doping concentrations of transition metal, manganese ions, in the zinc sulfide (ZnS) shell are also explored in this study, and it is found that they can be used as fluorescent and paramagnetic bifunctional probes at the same time.
2. Experimental
2.1 Synthesis of CdSxSe1−x core QDs
The synthesis of CdSxSe1−x alloy QDs was according to the method reported in the literature.37 Two precursor complexes, including TBP-Se and TBP-S, were prepared in advance. The TBP-Se solution (2 M) was prepared by dissolving 3.16 g of selenium in 20 ml of tri-n-butylphosphine (TBP). The TBP-S solution was prepared in 2 M solution by dissolving 1.28 g of sulfur powder in 20 ml of TBP. Both precursor solutions were diluted to 0.75 M in octadecene (ODE). Next, 1 mmol of cadmium oxide (CdO), 4 mmol of oleic acid (OA), and 6.25 mmol of octadecene (ODE) were loaded into a 100 ml three-neck round bottom flask, heating to 220 °C with argon protection. After a colorless Cd-oleate complex was formed, mixed injection solutions of x ml of 0.75 M TBP-Se and (1 − x) ml of 0.75 M TBP-S were then injected into the flask. The reaction was continued for 2 h and then cooled down to 80 °C. The CdSxSe1−x alloy QDs were precipitated with a copious amount of methanol and collected by centrifugation and decantation. Six different compositions (x = 0, 0.2, 0.4, 0.6, 0.8, 1) of CdSxSe1−x alloy QDs were prepared.2.2 Synthesis of CdSxSe1−x/ZnS and manganese-doped CdSxSe1−x/ZnS core/shell QDs
In a three-neck round-bottom flask, 0.5 mmol of alloy QDs, 1.5 mmol of OA, and 3.15 mmol of ODE were put and heated under argon up to 220 °C for 1 h. The precursor solution for ZnS shell growth was prepared by dissolving zinc naphthenate and sulfur powder in ODE to form 0.1 M Zn precursor and 0.1 M S precursor. After the alloy QDs solution was cooled down to 140 °C, 5 ml of Zn precursor and 5 ml of S precursor were introduced and reacted for 1 h. After the reaction was cooled down to 60 °C and 5 ml of toluene was added, the as-prepared core/shell QDs were precipitated in 15 ml of methanol and collected by centrifugation and decantation. Six different compositions (x = 0, 0.2, 0.4, 0.6, 0.8, 1) of CdSxSe1−x/ZnS core/shell alloy QDs were prepared.The precursor solution for deposition of the ZnS shell and doped with Mn2+ ions was prepared in a similar manner as mentioned above. Next, appropriate amounts of manganese(II) acetate tetrahydrate were added to the solution. Two weight ratios of Mn2+ ions, 0.1 wt% and 5 wt%, based on the weight ratio of manganese(II) acetate to the alloy QDs, were used. Six different compositions (x = 0, 0.2, 0.4, 0.6, 0.8, 1) of CdSxSe1−x/ZnS core/shell alloy QDs doped with 0.1 wt% and 5 wt% of Mn2+ ions, respectively, were prepared.
2.3 Characterization
SEM EDS mapping (JEOL 5610, Japan) were employed to obtain the distributions of Cd, S, and Se atoms in the alloy materials. Wide-angle X-ray diffractograms (WAXD) were carried out by a Bruker D8 ADVANCE diffractometer, using CuKα radiation with a step size of 0.05° and a scanning speed of 4° min−1. Transmission electron microscopy (TEM) images were obtained with a JEOL JEM-1230 transmission electron microscope. Dynamic light scattering (DLS) measurements for characterization of the size of nanoparticles in solution were performed on a Brookhaven Instruments 90PLUS instrument. Ultraviolet-visible (UV-vis) spectroscopic analysis was performed in a Perkin-Elmer Lambda 35 UV-vis spectrophotometer. Photoluminescence (PL) spectra were taken on a Hitachi F-7000 fluorescence spectrophotometer. Electron paramagnetic resonance (EPR) spectra were recorded at room temperature on a Bruker ELEXSYS E 580 X-Band spectrometer equipped with an Oxford liquid helium cryostat.3. Results and discussion
3.1 Structural characterization
The synthetic process used here was to prepare the core/shell materials with a shell of ZnS to maximize the photoluminescence and provide the paramagnetic property of the alloy materials by Mn2+ ions.By means of energy-dispersive X-ray spectroscopy (EDS), wide angle X-ray diffraction (WAXD), transmission electron microscopy (TEM), dynamic light scattering (DLS), the compositions, crystal structures, nanocrystal sizes, and particle shapes of the as-synthesized core/shell nanocrystals were investigated.
The EDS analysis was carried out to obtain the chemical composition of the CdSxSe1−x alloy nanocrystals samples. As shown in Table 1, EDS measurements indicate the presence of Cd, S, and Se in CdSxSe1−x nanocrystals with the atomic ratios of Cd, S, and Se which are approximately 1![[thin space (1/6-em)]](https://www.rsc.org/images/entities/char_2009.gif) :
:![[thin space (1/6-em)]](https://www.rsc.org/images/entities/char_2009.gif) 0
0![[thin space (1/6-em)]](https://www.rsc.org/images/entities/char_2009.gif) :
:![[thin space (1/6-em)]](https://www.rsc.org/images/entities/char_2009.gif) 1, 1
1, 1![[thin space (1/6-em)]](https://www.rsc.org/images/entities/char_2009.gif) :
:![[thin space (1/6-em)]](https://www.rsc.org/images/entities/char_2009.gif) 0.2
0.2![[thin space (1/6-em)]](https://www.rsc.org/images/entities/char_2009.gif) :
:![[thin space (1/6-em)]](https://www.rsc.org/images/entities/char_2009.gif) 0.8, 1
0.8, 1![[thin space (1/6-em)]](https://www.rsc.org/images/entities/char_2009.gif) :
:![[thin space (1/6-em)]](https://www.rsc.org/images/entities/char_2009.gif) 0.4
0.4![[thin space (1/6-em)]](https://www.rsc.org/images/entities/char_2009.gif) :
:![[thin space (1/6-em)]](https://www.rsc.org/images/entities/char_2009.gif) 0.6, 1
0.6, 1![[thin space (1/6-em)]](https://www.rsc.org/images/entities/char_2009.gif) :
:![[thin space (1/6-em)]](https://www.rsc.org/images/entities/char_2009.gif) 0.6
0.6![[thin space (1/6-em)]](https://www.rsc.org/images/entities/char_2009.gif) :
:![[thin space (1/6-em)]](https://www.rsc.org/images/entities/char_2009.gif) 0.4, 1
0.4, 1![[thin space (1/6-em)]](https://www.rsc.org/images/entities/char_2009.gif) :
:![[thin space (1/6-em)]](https://www.rsc.org/images/entities/char_2009.gif) 0.8
0.8![[thin space (1/6-em)]](https://www.rsc.org/images/entities/char_2009.gif) :
:![[thin space (1/6-em)]](https://www.rsc.org/images/entities/char_2009.gif) 0.2, and 1
0.2, and 1![[thin space (1/6-em)]](https://www.rsc.org/images/entities/char_2009.gif) :
:![[thin space (1/6-em)]](https://www.rsc.org/images/entities/char_2009.gif) 1
1![[thin space (1/6-em)]](https://www.rsc.org/images/entities/char_2009.gif) :
:![[thin space (1/6-em)]](https://www.rsc.org/images/entities/char_2009.gif) 0, respectively. The results illustrate that the atomic ratios of Cd, S, and Se of the QD cores are close to our synthetic ratios. EDS measurements confirm that the six alloy nanocrystals of CdSxSe1−x with varied compositions have been successfully synthesized.
0, respectively. The results illustrate that the atomic ratios of Cd, S, and Se of the QD cores are close to our synthetic ratios. EDS measurements confirm that the six alloy nanocrystals of CdSxSe1−x with varied compositions have been successfully synthesized.
| Ratio | Sample | Cd | S | Se | |||
|---|---|---|---|---|---|---|---|
| wt% | at% | wt% | at% | wt% | at% | ||
| x = 0 | CdSe | 60.25 | 51.78 | 0 | 0 | 39.75 | 48.22 |
| x = 0.2 | CdS0.2Se0.8 | 60.15 | 48.92 | 4.13 | 10.07 | 35.72 | 41.01 |
| x = 0.4 | CdS0.4Se0.6 | 63.22 | 49.08 | 8.6 | 20.05 | 28.18 | 30.87 |
| x = 0.6 | CdS0.6Se0.4 | 70.65 | 53.30 | 12.88 | 29.15 | 16.47 | 17.55 |
| x = 0.8 | CdS0.8Se0.2 | 69.99 | 49.95 | 17.48 | 37.43 | 12.53 | 12.62 |
| x = 1 | CdS | 75.71 | 50.96 | 24.29 | 49.04 | 0 | 0 |
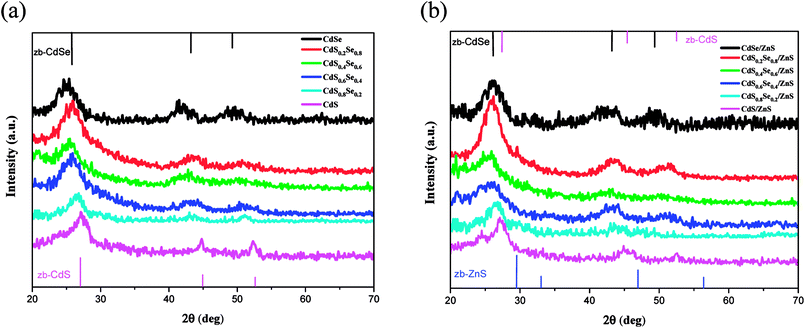
Wide angle X-ray diffraction (WAXD) was performed to investigate the crystal structure of CdSxSe1−x core QDs and CdSxSe1−x/ZnS core/shell QDs. As depicted in Fig. 1, broad and intense peaks in X-ray diffraction (XRD) patterns demonstrate the nanocrystalline nature of all of the alloyed materials. From the upper XRD patterns with peaks from (111), (220), and (311) planes, shown in Fig. 1(a) and (f), the crystal structures of the core QDs can be indexed as the zinc blende cubic phases of CdSe (JCPDS no. 19-0191) and CdS (JCPDS no. 80-0019), respectively. We conclude that we had successfully synthesized CdSe and CdS by varying the composition ratio. Furthermore, the XRD patterns of CdSxSe1−x which x are 0.2, 0.4, 0.6, 0.8 (Fig. 1(b), (c), (d), and (e)) show peaks in between those of zinc blende CdSe and zinc blende CdS, confirming that core QDs with varied compositions in Se and S had been successfully synthesized. As seen from Fig. 2(a), by comparing all of the XRD patterns of the CdSxSe1−x alloy QDs, it seems that all of the core QDs show mixed phase structures of zinc blende CdSe and CdS, which are in well agreement with standard JCPDS data. After coating the ZnS shell, it is worth noting that the WAXD patterns of CdSxSe1−x/ZnS core/shell QDs show peaks similar to those of CdSxSe1−x core QDs, as evident from Fig. 1(a)–(f) and 2(b). Compared with the standard JCPDS no. of zinc blende CdSe and CdS nanocrystals as indexed in Fig. 2(b), the little broadening and small shift to higher 2θ of the XRD peaks provide evidence of the formation of core–shell structure. Since the shell thickness is very small, all XRD patterns of the core/shell QDs are very similar to the patterns of their corresponding core QDs.
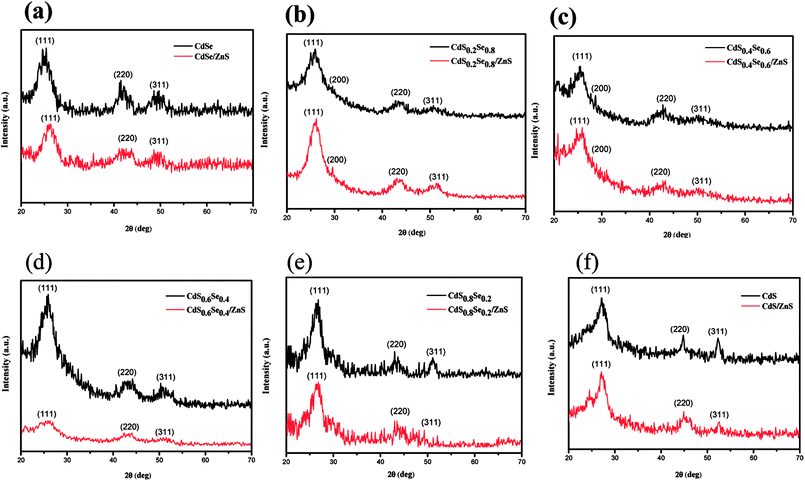 | ||
| Fig. 1 XRD patterns of CdSxSe1−x and CdSxSe1−x/ZnS QDs. (a) x = 0, (b) x = 0.2, (c) x = 0.4, (d) x = 0.6, (e) x = 0.8, (f) x = 1. | ||
Fig. 3 depicts the high resolution TEM (HRTEM) images of CdSxSe1−x (x = 0, 0.2, 0.4, 0.6, 0.8, 1) nanocrystals. As seen from these images, the core QDs appear to be quasi-spherical and monodispersed. The average size of them is 4.1, 4.4, 4.4, 5.1, 5.2, and 5.3 nm, respectively, under high magnification (×500 K). It seems that all of the CdSxSe1−x nanocrystals are very similar in size. Variation of the composition has little effect on the particle size. In addition, the HRTEM images also exhibit well-resolved d-spacings of nanocrystals. After shell coverage, the HRTEM images of CdSxSe1−x (x = 0, 0.2, 0.4, 0.6, 0.8, 1)/ZnS core/shell nanocrystals show that the average sizes are about 5.0, 5.1, 5.2, 5.9, 6.1, and 6.2 nm, respectively (Fig. 4). This confirms the formation of very thin ZnS shells on the QD cores and demonstrates why the XRD patterns of core/shell type quantum dots are very similar to those of the core QDs.
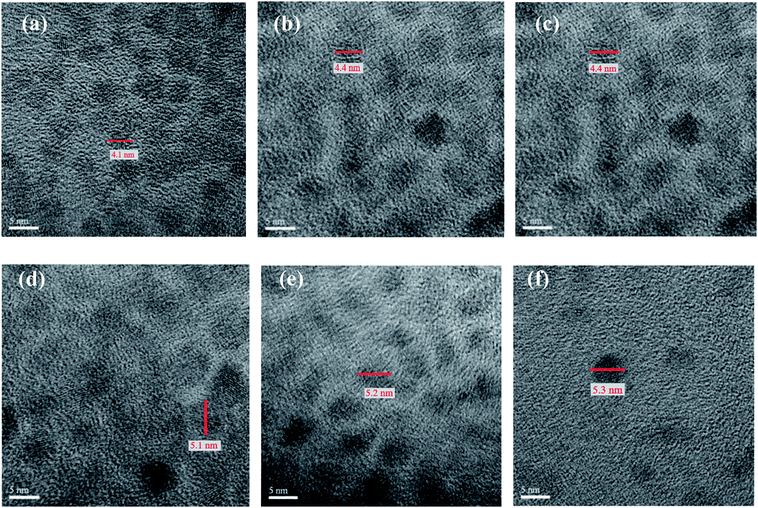 | ||
| Fig. 3 The HRTEM images (×500 K) of CdSxSe1−x core QDs. (a) x = 0, (b) x = 0.2, (c) x = 0.4, (d) x = 0.6, (e) x = 0.8, (f) x = 1. | ||
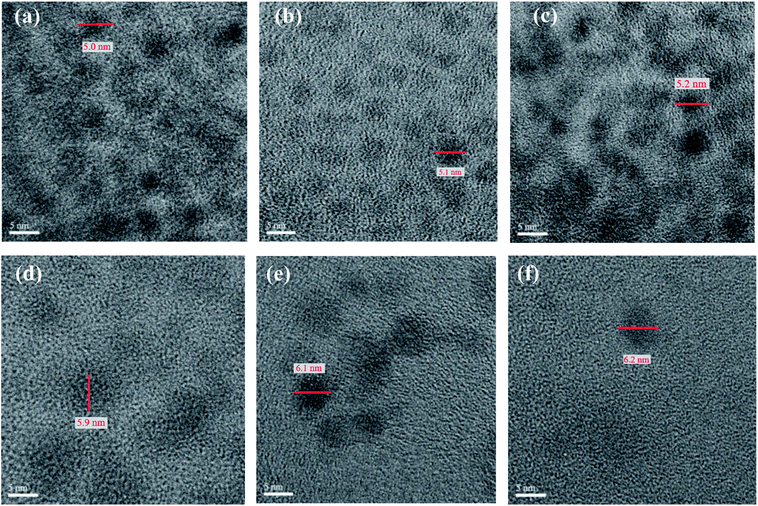 | ||
| Fig. 4 The HRTEM images (×500 K) of CdSxSe1−x/ZnS core/shell QDs. (a) x = 0, (b) x = 0.2, (c) x = 0.4, (d) x = 0.6, (e) x = 0.8, (f) x = 1. | ||
Dynamic light scattering (DLS) measurements gave us further confirmation of the particle sizes of CdSxSe1−x and CdSxSe1−x/ZnS QDs. It is noteworthy that the average nanocrystal sizes of CdSxSe1−x and CdSxSe1−x/ZnS QDs are very similar to those estimated from HRTEM images, which can be seen from Table 2.
| CdSxSe1−x | Nanocrystal sizes (nm) | CdSxSe1−x/ZnS | Nanocrystal sizes (nm) |
|---|---|---|---|
| CdSe | 3.9 | CdSe/ZnS | 5.1 |
| CdS0.2Se0.8 | 4.3 | CdS0.2Se0.8/ZnS | 5.1 |
| CdS0.4Se0.6 | 4.6 | CdS0.4Se0.6/ZnS | 5.2 |
| CdS0.6Se0.4 | 5.3 | CdS0.6Se0.4/ZnS | 5.8 |
| CdS0.8Se0.2 | 5.2 | CdS0.8Se0.2/ZnS | 6.0 |
| CdS | 5.4 | CdS/ZnS | 6.3 |
3.2 Optical properties
To demonstrate that the band gaps of the ternary CdSxSe1−x and CdSxSe1−x/ZnS QDs can be well tuned by their compositions, we measured the UV-vis spectra of the as-synthesized CdSxSe1−x and CdSxSe1−x/ZnS samples.Fig. 5(a) illustrates the UV/vis absorption spectra of CdSxSe1−x (x = 0, 0.2, 0.4, 0.6, 0.8, 1) core QDs. Since the position of the absorption edge of the UV-vis spectrum denotes the minimum energy difference between the lowest energy of conduction band and highest energy of valence band in material, a comparison of the band gaps of CdSxSe1−x can be obtained by means of the UV/vis spectra. As seen in the figure, the position of the absorption edge continuously shifts to the lower wavelength with increasing sulfur content. To obtain more accurate values of the band gaps, the absorption data of spectra were converted through the Tauc relation, αhν = B(hν − Eopt)n. The resulting energy gaps are 1.96, 2.08, 2.10, 2.17, 2.20, and 2.32 eV with an increase of the composition x in CdSxSe1−x, as shown in Fig. 5(b) and Table 3. As compared to the bulk band gap of 1.74 eV, the band gap of the CdSe QD shows a blueshift due to the quantum size effect resulting in the interband transition shifting to a higher frequency. The quantum size effect is most pronounced for semiconductor nanoparticles, which the band gap increases with a decreasing size. As expected, since S has a higher electronegativity than that of Se, all the band gaps of the CdSxSe1−x (x = 0.2, 0.4, 0.6, 0.8,1.0) alloy QDs that contain the sulfur element are higher than that of the CdSe QD (Eg = 1.96 eV). Moreover, the band gap of the CdSxSe1−x alloy QDs increases with an increase of the S content. Therefore, the band gap of the CdSxSe1−x alloy QDs are tunable based on the composition ratio of the chemical element in the alloy.
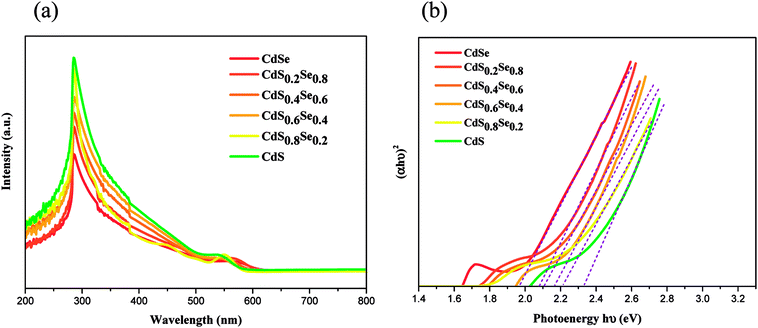 | ||
| Fig. 5 (a) UV/vis spectra of CdSxSe1−x (x = 0, 0.2, 0.4, 0.6, 0.8, 1) core QDs, (b) plot of (αhν)2 vs. hν for the CdSxSe1−x nanocrystals. | ||
| QD | Energy gap (eV) | PL, λem (nm) | FWHM (nm) | QY (%) |
|---|---|---|---|---|
| CdSe | 1.96 | 648 | 31 | 22.7 |
| CdS0.2Se0.8 | 2.08 | 626 | 42 | 15.4 |
| CdS0.4Se0.6 | 2.10 | 616 | 34 | 18.2 |
| CdS0.6Se0.4 | 2.17 | 592 | 32 | 12.0 |
| CdS0.8Se0.2 | 2.20 | 576 | 33 | 36.3 |
| CdS | 2.32 | 532 | 35 | 20.3 |
After the shell coverage with ZnS, it is obvious that the absorption edge of the UV spectra of the CdSxSe1−x/ZnS core/shell QDs also exhibits a phenomenon of blueshift with an increasing sulfur content similar to that of QD cores, as shown in Fig. 6(a). Due to the phenomenon of blueshift of the UV spectra, the band gap of CdSxSe1−x/ZnS (x = 0, 0.2, 0.4, 0.6, 0.8, 1) QDs displays an increase with an increasing S content as well (Fig. 6(b)). In addition, as compared to the QD cores, the band gaps of the core/shell QDs are smaller than those of their corresponding core QDs, which is attributed to partial leakage of the excitons into the shell matrix.38 After converting the absorption data of spectra with Tauc relation, the corresponding energy gaps are 1.94, 2.04, 2.09, 2.15, 2.18 and 2.30 eV, as shown in Fig. 6(b) and Table 4. For both CdSxSe1−x core QDs and CdSxSe1−x/ZnS core/shell QDs, the first exciton peak is very sharp and clearly observed in the absorption spectra due to the shape and size uniformity,39,40 as seen in Fig. 5(a) and 6(a).
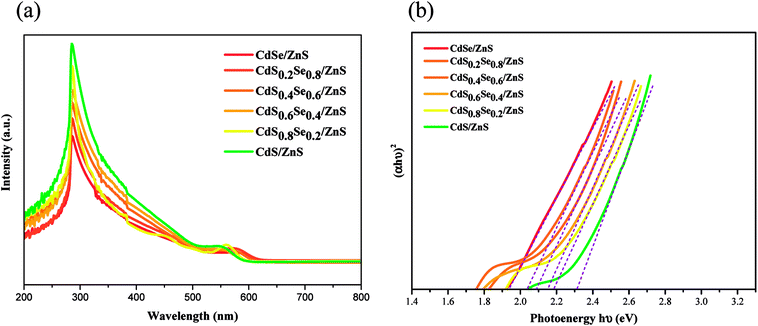 | ||
| Fig. 6 (a) UV/vis spectra of CdSxSe1−x/ZnS core/shell QDs, (b) plot of (αhν)2 vs. hν for the CdSxSe1−x/ZnS nanocrystals. | ||
| QD | Energy gap (eV) | PL, λem (nm) | FWHM (nm) | QY (%) |
|---|---|---|---|---|
| CdSe/ZnS | 1.94 | 663 | 33 | 37.8 |
| CdS0.2Se0.8/ZnS | 2.04 | 632 | 46 | 37.4 |
| CdS0.4Se0.6/ZnS | 2.09 | 633 | 26 | 43.6 |
| CdS0.6Se0.4/ZnS | 2.15 | 602 | 36 | 36.6 |
| CdS0.8Se0.2/ZnS | 2.18 | 590 | 36 | 54.4 |
| CdS/ZnS | 2.30 | 542 | 48 | 57.1 |
Fig. 7 shows the photoluminescence (PL) spectra of CdSxSe1−x, CdSxSe1−x/ZnS, and CdSxSe1−x/ZnS–Mn2+ under 365 nm excitation light. The relevant data including full width at half maximum (FWHM) and quantum yield (QY) are also given in Tables 3 and 4 The narrow emission peaks for the core QDs and core/shell QDs are ascribed to a nearly monodispersed distribution of the nanocrystals, which are well consistent with the observation by TEM. It should be emphasized that both fluorescence intensity and quantum yield of all nanocrystals dramatically increase after the CdSxSe1−x QD cores coated with ZnS, as evident from Fig. 7 and Table 4. This phenomenon can be interpreted as that ZnS has a low lattice mismatch with the CdSSe alloy and ZnS can provide strong confinement for the CdSxSe1−x QD cores as well as modifying surface defects of the CdSxSe1−x QDs. Pertaining to the PL QY of the CdSxSe1−x/ZnS core/shell QDs, as shown in Table 4, it is apparent seen that the QYs are much enhanced with the highest value up to 57.1%. Notably, in comparison with the QD cores, the emission peaks of CdSxSe1−x/ZnS core/shell QDs exhibit a redshift phenomenon as seen in Fig. 7(a)–(f). This can be ascribed to the decrease in the confinement energy as a result of the tunnel penetration of the charges into the shell. In addition, it can be found that the PL spectrum of Mn2+-doped core/shell alloy QDs displays an indiscernible redshift accompanied with the same emission intensity. It seems that after shell coverage with ZnS, the doping of Mn2+ ions has almost no influence on the quantum confinement energy.
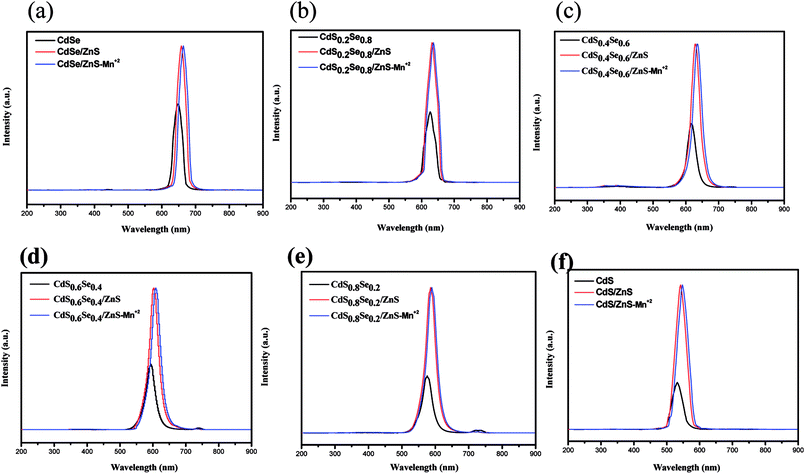 | ||
| Fig. 7 Photoluminescence spectra of CdSxSe1−x, CdSxSe1−x/ZnS, and CdSxSe1−x/ZnS–Mn2+ under 365 nm excitation light. (a) x = 0, (b) x = 0.2, (c) x = 0.4, (d) x = 0.6, (e) x = 0.8, (f) x = 1. | ||
The comparison of PL spectrum for all alloy core QDs and core/shell QDs are shown in Fig. 8(a) and (b). All PL spectra of the QD cores in Fig. 8(a) show a blueshift with an increase in the content of S of the CdSSe alloy QDs. Upon shell coverage, all PL spectra of core/shell QDs still exhibit a small blueshift with an increase of composition x although an overlap occurs in CdS0.2Se0.8/ZnS and CdS0.4Se0.6/ZnS, as seen in Fig. 8(b). This fact may be due to the very small difference of band gaps of both QD cores along with the small shell thickness. As noted previously, in comparison with the alloy core QDs, all PL spectra of core/shell QDs exhibit a small redshift, as evident from Fig. 8 and Table 4.
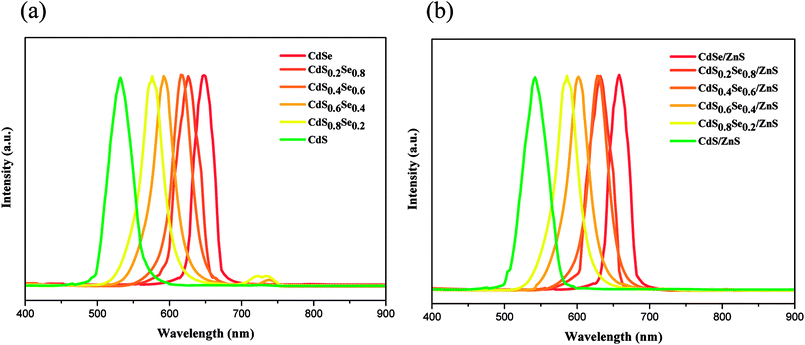 | ||
| Fig. 8 Photoluminescence spectra of (a) CdSxSe1−x core QDs and (b) CdSxSe1−x/ZnS core/shell QDs under 365 nm excitation light. | ||
All of the synthesized QDs emit the intense visible light under UV irradiation. The multicolor emission light of CdSxSe1−x (x = 0, 0.2, 0.4, 0.6, 0.8, 1) QDs is shown in Fig. 9. When x was changed from 0 to 1, the emission color varied from red to green. The colors of emission light for all QDs are well consistent with the wavelengths calculated from the equation of E = 1240/λ (E = energy gap) by using Table 3.
 | ||
| Fig. 9 The multicolor emission light of CdSxSe1−x QDs under UV irradiation. (a) x = 0, (b) x = 0.2, (c) x = 0.4, (d) x = 0.6, (e) x = 0.8, (f) x = 1. | ||
3.3 Magnetic properties of Mn-doped core/shell QDs
To prepare the quantum dots with dual fluorescent/paramagnetic function, manganese ions were used as the dopant in two different doping levels. Electron paramagnetic resonance (EPR) measurements were carried out on manganese-doped CdSxSe1−x/ZnS (CdSxSe1−x/ZnS–Mn2+) QDs to characterize their magnetic properties and determine the characteristics of the dopant's local environment.The representative EPR spectra (CdS0.6Se0.4/ZnS–Mn2+ in this case) of CdSxSe1−x/ZnS–Mn2+ in two different doping levels of Mn2+ are shown in Fig. 10. As seen in Fig. 10(a), the six-line pattern is the characteristic of the electron–nuclear hyperfine coupling of Mn2+ (nuclear spin, I = 5/2) when the doping level of Mn2+ in CdS0.6Se0.4/ZnS QDs was 0.1% and the measurement were performed under 3200–3800 G magnetic field. Hyperfine splitting can be observed when the nuclei have spin angular momentum and the magnetic dipole produces a coupling effect in the magnetic field generated by the movement of electrons. Moreover, since it has been indicated that the sextet pattern happens when Mn2+ ions are spatially isolated, we can deduce that Mn2+ ions are homogeneously distributed within the thin ZnS shell. In contrast, in the case of the doping concentration of Mn2+ was 5%, hyperfine splitting did not occur (Fig. 10(b)). As indicated previously, the broad one-line spectrum is attributed to clustered Mn2+ formed in the high doping concentration, leading to the strong influence one another through their magnetic moments.41,42 It was noted that hyperfine interaction was much stronger than the Mn–Mn coupling in the low doping level of Mn2+. Conversely, at high doping concentrations of Mn2+ (5%), the Mn–Mn interaction became much more dominant. Hence, hyperfine lines merged together to give a single broad line.
 | ||
| Fig. 10 Representative EPR spectra of CdSxSe1−x/ZnS–Mn2+ QDs (CdS0.6Se0.4/ZnS–Mn2+ in this case) from (a) 0.1% and (b) 5% Mn2+ doping level. | ||
4. Conclusions
In this study, synthesis of homogeneously alloyed, zinc-blende CdSxSe1−x core QDs, CdSxSe1−x/ZnS core/shell QDs, and CdSxSe1−x/ZnS–Mn2+ QDs in six proportions have been reported. The band gap of these nanocrystals can be tuned by composition, enabling the selection of emission color for specific applications. XRD patterns demonstrated that CdSxSe1−x (x = 0, 0.2, 0.4, 0.6, 0.8, 1) ternary alloy QDs and CdSxSe1−x/ZnS core/shell nanocrystals had the zinc-blende (cubic) structure. In addition, HRTEM images revealed that both CdSxSe1−x core QDs and CdSxSe1−x/ZnS core/shell QDs had a narrow size distribution and high crystallinity. Nanocrystal sizes measured by DLS analyses were well consistent with those obtained from HRTEM images with the size of core QDs intervened between 3.9–5.4 nm and their corresponding core/shell QDs ranging in size from 5.1–6.3 nm. After coating the ZnS shell, the PL intensities of CdSxSe1−x/ZnS core/shell QDs were much stronger than those of uncoated quantum dots. In addition, the photoluminescence quantum yield of the core/shell QDs were much enhanced, resulting in a PL QY up to 57%. EPR spectra of CdSxSe1−x/ZnS–Mn2+ QDs revealed a six-line hyperfine splitting for 0.1% Mn2+ concentration, while a broad one-line spectrum was observed for 5% Mn2+ concentration, which was ascribed to the Mn2+ cluster formation at higher Mn2+ concentration.Conflicts of interest
There are no conflicts of interest to declare.Acknowledgements
We gratefully acknowledge the support of the Ministry of Science and Technology in Taiwan through Grant MOST 104-2221-E-390-026.References
- V. N. Soloviev, A. Eichhoefer, D. Fenske and U. Banin, J. Am. Chem. Soc., 2000, 122, 2673–2674 CrossRef.
- U. Banin, Y. W. Cao, D. Katz and O. Millo, Nature, 1999, 400, 542–544 CrossRef.
- X. Peng, L. Manna, W. Yang, J. Wickham, E. Scher, A. Kadavanish and A. P. Alivisatos, Nature, 2000, 404, 59–61 CrossRef PubMed.
- M. Verma, D. Patidar, K. B. Sharma and N. S. Saxena, J. Nanoelectron. Optoelectron., 2015, 10, 320–326 CrossRef.
- D. K. Gupta, M. Verma, D. Patidar, K. B. Sharma and N. S. Saxena, Nanosci. Nanotechnol.–Asia, 2017, 7(1), 73–79 Search PubMed.
- E. Matijevic, Chem. Mater., 1993, 5, 412–426 CrossRef.
- R. A. Smith, Semiconductors, Cambridge University Press, Cambridge, U.K, 2nd edn, 1978 Search PubMed.
- NATO ASI Series E: Applied Sciences, ed. D. J. Lockwood and A. Pinczuk, Kluwer Academic Publishers, Dordrecht, The Netherlands, 1993, vol. 248 Search PubMed.
- G. D. Stucky and J. E. MacDougall, Science, 1990, 247, 669–678 CrossRef PubMed.
- J. S. Salafsky, Phys. Rev. B: Condens. Matter Mater. Phys., 1999, 59, 10885–10894 CrossRef.
- M. Li, X. Zhang, K. Matras-Postolek, H. S. Chen and P. Yang, J. Mater. Chem. C, 2018, 6, 5506–5513 RSC.
- C. C. Hung, S. J. Ho, C. W. Yeh, G. H. Chen, J. H. Huang and H. S. Chen, J. Phys. Chem. C, 2017, 121, 28373–28384 CrossRef.
- C. Ma and Z. L. Wang, Adv. Mater., 2005, 17, 2635–2639 CrossRef.
- X. Duan, Y. Huang, R. Agarwal and C. M. Lieber, Nature, 2003, 421, 241–245 CrossRef PubMed.
- R. M. Ma, L. Dai and G. G. Qin, Nano Lett., 2007, 7, 868–873 CrossRef PubMed.
- T. Gao, Q. H. Li and T. H. Wang, Appl. Phys. Lett., 2005, 86, 173105–173108 CrossRef.
- Q. L. Zhang, H. W. Liu, P. F. Guo, D. Li, P. Fan, W. H. Zheng, X. L. Zhu, Y. Jiang, H. Zhou, W. Hu, X. J. Zhuang, H. J. Liu, X. F. Duan and A. L. Pan, Nano Energy, 2017, 32, 28–35 CrossRef.
- P. F. Guo, J. Y. Xu, K. Gong, X. Shen, Y. Lu, Y. Qiu, J. Q. Xu, Z. J. Zou, C. L. Wang, H. L. Yan, Y. S. Luo, A. L. Pan, H. Zhang, J. C. Ho and K. M. Yu, ACS Nano, 2016, 10, 8474–8481 CrossRef PubMed.
- L. Li, H. Lu, Z. Y. Yang, L. M. Tong, Y. Bando and D. Golberg, Adv. Mater., 2013, 25, 1109–1113 CrossRef PubMed.
- G. Z. Dai, R. B. Liu, Q. Wan, Q. L. Zhang, A. L. Pan and B. S. Zou, Opt. Mater. Express, 2011, 1, 1185–1191 CrossRef.
- A. Pan, X. Wang, P. B. He, O. L. Zhang, Q. Wan, M. Zacharias, X. Zhu and B. S. Zou, Nano Lett., 2007, 7, 2970–2975 CrossRef PubMed.
- A. L. Pan, R. B. Liu, F. F. Wang, S. S. Xie, B. S. Zou, M. Zacharias and Z. L. Wang, J. Phys. Chem. B, 2006, 110, 22313–22317 CrossRef PubMed.
- S. Hussain, N. Won, J. Nam, J. Bang, H. Chung and S. Kim, ChemPhysChem, 2009, 10, 1466–1470 CrossRef PubMed.
- D. Bharali, D. Lucey, J. Harishankar, H. Pudavar and P. J. Prasad, J. Am. Chem. Soc., 2005, 127, 11364–11371 CrossRef PubMed.
- H. S. Chen, B. Lo, J. Y. Hwang, G. Y. Chang, C. M. Chen, S. J. Tasi and S. J. J. Wang, J. Phys. Chem. B, 2004, 108, 17119–17123 CrossRef.
- P. Reiss, G. Quemard, S. Carayon, J. Bleuse and F. Chandezon, Mater. Chem. Phys., 2004, 84, 10–13 CrossRef.
- H. Yang and P. H. Holloway, Appl. Phys. Lett., 2003, 82, 1965–1967 CrossRef.
- W. C. H. Choy, S. Xiong and Y. Sun, J. Phys. D: Appl. Phys., 2009, 42, 125410(6pp) CrossRef.
- O. Madelung, Semiconductors: Data Handbook, Springer, Berlin Heidelberg, 2004 Search PubMed.
- M. A. Hines and P. Guyot-Sionnest, J. Phys. Chem., 1996, 100, 468–471 CrossRef.
- B. O. Dabbousi, J. Rodriguez-Viejo, F. V. Mikulec, J. R. Heine, H. Mattoussi, R. Ober, K. F. Jensen and M. G. Bawendi, J. Phys. Chem. B, 1997, 101, 9463–9475 CrossRef.
- L. Manna, E. C. Scher, L. S. Li and A. P. Alivisatos, J. Am. Chem. Soc., 2002, 124(24), 7136–7145 CrossRef PubMed.
- R. G. Xie, M. Rutherford and X. G. Peng, J. Am. Chem. Soc., 2009, 131, 5691–5697 CrossRef PubMed.
- B. O. Dabbousi, J. Rodriguez-Viejo, F. V. Mikulec, J. R. Heine, H. Mattoussi, R. Ober, K. F. Jensen and M. G. Bawendi, J. Phys. Chem. B, 1997, 101, 9463–9475 CrossRef.
- D. V. Talapin, A. L. Rogach, A. Kornowski, M. Haase and H. Weller, Nano Lett., 2001, 1, 207–211 CrossRef.
- P. Jiang, C. N. Zhu, D. L. Zhu, Z. L. Zhang, G. J. Zhang and D. W. Pang, J. Mater. Chem. C, 2015, 3, 964–967 RSC.
- Z. Zhao, J. Zeng, Z. Ding, X. Wang and J. Hou, J. Appl. Phys., 2007, 102, 053509 CrossRef.
- B. O. Dabbousi, J. Rodriguez-Viejo, F. V. Mikulec, J. R. Heine, H. Mattoussi, R. Ober, K. F. Jensen and M. G. Bawendi, J. Phys. Chem. B, 1997, 101, 9463–9475 CrossRef.
- P. T. Nga, N. H. Yen, D. H. Cuong, N. N. Hai, N. X. Nghia, V. T. H. Hanh, L. V. Vu and L. Coolen, Int. J. Nanotechnol., 2015, 12(5/6/7), 525–537 CrossRef.
- X. Liu, Y. Jiang, F. Fu, W. Guo, W. Huang and L. Li, Mater. Sci. Semicond. Process., 2013, 16, 1723–1729 CrossRef.
- T. H. Yeom, S. H. Lee, I. G. Kim, S. H. Choh and Y. M. Yu, J. Korean Chem. Soc., 1998, 32, S705–S707 Search PubMed.
- S. Biswas, S. Kar and S. Chaudhuri, J. Phys. Chem. B, 2005, 109, 17526–17530 CrossRef PubMed.
| This journal is © The Royal Society of Chemistry 2018 |

