 Open Access Article
Flexible and high energy density solid-state asymmetric supercapacitor based on polythiophene nanocomposites and charcoal†
Vijeth H. ,
Ashokkumar S. P.,
Yesappa L.,
Niranjana M.,
Vandana M. and
Devendrappa H.
 *
*
Department of Physics, Mangalore University, Mangalagangothri, 574199, India. E-mail: dehu2010@gmail.com
First published on 7th September 2018
Abstract
An asymmetric supercapacitor (ASC) was constructed using a polythiophene/aluminium oxide (PTHA) nanocomposite as an anode electrode and charcoal as a cathode electrode. The highest specific capacitance (Csp) of the PTHA electrode was found to be 554.03 F g−1 at a current density (CD) of 1 A g−1 and that of the charcoal electrode was 374.71 F g−1 at 1.4 A g−1, measured using a three electrode system. The maximum Csp obtained for the assembled PTHA//charcoal asymmetric supercapacitor (ASC) was 265.14 F g−1 at 2 A g−1. It also showed a high energy density of 42.0 W h kg−1 at a power density of 735.86 W kg−1 and capacitance retention of 94.61% even after 2000 cycles. Moreover, it is worth mentioning that the asymmetric device was used to illuminate a light emitting diode (LED) for more than 15 minutes. This PTHA//charcoal ASC also possesses stable electrochemical properties in different bending positions and hence finds a promising application in flexible, wearable and portable energy storage electronic devices.
1. Introduction
Electrochemical capacitors or supercapacitors (SCs) are one of the widely used promising electrochemical energy storage devices which provide superior energy density, power density, rapid charging–discharging rate and long cycle life and can fill the gap amongst batteries and normal capacitors.1 Recently, the flexible supercapacitors have become favorable contenders for portable and wearable energy storage electronic devices.2–6 Mainly, supercapacitors can be categorized into electrical double layer capacitors (EDLCs) and pseudocapacitors (PC) based on the various charge storage mechanisms.7,8 In general, the energy storage process shows electrostatic behavior in EDLCs and separation of charges takes place at the interface of the electrode and electrolyte. Conventional carbon based materials like activated carbon, carbon nanotubes, graphene9–11 etc. are commonly used in EDLCs, whereas in pseudocapacitors the charge storage mechanism is faradic in nature i.e., electron charge transfer takes place between the electrode and electrolyte.7 Conducting polymers are suitable as pseudocapacitor electrode materials because of their significant advantages in intrinsic flexibility and high electrical conductivity compared to other materials which makes them perfect candidates for high-performance flexible SCs. For this purpose, conducting polymers like polyaniline, polypyrrole, polythiophene12–15 and metal oxides like RuO2, MnO2, NiO, Co3O4, ZnO and Al2O3 (ref. 15–20) composites are used to develop desirable and flexible energy storage devices. Among the mentioned conducting polymers, polythiophene (PTH) is specifically suitable and appropriate for SC fabrication21 because of its excessive pseudocapacitance, high electrical conductivity, high energy density, low cost, and environmentally friendly nature.22,23 However, the metal oxides have received more interest due to their enhancement in the electrochemical parameters like high Csp, cycle life, energy density and also high electrical conductivity. Many attempts were done to fabricate pseudocapacitor using conducting polymer with metal oxide composite. Among various metal oxides, MnO2 has been extensively studied as they exhibits high pseudocapacitance and theoretical specific capacitance, energy density and longer cycle life.24 Jalal Arjomandi et. al., reported high performing supercapacitor electrode material based on polyaniline/aluminium oxide20 with the specific capacitance of 292 F g−1 and 91% capacitance retention over 8000 cycles. These results show that high Csp and extensive cyclic stability can be achieved if the conducting polymer is composited with Al2O3.25Advanced SCs have been fabricated for practical application with high operating potential and energy density without compromising power density and cyclic stability. As energy density of SCs is  by improving the Csp and operating potential (V) one can enhance the energy density. In order to increase both Csp and V the promising way is to develop the asymmetric SC device. In this concern, ASC was constructed using battery sort of faradic cathode (energy source) and capacitor like anode (power source) which offers many advantages like high Csp and long cycle life from supercapacitor and energy density from battery type electrode.26–28 Moreover, electrochemical properties of ASC depend on the potential window of two electrodes. Many researchers have studied the performance of asymmetric SCs based on materials like activated carbon GO/PPy/AC, G/MnO2//AC and PANI/AC.29–31
In this work, it is focussed on enhancing the power density, energy density, and life cycle of supercapacitors. The main objective of the work is to identify the highly efficient device with low cost, large scale production, environmental friendly anode and cathode electrodes. Charcoal has been chosen as one of the prominent cathode electrode material since it has large surface area and high electrical conductivity which will enhance the transport of electrolyte ions and leads to high energy storage capacity.32,33 Polymer nanocomposites with size less than 100 nm possess high surface-to-volume ratio which allows fast transport of electrolyte ions20 in SCs while the activated carbon with large surface area will enhance the absorption/desorption of electroactive species, thus leading to high performance asymmetric supercapacitor.
For the first time, we have fabricated a flexible solid state ASC using polythiophene/Al2O3 nanocomposite as an anode electrode and a charcoal-based cathode electrode. The camphor sulfonic acid surfactant assisted polythiophene/Al2O3 nanocomposite was synthesized by chemical polymerization method with various mass ratios of Al2O3, and PTHA//charcoal ASC device was fabricated. This work gives a new approach to the broader application of highly flexible ASC in portable and wearable energy storage devices.
2. Experimental techniques
2.1. Materials
The monomer thiophene (C4H4S) (Sigma-Aldrich, 99%), camphor sulfonic acid (CSA) (Sigma-Aldrich, 99%), and polyvinylidene difluoride (PVDF) (Sigma-Aldrich, 99%) were used without further purification. Aluminium oxide (Al2O3) powder, polyvinyl alcohol (PVA), potassium hydroxide (KOH), APS (NH4)2S2O8 (mol. wt 228.20 g), N-methyl pyrrolidine (NMP), charcoal (activated carbon) from Merck chemicals and deionized (DI) water was used throughout the experiments.2.2. Synthesis of polythiophene/Al2O3 nanocomposites
0.01 M camphor sulfonic acid (CSA) and 0.1 M thiophene monomer was dispersed in 30 ml of DI water and these solutions were stirred thoroughly for about 60 minutes; 0.1 M solution of ammonium peroxydisulphate (APS) is prepared in 60 ml of DI water and this solution was added dropwise to the monomer solution with constant stirring. This mixture solution was heated at 85 °C for 24 hours without stirring to get a black precipitate. The precipitate was rinsed with methanol and double distilled water for few times to remove the impurities and unreacted contents. Finally, the obtained product was dried in an oven for 5 hours at 80 °C to get a brownish black colored PTH powder.The polythiophene/Al2O3 nanocomposites were synthesized using the same above procedure by adding 1 wt%, 2 wt% and 5 wt% of Al2O3 into the primary monomer solution and coded as PTHA1, PTHA2, and PTHA5 respectively.
2.3. Fabrication of asymmetric supercapacitor
The fabrication of PTHA electrode was done by mixing the PTHA sample, carbon black and PVDF with a mass ratio of 80![[thin space (1/6-em)]](https://www.rsc.org/images/entities/char_2009.gif) :
:![[thin space (1/6-em)]](https://www.rsc.org/images/entities/char_2009.gif) 10
10![[thin space (1/6-em)]](https://www.rsc.org/images/entities/char_2009.gif) :
:![[thin space (1/6-em)]](https://www.rsc.org/images/entities/char_2009.gif) 10 in NMP solution. The obtained slurry was pasted uniformly on to the copper foil (1 × 1 cm) and dried at 80 °C for 6 hours. This PTHA electrode was used as an anode electrode in the ASC device. The cathode electrode was fabricated using a paste of charcoal and PVDF prepared with a mass ratio of 90
10 in NMP solution. The obtained slurry was pasted uniformly on to the copper foil (1 × 1 cm) and dried at 80 °C for 6 hours. This PTHA electrode was used as an anode electrode in the ASC device. The cathode electrode was fabricated using a paste of charcoal and PVDF prepared with a mass ratio of 90![[thin space (1/6-em)]](https://www.rsc.org/images/entities/char_2009.gif) :
:![[thin space (1/6-em)]](https://www.rsc.org/images/entities/char_2009.gif) 10 in NMP solution and pasted on to the copper foil (1 × 1 cm). The PVA/KOH gel electrolyte was prepared as in the previously reported study.34 In this process, 3 gram of PVA was dissolved in 30 ml of DI water under rigorous stirring and 3 gram of KOH was dissolved in another 30 ml of DI water. The prepared solutions were mixed together and heated for 1 hour at 80 °C under rigorous stirring till a gel electrolyte was formed. A solid-state ASC device was assembled by sandwiching a thin layer of PVA/KOH gel electrolyte between PTHA and charcoal electrode and is separated by a Whatmann paper.
10 in NMP solution and pasted on to the copper foil (1 × 1 cm). The PVA/KOH gel electrolyte was prepared as in the previously reported study.34 In this process, 3 gram of PVA was dissolved in 30 ml of DI water under rigorous stirring and 3 gram of KOH was dissolved in another 30 ml of DI water. The prepared solutions were mixed together and heated for 1 hour at 80 °C under rigorous stirring till a gel electrolyte was formed. A solid-state ASC device was assembled by sandwiching a thin layer of PVA/KOH gel electrolyte between PTHA and charcoal electrode and is separated by a Whatmann paper.
2.4. Nanocomposite characterisation and electrochemical measurements
The chemical compositions of the synthesized PTHA nanocomposites were studied using X-ray photoelectron spectroscopy (XPS) technique (AXIS ULTRA from AXIS 165). Surface morphology of PTH and PTHA nanocomposites were examined using atomic force microscopy (AFM Bruker) in the tapping mode. The sample for AFM characterization was made by drop casting the PTH and PTHA nanocomposites on a silicon wafer. Thermal behavior was examined by thermogravimetric analysis using TGA instrument in a temperature range of 0–900 °C with a heating rate of 5 °C min−1.The electrochemical characterization such as CV test, GCD study and impedance spectroscopy studies were made using three electrodes configuration, with a platinum rod as a counter electrode, Ag/AgCl as a reference electrode and fabricated composite electrode as a working electrode in 1 M KCl aqueous electrolyte solution. All the electrochemical performances were studied using electrochemical workstation model CHI 660E.
3. Results and discussion
3.1. XPS analysis
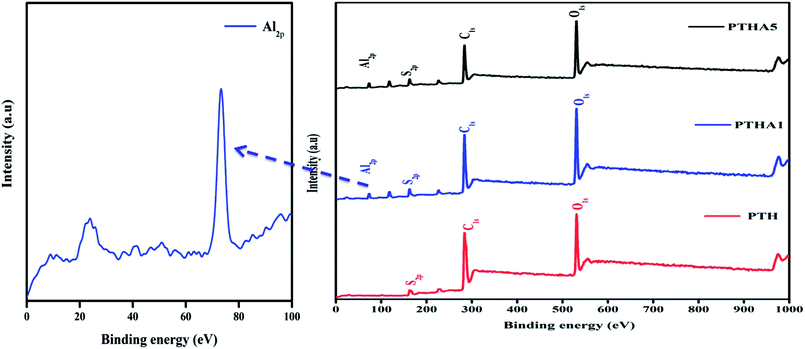
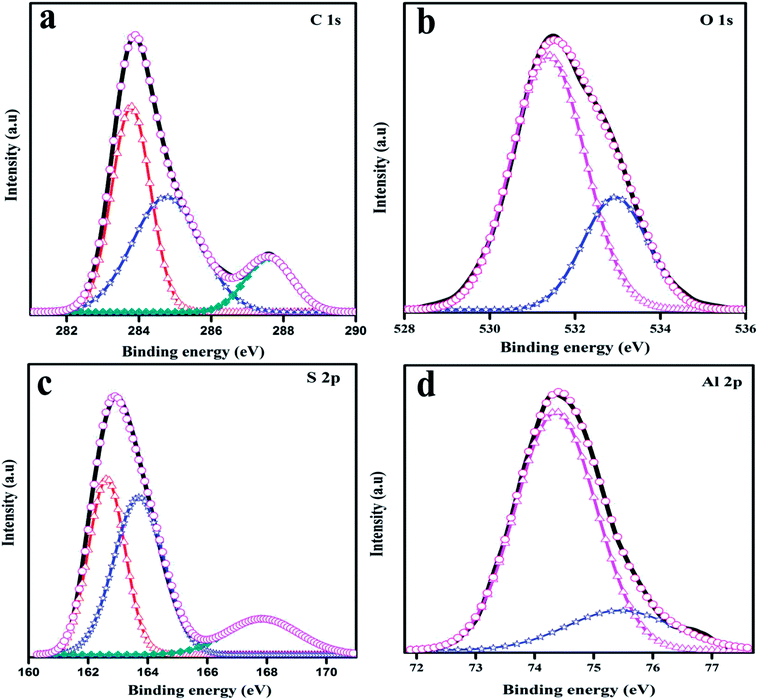
In-depth information about the surface chemical composition of the synthesized PTH and PTHA nanocomposites was acquired by XPS spectra. The resolved spectra of C1s, O1s, S2p and Al2p and wide scan (survey spectrum) are shown in Fig. 1(a). The survey scan spectrum confirms the presence of chemicals such as carbon (C), oxygen (O), sulphur (S) and aluminium (Al) in PTHA nanocomposite.The deconvoluted high-resolution spectrum further confirms the structure, and well-defined core level spectra of the compound. Fig. 2(a) shows the C1s core level spectra decomposed into three peaks. The lowest binding energy peak at 284.69 eV is ascribed to α and β aromatic carbons of PTH backbone. The peak at 285.64 eV is linked with C–S bond and that at 288.47 eV resembles the C–O bond respectively. Fig. 2(b) represents core-level O 1 s spectrum of PTHA nanocomposite; the peak observed at lower binding energy (531.39 eV) is attributed to Al–O–Al bond and the peak at 532.92 eV is assigned to OH groups.
In Fig. 2(c), the S 2p peak can be deconvoluted into three peaks as S2p3/2 at 162.65 eV and S2p1/2 at 163.69 eV which corresponds to sulphur in thiophene,35 while the peak positioned at about 167.79 eV is attributed to SO32− group.36 The S2p spectra suggests the successful polymerization of thiophene. The Al2p XPS spectrum of the nanocomposite is shown in Fig. 2(d). The two peaks at 74.34 eV and 75.46 eV are assigned to the Al2p3/2 and Al2p1/2 from Al2O3.37 The above analysis suggests the successful synthesis of PTHA nanocomposites.
3.2. Atomic force microscopy
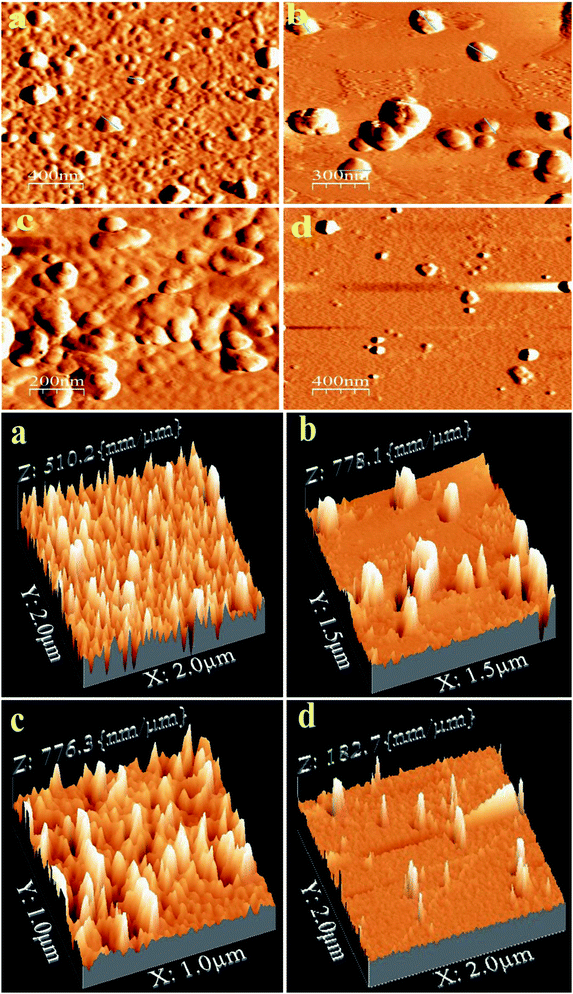
AFM is a powerful tool to study the structural morphology and surface roughness of the compounds. AFM images of PTH and PTHA nanocomposites on a silicon wafer are shown in Fig. 3. The images show the spherical morphology with particle size ranging from 60 to 150 nm in diameter. A uniform arrangement of particles is seen in PTH, whereas a small amount of aggregation can be seen in PTHA samples.The AFM 3-D micrograph images of PTH and PTHA2 show uniform and homogeneous morphology with high prominent flakes having an average height of ∼150 nm. This result indicates the compatibility of the polymer matrix with nanoparticles. It is further verified by considering the surface roughness of the PTH and PTHA nanocomposites. The average surface roughness obtained from the topographical analysis (1 μm to 2 μm areas) is 25.4 and 30.8 nm which indicates that the PTH exhibit smooth surface than the PTHA nanocomposites. The smoothness of the PTH surface indicates the amorphous nature. These morphological differences seen in the nanocomposites can affect their physical properties.38
3.3. TGA analysis
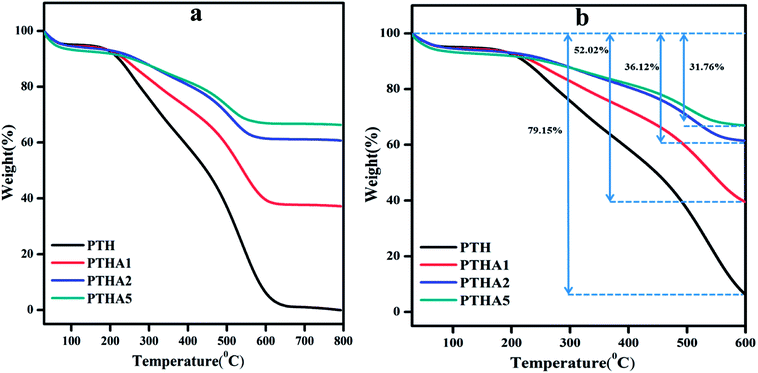
The thermogravimetric analysis (TGA) gives the information about thermal properties of the composites as shown in Fig. 4(a).The TGA curve of PTH shows decomposition in two steps. The first decomposition is about 4.26% which is due to moisture and water on the surface of the materials and the thermogram is stable up to 190 °C. From 190 °C the thermogram shows a fast decomposition with a weight loss of 89.91% which ends at 626 °C as shown in Fig. 4(b).
The second major weight loss is because of the removal of elements such as carbon, hydrogen, and sulphur in thiophene monomer.39 The PTHA nanocomposite also shows two stages of weight loss which are summarised in Table S1.† In comparison with PTH, the weight loss of PTHA nanocomposites is found to be relatively decreased. A total weight loss of 59.55%, 36.00%, and 29.84% is found in PTHA1, PTHA2, and PTHA5 respectively. Incorporation of the nanocomposite into polythiophene (in the presence of surfactant) is expected to enhance the thermal stability of polythiophene. It is noted that PTH shows 20.86% retention up to 550 °C, whereas PTHA1, PTHA2, and PTHA5 show 52.02%, 36.12% and 31.76% retention up to 550 °C respectively. Fig. 4(b) shows that PTHA nanocomposites are more stable than the PTH.
3.4. Current–voltage characteristics
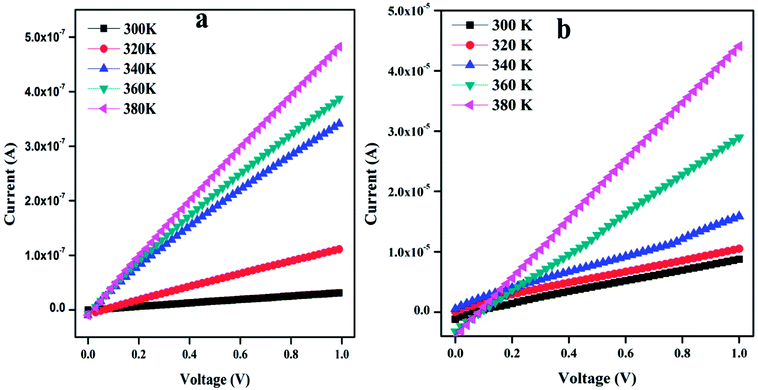
Fig. 5 shows the temperature-dependent I–V characteristics of PTH and PTHA5 nanocomposite. The I–V characteristics show almost linear relationship and it is to be noticed that the value of current increases with the applied voltage and increase in the temperature.The value of dc conductivity (σ) can be calculated using the I–V curve of PTH and PTHA5 nanocomposite using below equation.
3.5. Electrochemical characterisation
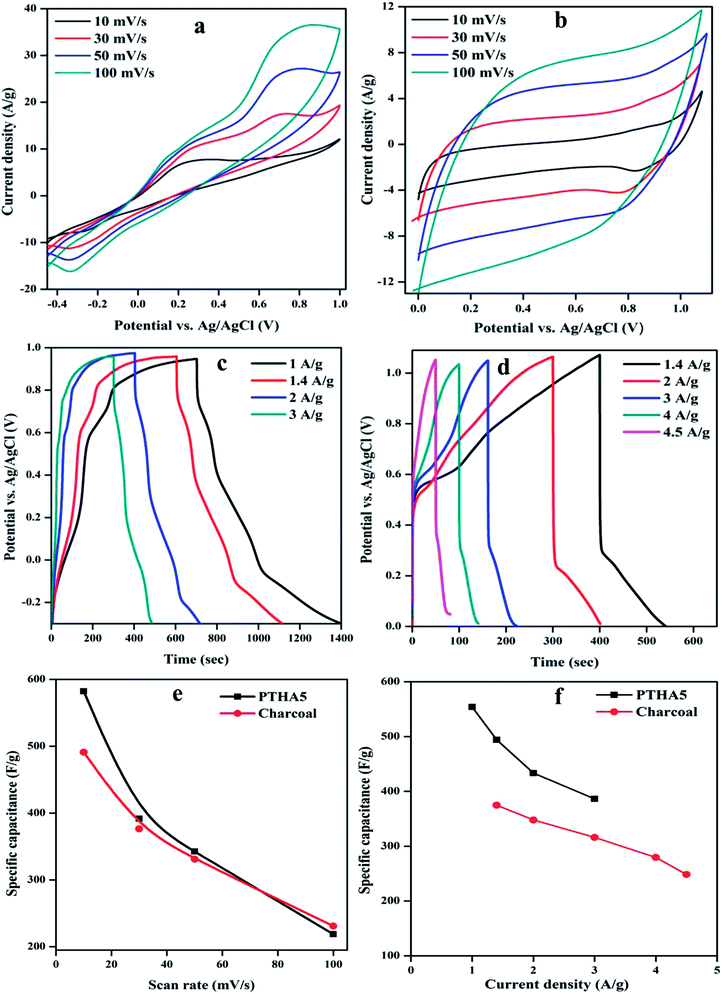
To study the electrochemical performance of PTHA5 and charcoal electrode using cyclic voltammetry (CV) test, galvanostatic charging/discharging (GCD), impedance spectroscopy studies were carried out. The CV measurements at different scan rate were done using 3-electrode configuration in 1 M KCl aqueous electrolyte. Fig. 6(a) shows the CV curves of PTHA5 electrode, a pair of redox peaks appeared which represents pseudocapacitance behavior with good charge diffusion at the electrode surface. The cyclic voltammetry curves for various scan rates from 10 to 100 mV s−1 were collected. It was clearly noticed that at higher scan rates, cathodic peak shifts towards positive side and anodic peak shifts towards the negative side due to the internal resistance occurred in the electrode. Also, area of CV curve increases with the increase in the scan rate showing good rate performance.Fig. 6(b) shows the CV curve of a charcoal electrode, carried out using three electrodes configuration in 1 M KCl aqueous electrolyte in the operating voltage window of 0 to 1.1 V. All cyclic voltammetry curves show rectangular shape, which denotes the typical EDLC characteristics. The CV curves for different scan rates from 10 to 100 mV s−1 shows approximately symmetric curves indicating highly reversible stability of charcoal electrode. The high scan rate curves are equivalent to low scan rate curves with little distortion, which signifies the high rate of charge/discharge capability and effective ionic and electronic transfer inside the electrode material.40
The Csp from the CV curve is calculated using following equation;
In addition to the investigation of electrochemical performance of the prepared electrode, the GCD measurement has also been carried out. Fig. 6(c) represents the GCD curve for the PTHA5 electrode at different CDs in three-electrode configuration. The GCD curves show deviance from the ideal triangular shape, which represents the substantial influence of pseudocapacitance. It can be clearly observed that at lower CDs, the electrolyte ions get more time to penetrate into the interior plane of the electrode material. Hence, both the inner and outer surfaces contribute to enhance the electrochemical performance at lower CDs, which increases the specific capacitance of the material. In case of higher CDs, the interaction of electrolyte ions occurs only with external surfaces of the electrode material because of limited time access of electrolyte ions. As a result, decrease in the Csp can be observed.42 A longer discharge time is witnessed for the PTHA5 composite electrode which tells us about enhanced charge storage properties in the PTHA5 electrode.
Fig. 6(d) shows the GCD curve of the charcoal electrode for different CDs. The curves show quasi-triangular shapes which are nonlinear and not highly symmetric at different CDs. It confirms faradic transformation and the presence of both EDLC and pseudocapacitive behavior.
The CSp from the GCD curve is calculated using the following relation.
The maximum specific capacitance calculated using discharge curve for PTHA5 electrode is found to be 554.03 F g−1 at CD of 1.0 A g−1, whereas charcoal electrode shows 374.71 F g−1 at CD of 1.4 A g−1. Fig. 6(f) indicates the change in the specific capacitance based on the discharge curve for different CDs; values are tabulated in Table S3.† It shows that Csp of electrode material increases with decrease in the CD because of partial diffusion of electrolyte ions which restrict the transport of ions to the surface of the electrode under high CD. As a result, there is less utilization rate of electrode materials and charge–discharge time increased with a decrease in CD. More importantly, it is noticed that there is decrease in the specific capacitance from 554.03 to 386.45 F g−1 with increase in CD from 1 to 3 A g−1 for PTHA5 electrode and also charcoal electrode shows a decrease in specific capacitance from 374.71 to 248.45 F g−1 with increase in CDs from 1.4 to 4.5 A g−1. The PTHA5 electrode can retain about 69.75% specific capacitance when the CDs is increased from 1 to 3 A g−1, indicating an excellent rate capability whereas charcoal electrode retains 66.30% when the CD is increased from 1.4 to 4.5 A g−1. The high rate performance of PTHA5 and charcoal electrode is ascribed to the high specific area distribution. These results are well matched with the cyclic voltammetry measurements.
3.6. Electrochemical impedance spectroscopy
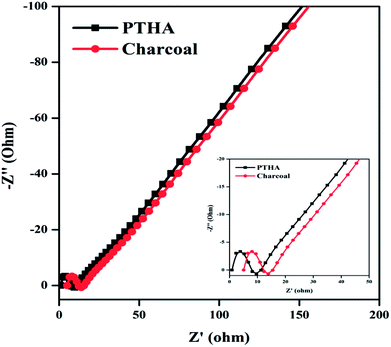
To understand the electrolyte ion transport and capacitance behavior of the PTHA5 and charcoal electrode, the Nyquist plots are plotted using EIS measurements.Fig. 7 shows the impedance Nyquist plot of PTHA and charcoal electrode from 0.01 Hz to 100 kHz frequency range using 1 M KCl electrolyte. High-frequency region of both PTHA and charcoal electrode consists of a semi-circle and the lower frequency region consists a straight line. The charge transfer resistance (Rct) of electrode and electrolyte interface can be obtained by the diameter of the semicircle at high frequency region, whereas bulk solution resistance (Rs) of the electrode is given by the intercept at the real axis and Rs, which includes intrinsic resistance occurred from electroactive material, resistance from electrolyte ions and resistance due to contact between electrolyte and electrode interface. From the Nyquist plot, PTHA and charcoal electrodes are found to have Rs values of 0.98 and 4.52 Ω and Rct values of 4.77 and 6.64 Ω respectively. They are significantly lower values, which predict fast charge transfer in the electrode material. The linear part of lower frequency region which is at an angle of 75° specifies the Warburg diffusion region, implying the ideal capacitive behavior of the electrode.43
3.7. Asymmetric supercapacitor based on PTHA and charcoal
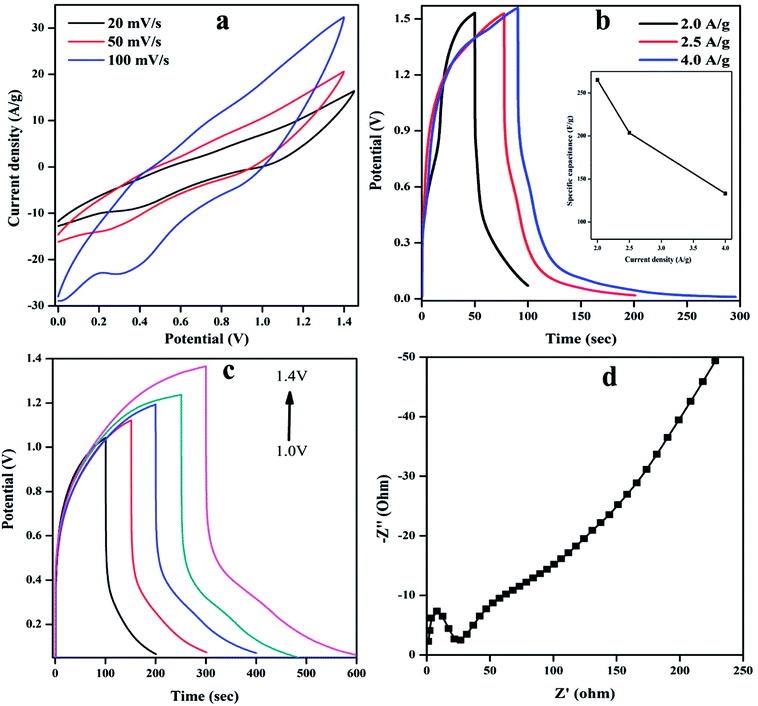
Considering the remarkable electrochemical performance, the EDLC and pseudocapacitance properties of PTHA and charcoal electrode, an ASC device is fabricated using the PTHA as an anode and charcoal as a cathode with PVA–KOH gel as the solid-state electrolyte. Fig. 8 shows the electrochemical performance of assembled PTHA//charcoal asymmetric supercapacitor device.Fig. 8(a) shows CV curve of PTHA//charcoal ASC device for various scan rates. All the cyclic voltammetry curves retain their nearly rectangular shape with small redox peaks at different scan rates, which confirms EDLC and pseudocapacitance behavior. The slight deviation from the ideal capacitor at various scan rates is possibly due to the ion diffusion resistance transfer from the gel electrolyte to electrodes.44 The specific capacitances are found to be 548.28, 302.45 and 268.97 F g−1 at different scan rates of 20, 50 and 100 mV s−1 respectively. At higher scan rate, there is a decrease in the specific capacitance because of the slower ion diffusion.45 The specific capacitance of the PTHA//charcoal ASC can be retained up to 49.05%, exhibiting excellent capacitance retention.
Fig. 8(b) represents the GCD curves of PTHA//charcoal ASC for various CDs of 2, 2.5 and 4 A g−1. The GCD curves show slight divergence from ideal triangular shape showing the substantial contribution from pseudocapacitance behavior and also considerably longer discharging time is attained indicating larger Csp of PTHA//charcoal ASC device. The Csp of PTHA//charcoal ASC is found to be 265.14, 203.56 and 133.06 F g−1 at a different CDs of 2, 2.5 and 4 A g−1 respectively. Fig. 8(b) (inset image) shows that the Csp decreases with the increase in the CD, which is due to slower ion diffusion, which cannot follow the ion consumption at higher CD.
Fig. 8(c) shows the GCD curve for different potential window 1 to 1.4 V at a CD of 1.5A g−1. The non-linear behavior of the PTHA//charcoal ASC shows the good electrochemical stability and the maximum potential window of the device. With an increase in the operating voltage window, there is an increase in discharge time, which implies that operating voltage window is directly responsible for the high capacitive response of the ASC.
The electrochemical behavior of PTHA//charcoal ASC is further investigated using EIS studies as shown in Fig. 8(d). The EIS test was measured in the frequency range from 0.01 Hz to 100 kHz. Higher frequency region of the Nyquist plot consists of semicircle arc and in lower frequency region a straight line is observed.
The charge transfer resistance (Rct) can be measured by considering the diameter of semicircle arc which is caused due to faradic reaction between the electrode and a gel electrolyte. The X-intercept of Nyquist plot gives the equivalent series resistance (ESR) which is found to be 2.13 Ω and Rct is 18.03 Ω in the lower part of the frequency region. The plot shows a straight line with an angle of more than 45° showing a deviance from ideal capacitive nature, and also the presence of a small diffusion resistance of ions inside the electrode material.46
The cycle life of ASC was evaluated at 20 mV s−1 as shown in Fig. 9(a). It can be clearly noticed that ASC shows excellent cycle life with 94.61% of the initial Csp even after 2000 cycles, the 1st and 2000th cycle are shown in inset Fig. 9(a) signifying the prominent energy storage capability of solid-state ASC.
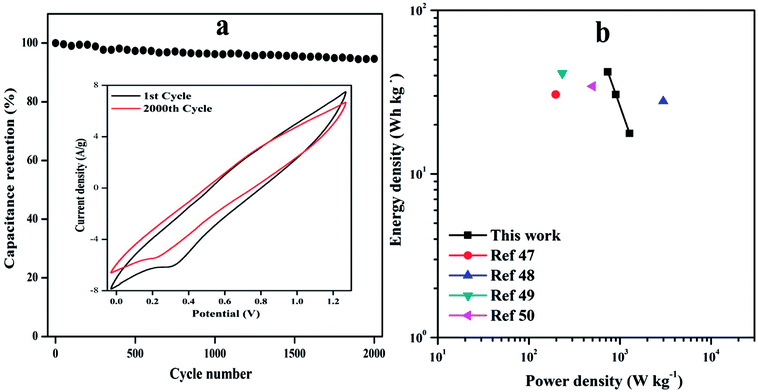 | ||
| Fig. 9 (a) Cyclic performance of device at a scan rate of 10 mV s−1 for 2000 cycles, inset plot shows CV curve of the 1st and 2000th cycle, (b) Ragone plot of the ED and PD of the ASC device. | ||
The energy density (ED) (W h kg−1) and power density (PD) (W kg) are estimated from GCD curves for various CD using below equations.
where Cs (F g−1) represents the calculated specific capacitances from the charging/discharging curve, ΔV is the change in the voltage during discharge process and t represents the discharge time. The calculated ED and PD are shown in Fig. 9(b).
The ASC device exhibits maximum ED of 42.0 W h kg−1 with PD of 735.86 W kg−1 and highest PD of 1276.9 W kg−1 at ED of 17.70 W h kg−1 is achieved with operating voltage window of 1.5 V. These results are much higher than that of other reported conducting polymer nanocomposites based symmetric supercapacitor (SSCs) or ASCs, such as PANI G@MnO2 ASC (30.6 W h kg−1, 197 W kg−1),47 VS2//C–Fe/PANI ASC (27.8 W h kg−1, 2991.5 W kg−1),48 C–Fe-PANI SSC (41.3 W h kg−1, 231.9 W kg−1)49 and NMP2 SSC (34.4 W h kg−1, 500 W kg−1),50 which are tabulated in Table S4.†
A series of mechanical flexibility test was performed in order to validate the potential application of the fabricated PTHA//charcoal ASC device in portable and wearable electronic devices. The different bending positions like normal, bending I, bending II and twisting is shown in Fig. 10(a), (b), (c) and (d) respectively. No significant difference was found among these CV curves. Almost overlapped CV curves were achieved with various bending positions (at a scan rate of 10 mV s−1), which emphasizes the outstanding flexibility and stability of PTHA//charcoal ASC device. Fig. 10(e) shows the ASC device can retain up to 97.92% of its original capacitance under different bending positions, even twisted condition PTHA//charcoal ASC shows stable electrochemical performance and flexibility which indicates that constructed solid state ASC device is extremely flexible and can be bended and folded without damaging the structural integrity of the device.
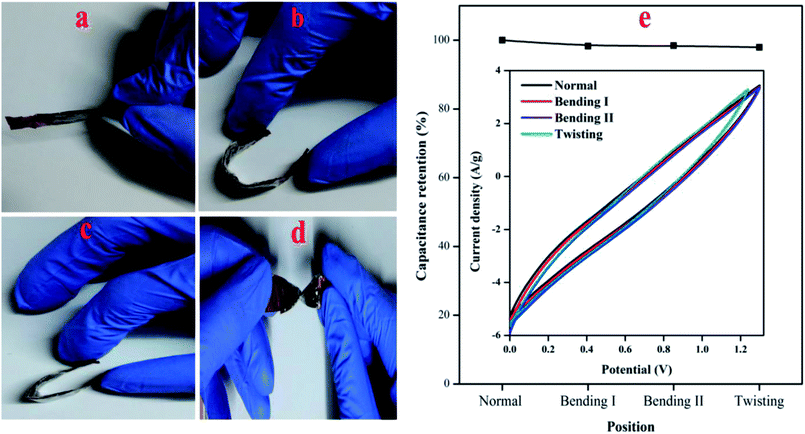 | ||
| Fig. 10 Digital photos of solid state asymmetric supercapacitor at different bending position (a) normal, (b) bending I, (c) bending II and (d) twisting. (e) CV curves of different bending positions. | ||
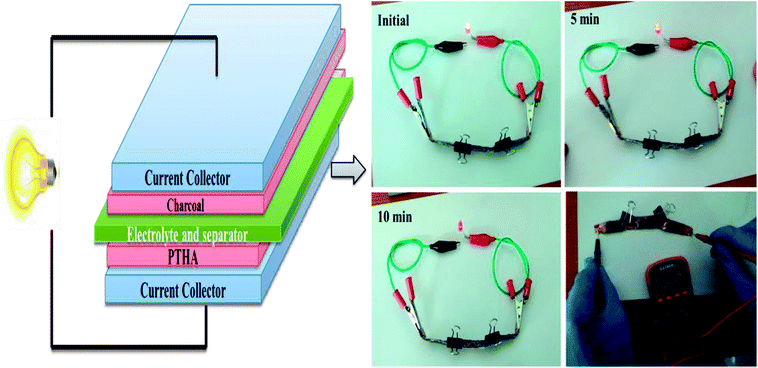
As device exhibit maximum operating potential up to 1.5 V and high energy density, the charged PTHA//charcoal ASC can be effectively used to glow the red LED for more than 10 minutes when three such devices are connected in series. It gives 4.83 V which indicates good energy storage ability as shown in Fig. 11. Considering the excellent electrochemical performance, the fabricated PTHA//charcoal ASC serves as flexible, efficient and high-performance wearable energy storage device.
4. Conclusions
In summary, the PTHA//charcoal based asymmetric supercapacitor was fabricated using PTHA nanocomposites as an anode electrode and charcoal as a cathode electrode. The highest Csp of the PTHA electrode was found to be 554.03 F g−1 at charge density of 1 A g−1 and that of the charcoal electrode was 374.71 F g−1 at 1.4 A g−1. The assembled PTHA//charcoal ASC showed maximum Csp of 265.14 F g−1 at 2 A g−1 and also maximum energy density of 42.0 W h kg−1 with the power density of 735.86 W kg−1. Moreover, ASC device exhibits capacitance retention of 94.61% even after 2000 cycles. In addition, the fabricated ASC device showed good mechanical stability with different bending positions. Therefore, the ASC device serves as flexible and high efficient wearable and portable energy storage device.Conflicts of interest
The authors declare no competing financial interest.Acknowledgements
The author would like to thank Mangalore University for providing research fellowship. Authors gratefully acknowledge INUP program funded by Govt. of India, CENSE, IISC Bangalore, India, and DST-PURSE facility, Mangalore University for providing characterization facilities.References
- L. Huang, X. Yao, L. Yuan, B. Yao, X. Gao, J. Wan, P. Zhou, M. Xu, J. Wu, H. Yu and Z. Hu, Energy Storage Materials, 2018, 12, 191–196 CrossRef.
- W. Liu, M. S. Song, B. Kong and Y. Cui, Adv. Mater., 2017, 29, 1603436 CrossRef PubMed.
- L. Dong, C. Xu, Y. Li, Z. H. Huang, F. Kang, Q. H. Yang and X. Zhao, J. Mater. Chem. A, 2016, 4, 4659–4685 RSC.
- X. Cai, C. Zhang, S. Zhang, Y. Fang and D. Zou, J. Mater. Chem. A, 2017, 5, 2444–2459 RSC.
- Y. Wang, Y. Song and Y. Xia, Chem. Soc. Rev., 2016, 45, 5925–5950 RSC.
- L. Huang, B. Yao, J. Sun, X. Gao, J. Wu, J. Wan, T. Li, Z. Hu and J. Zhou, J. Mater. Chem. A, 2017, 5, 2897–2903 RSC.
- P. Simon and Y. Gogotsi, Nat. Mater., 2008, 7, 845 CrossRef PubMed.
- G. Wang, L. Zhang and J. Zhang, Chem. Soc. Rev., 2012, 41, 797–828 RSC.
- S. Bose, T. Kuila, A. K. Mishra, R. Rajasekar and N. H. Kim, J. Mater. Chem., 2012, 22, 767–784 RSC.
- L. L. Zhang and X. S. Zhao, Chem. Soc. Rev., 2009, 38, 2520–2531 RSC.
- C. Liu, Z. Yu, D. Neff, A. Zhamu and B. Z. Jang, Nano Lett., 2010, 10, 4863–4868 CrossRef PubMed.
- R. Hu, J. Zhao, G. Zhu and J. Zheng, Electrochim. Acta, 2018, 261, 151–159 CrossRef.
- R. Yuksel, E. Alpugan and H. E. Unalan, Org. Electron., 2018, 52, 272–280 CrossRef.
- C. Fu, H. Zhou, R. Liu, Z. Huang, J. Chen and Y. Kuang, Mater. Chem. Phys., 2012, 132, 596–600 CrossRef.
- V. Subramanian, S. C. Hall, P. H. Smith and B. Rambabu, Solid State Ionics, 2004, 175, 511–515 CrossRef.
- M. W. Xu, W. Jia, S. J. Bao, Z. Su and B. Dong, Electrochim. Acta, 2010, 54, 5117–5122 CrossRef.
- W. Yang, Z. Gao, J. Ma, X. Zhang, J. Wang and J. Liu, J. Mater. Chem. A, 2014, 2, 1448–1457 RSC.
- K. Deori, S. K. Ujjain, R. K. Sharma and S. Deka, ACS Appl. Mater. Interfaces, 2013, 5, 10665–10672 CrossRef PubMed.
- J. Wang, Z. Gao, Z. Li, B. Wang, Y. Yan, Q. Liu and Z. Jiang, J. Solid State Chem., 2011, 184, 1421–1427 CrossRef.
- J. Arjomandi, J. Y. Lee, R. Movafagh, H. O. B. Moghanni and M. H. Parvin, J. Electroanal. Chem., 2018, 810, 100–108 CrossRef.
- A. Laforgue, P. Simon, C. Sarrazin and J. F. Fauvarque, J. Power Sources, 1999, 80, 142–148 CrossRef.
- C. Fu, H. Zhou, R. Liu, Z. Huang, J. Chen and Y. Kuang, Mater. Chem. Phys., 2012, 132, 596–600 CrossRef.
- K. Liu, Z. Hu, R. Xue, J. Zhang and J. Zhu, J. Power Sources, 2008, 179, 858–862 CrossRef.
- L. Wang, Y. Ouyang, X. Jiao, X. Xia, W. Lei and Q. Hao, Chem. Eng. J., 2018, 334, 1–9 CrossRef.
- J. Arjomandi, J. Y. Lee, F. Ahmadi, M. H. Parvin and H. O. B. Moghanni, Electrochim. Acta, 2017, 251, 212–222 CrossRef.
- Z. Fan, J. Yan, T. Wei, L. Zhi, G. Ning, T. Li and F. Wei, Adv. Funct. Mater., 2011, 21, 2366–2375 CrossRef.
- P. Simon and Y. Gogotsi, Acc. Chem. Res., 2012, 46, 1094–1103 CrossRef PubMed.
- B. G. Choi, M. Yang, W. H. Hong, J. W. Choi and Y. S. Huh, ACS Nano, 2012, 6, 4020–4028 CrossRef PubMed.
- L. Q. Fan, G. J. Liu, J. H. Wu, L. Liu, J. M. Lin and Y. L. Wei, Electrochim. Acta, 2014, 137, 26–33 CrossRef.
- Z. Fan, J. Yan, T. Wei, L. Zhi, G. Ning, T. Li and F. Wei, Adv. Funct. Mater., 2011, 21, 2366–2375 CrossRef.
- J. H. Park and O. O. Park, J. Power Sources, 2002, 111, 185–190 CrossRef.
- T. Y. Wei, C. H. Chen, K. H. Chang, S. Y. Lu and C. C. Hu, Chem. Mater., 2009, 21, 3228–3233 CrossRef.
- N. Choudhary, C. Li, J. Moore, N. Nagaiah, L. Zhai, Y. Jung and J. Thomas, Adv. Mater., 2017, 29, 1605336 CrossRef PubMed.
- Q. Wang, X. Wang, B. Liu, G. Yu, X. Hou, D. Chen and G. Shen, J. Mater. Chem. A, 2013, 1, 2468–2473 RSC.
- W. Feng, A. S. Wan and E. Garfunkel, J. Mater. Chem. C, 2013, 117, 9852–9863 Search PubMed.
- J. Chen, N. Wang, H. Ma, J. Zhu, J. Feng and W. Yan, J. Chem. Eng. Data, 2017, 62, 2208–2221 CrossRef.
- D. Guan, J. A. Jeevarajan and Y. Wang, Nanoscale, 2011, 3, 1465–1469 RSC.
- H. Shi, C. Liu, J. Xu, H. Song, B. Lu, F. Jiang and Q. Jiang, ACS Appl. Mater. Interfaces, 2013, 5, 12811–12819 CrossRef PubMed.
- M. Sharif and B. Pourabas, RSC Adv., 2016, 6, 93680–93693 RSC.
- X. He, W. Yang, X. Mao, L. Xu, Y. Zhou, Y. Chen and J. Xu, J. Power Sources, 2018, 376, 138–146 CrossRef.
- X. Wang, B. Liu, R. Liu, Q. Wang, X. Hou, D. Chen and G. Shen, Angew. Chem., 2014, 126, 1880–1884 CrossRef.
- C. C. Hu, E. Chen and J. Y. Lin, Electrochim. Acta, 2002, 47, 2741–2749 CrossRef.
- D. S. Dhawale, A. Vinu and C. D. Lokhande, Electrochim. Acta, 2011, 56, 9482–9487 CrossRef.
- Y. Xiao, S. Liu, F. Li, A. Zhang, J. Zhao, S. Fang and D. Jia, Adv. Funct. Mater., 2012, 22, 4052–4059 CrossRef.
- Y. Li, X. Zhao, Q. Xu, Q. Zhang and D. Chen, Langmuir, 2011, 27, 6458–6463 CrossRef PubMed.
- W. Yang, Z. Gao, J. Ma, J. Wang, X. Zhang and L. Liu, Dalton Trans., 2013, 44, 15706–15715 RSC.
- M. A. Bavio, G. G. Acosta, T. Kessler and A. Visintin, Energy, 2017, 130, 22–28 CrossRef.
- M. N. Rantho, M. J. Madito, F. O. Ochai-Ejeh and N. Manyala, Electrochim. Acta, 2018, 260, 11–23 CrossRef.
- M. N. Rantho, M. J. Madito and N. Manyala, Electrochim. Acta, 2018, 260, 11–23 CrossRef.
- H. Wang, Y. Song, J. Zhou, X. Xu, W. Hong, J. Yan and J. Gao, Electrochim. Acta, 2016, 212, 775–783 CrossRef.
Footnote |
| † Electronic supplementary information (ESI) available. See DOI: 10.1039/c8ra06102e |
| This journal is © The Royal Society of Chemistry 2018 |

