 Open Access Article
Reactive adsorption desulfurization of NiO and Ni0 over NiO/ZnO–Al2O3–SiO2 adsorbents: role of hydrogen pretreatment
Feng Jua,
Miao Wang a,
Hui Luanab,
Pengyu Duc,
Zhihe Tangb and
Hao Ling*a
aState Key Laboratory of Chemical Engineering, East China University of Science and Technology, Shanghai 200237, China. E-mail: linghao@ecust.edu.cn
bResearch Institute of Safty & Environment Technology, China National Petroleum Corporation, Beijing 102206, China
cPetrochina Karamay Petrochemical Co. Ltd., Karamay, Xinjiang 834000, China
First published on 27th September 2018
Abstract
Reactive adsorption desulfurization (RADS) of Fluidized Catalytically Cracked (FCC) gasoline on reduced and unreduced NiO/ZnO–Al2O3–SiO2 adsorbents was studied. Various characterizations such as powder X-ray diffraction (XRD), H2-temperature-programmed reduction (H2-TPR), the H2/O2 pulse titration (HOPT), transmission electron microscopy (TEM) and X-ray photoelectron spectroscopy (XPS) are used to evaluate the effects of hydrogen pretreatment of the adsorbents. XRD and HOPT results indicate that NiO is hard to be reduced to Ni0 under the conditions of RADS. H2-TPR shows that NiO might be reduced to Ni0 at the temperature of 598 °C, much higher than the temperature of RADS. The Ni 2p3/2 spectrum of Ni0 is not observed for the reduced adsorbent, but the main peak of Ni 2p3/2 of NiS is found for the spent adsorbent. The unreduced NiO/ZnO–Al2O3–SiO2 adsorbent performs a better desulfurization than the reduced adsorbent at the beginning of desulfurization process. NiO and Ni0 are assumed as the main active components and present a good desulfurization ability in RADS. Finally, a change in the RADS mechanism is presented and discussed.
Introduction
Deep desulfurization of fossil oil is one of the most urgent and challenging tasks due to the stringent environmental legislations. Compared to the conventional hydrodesulfurization process, reactive adsorption desulfurization (RADS), as a new desulfurization process, could save the cost of hydrogen and reduce the loss of octane number.1,2 The commercial S-Zorb process developed by Conoco Philips Petroleum Co. is an effective RADS method for producing ultralow sulfur gasoline and diesel.3–6 In the RADS process, the active component Ni is regarded as important in the selective adsorption of sulfur atoms. Sulfur atoms of sulfur-containing molecules adsorb onto the adsorbents first, and then react with the adsorbents.7 The hydro-carbon portion of the molecule is released back into the product stream.Tawara et al. first investigated conventional HDS catalyst in the adsorptive HDS of kerosene, and found that the desulfurization performance of the oxidized Ni–Mo/Al2O3 catalyst was better than that of the sulfide Ni–Mo/Al2O3 catalyst.8 They used ZnO species as the catalyst supporter and found that the ZnO particles could adsorb the H2S which released from NiS by hydrogen. After that, Babich and Moulijin presented a RADS mechanism.9 They discovered that nickel selected and reacted with sulfur atom under hydrogen to form NiS, which consequently reacted with neighbouring ZnO to form ZnS and regenerated nickel.
The mechanism and operating conditions of RADS over Ni/ZnO-based adsorbent has been attracted more attention in recent studies.10–17 Bezverkhyy et al. studied the kinetics of thiophene reactive adsorption on Ni/ZnO.18,19 Their results indicated that the reaction between Ni/ZnO and thiophene consists of three steps. The first step is a rapid surface reaction between thiophene and the surface Ni atom to form Ni3S2. The next step is sulfur species reacting preferably with ZnO. The third step is thiophene molecules reacting with bulk Ni atoms, meanwhile H2S diffuses through ZnS layer to react with bulk ZnO. Zhang et al.20 reported the effect of ZnO particle size on the adsorptive desulfurization performance for Ni/ZnO adsorbent.20 The desulfurization activity and sulfur capacity of Ni/ZnO adsorbent with smaller ZnO particle sizes are much higher than that with larger sizes.
Normally, hydrogen pretreatment has been taken to reduce the NiO/ZnO-based sorbent to Ni/ZnO-based sorbent before the desulfurization process. Many studies confirmed that reduced Ni is the main active component interacting with sulfur at-om.21,22 However, there are few reports investigating the effect of hydrogen pretreatment on the RADS adsorbent, nor whether NiO could be the main active component for desulfurization. Bezverkhyy et al. compared the desulfurization performance of reduced Ni/ZnO adsorbent and unreduced NiO/ZnO.19 They found that NiO/ZnO adsorbents can be used in the reactive ad-sorption of thiophene without any reductive pretreatment. Moreover, the reduction of NiO/ZnO resulted in the formation of Ni–Zn alloyed particles and led to a decrease of the sulfidation rate in comparison with the unreduced sample. In our previous works the effects of dispersion of Ni species and acidity of adsorbent surface on the desulfurization of NiO/ZnO–Al2O3–SiO2 sorbents were discussed.23,24 It was noticed that hydrogen pre-treatment had little effect on desulfurization. In this work, reduced and unreduced NiO/ZnO–Al2O3–SiO2 adsorbents have been prepared to verify whether hydrogen pretreatment contributes to the desulfurization process. At last, some change of the RADS mechanism on NiO/ZnO–Al2O3–SiO2 adsorbent is discussed.
Experimental section
Adsorbent preparation and feedstock properties
All chemicals used for preparation of the adsorbent were of analytical grade. The feedstock employed in the work was supp-lied by Petrochina Jilin Petrochemical Company, and its properties are listed in Table 1.| Density (20 °C) g cm−3 | Sulfur content μg g−1 | Nitrogen content μg g−1 |
|---|---|---|
| 0.723 | 243.48 | 28.22 |
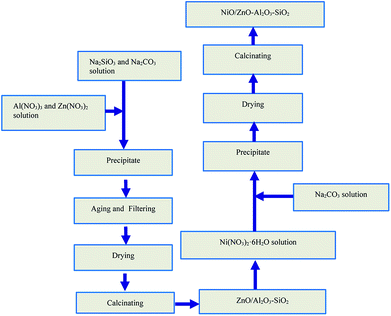
The supporter ZnO–Al2O3–SiO2 of adsorbent was prepared by coprecipitation method, and then Ni component was loaded on the supporter by impregnation method, shown in Fig. 1. A mixed aqueous solution of Al(NO3)3 and Zn(NO3)2 was dropwise added into a mixed solution of Na2CO3(0.2 mol L−1) and Na2SiO3(0.2 mol L−1) at a rate of 15 mL min−1 at a precipitation temperature of 20 °C, followed by aging at the same temperature for 2 h. Then, the precipitation was filtrated out and washed with a large quantity of deionized water to remove the residue sodium until the pH of the suspension is below 6.5.25–28 After that, the filter cake was dried at 120 °C in air for 12 h, and then calcinated at 500 °C in a muffle furnace in dry air for 4 h. The supporter ZnO–Al2O3–SiO2 was obtained.
Solutions with Ni(NO3)2 were mixed with the above supporter and stirred for 2 h. After that, a solution of Na2CO3(0.2 mol L−1) was added dropwise into the mixed solution. The precipitation is the precursor of the sorbent. Large amount of deionized water was used to wash away the residue sodium until the pH of the solution is below 6.5. The obtained filter cake was dried at 120 °C in a vacuum oven for 12 h, and then calcinated at 500 °C in a muffle furnace for 2 h. Finally, the adsorbent was screened to 120 mesh and kept in a sealed bag before usage.
Desulfurization experiments
The desulfurization experiments were conducted in a continuo-us micro fixed-bed reactor.23,24 A total of 3 grams of adsorbent in the oxidized form was loaded into the reactor per run. Before the reaction, the oxidized form sorbent was reduced by hydrogen at a flow rate of 140 mL min−1 under 2.0 MPa and 440 °C for 2 h. Then the FCC gasoline was pumped into the reactor. The desulfurization products were collected periodically in a beaker to analyze sulfur content. After desulfurization, an oxide gas containing 2% O2 diluted by 98% N2 was used to regenerate adsorbents and the tail gas was collected by a 0.1 mol L−1 NaOH solution each hour. The experimental conditions are listed in Table 2.| Reduction | Temp./°C | 440 |
| Hydrogen pressure/MPa | 2.0 | |
| Reduction time/h | 2 | |
| Adsorption, desulfurization | Temp./°C | 419 |
| Hydrogen pressure/MPa | 2.9 | |
| Weight hourly space velocity (MHSV)/h−1 | 10.84 | |
| Mole ratio (H2/oil) | 0.3 | |
| H2 volume/gasoline weight (mL g−1) | 90 | |
| Purge | Temp./°C | 360 |
| H2 flow (mL min−1) | 200 | |
| Purge time/min | 20 | |
| Regeneration | Temp./°C | 360![[thin space (1/6-em)]](https://www.rsc.org/images/entities/char_2009.gif) 480 480 |
| Regeneration time/min | 30 60 | |
| Total pressure/MPa | 0.15 | |
| Oxygen pressure/KPa | 3.0 | |
| Flow (mL min−1) | 200 |
The sulfur removal efficiency of adsorbent is defined according to the following equation:29
 | (1) |
The breakthrough sulfur capacity is determined as follows.
 | (2) |
Characterization of adsorbents
The sulfur concentrations of various samples are analyzed by an Antek 9000 total sulfur analyzer.The crystalline structures of the adsorbents were character-ized through X-ray diffraction (XRD) by using a Bruker D8 Advance X-ray diffractometer with a Cu Kα = 0.154 nm monochromatized radiation source, operating at 40 kV and 100 mA.
The crystal lattice of the adsorbents was surveyed by JEM-2100 transmission electron microscope (TEM).
The dispersity and reducibility of Nickel were undertaken by using the H2/O2 pulse titration (HOPT) with a chemisorption analyzer Autochem II 2920(Micromeritics, USA).
Temperature programmed reduction (TPR) was surveyed by the analyzer Autochem II 2920(Micromeritics, USA).
X-ray photoelectron spectroscopy (XPS) was characterized by the multi-function photoelectron spectrometer (ESCALAB 250Xi).
Results and discussion
XRD results
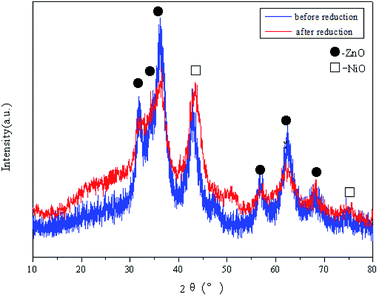
To compare the changes in the lattice before and after reduction, the XRD patterns of adsorbents are shown in Fig. 2. The XRD pattern appears distinguishable characteristic diffract-ion peaks. These peaks are attributed to the crystalline phases of ZnO (2θ = 31.5°, 34.4°, 36.2°, 56.5°, 63°, 68°) and NiO (2θ = 43.3°, 75°). The crystalline phases of Al2O3 and SiO2 cannot be detected.After reduction, the height of peaks of ZnO (2θ = 36.2°, 63°) decrease and peak width broaden. However, the characteristic diffraction peak of NiO (2θ = 43.3°) become sharp and strong, which means hydrogen reduction affects the lattice of the NiO and ZnO. Hydrogen reduction makes the crystal of NiO become bigger and promotes the dispersion of Zn. The purpose of hydrogen pretreatment is to obtain reduced Ni0 before the desulfurization process. However, the reduced Ni0 cannot be detected by XRD, which means that the Ni component is difficult to be reduced in the form of NiO under 440 °C.
TPR results
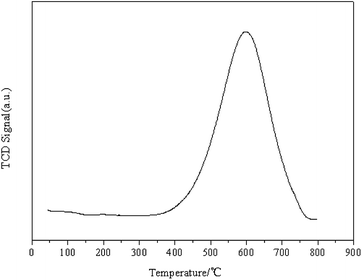
The H2-TPR method is used to evaluate the reducibility of NiO/ZnO–Al2O3–SiO2 adsorbents, shown in Fig. 3. The adsorbent only shows one hydrogen consumption peak, and this peak is attributed to the reduction of NiO. The characteristic peak loc-ates at 598 °C, however, the reduction temperature is around 440 °C during the RADS process, which is far away from 598 °C.Shamskar et al. studied the reduction ability of NiO–Al2O3 catalyst.30 They prepared some NiO–Al2O3 catalysts with different calcination temperature (600–900 °C), and they found the reduction temperature increased with the calcination temperature increasing. The reduction temperature of NiO–Al2O3 catalyst under 600 °C calcination temperature is over 700 °C. This result is consistent with NiO/ZnO–Al2O3–SiO2 adsorbents, whose calcination temperature is 500 °C and reduction temperature is about 600 °C. According to Tang's research, the strong metal-support interactions (SMSI) between Ni and ZnO particles of Ni/ZnO could increase the reduction temperature of NiO in NiO/ZnO to 370 °C, indicating that there exists a strong interaction between NiO and the supporter making NiO much harder to be reduced.31
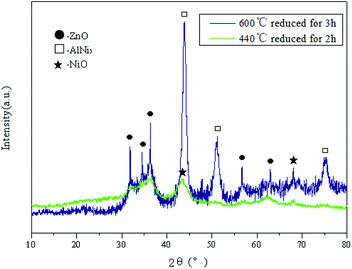
Fig. 4 shows the XRD patterns of adsorbents reduced in H2 for 3 h at 440 °C and 600 °C, respectively. There are two distinguished characteristic diffraction peaks at 2θ = 43.9° and 51.7°, attributed to AlNi3. The ZnO peaks of the adsorbent reduced at 600 °C become sharper and stronger than those of the adsorbent reduced at 440 °C. Under high reduction temperature, the crystal of ZnO grows bigger, but NiO is still not reduced to Ni0. Fig. 4 shows that NiO reacts with Al2O3 to form Ni–Al alloy. In NiO/ZnO adsorbents, hydrogen pretreatment leads to form the Ni–Zn allo-y, while, Ni–Zn alloy cannot be detected in NiO/ZnO–Al2O3–SiO2 adsorbent by XRD.19 Combined with H2-TPR results, it can be concluded that hydrogen reduces NiO and Al2O3 to form the Ni–Al alloy at 600 °C. The interactions between active component Ni and the supporter are strong. The existence of Al2O3 and ZnO supporter increases the reduction temperature of NiO.
Surface area and pore size distribution
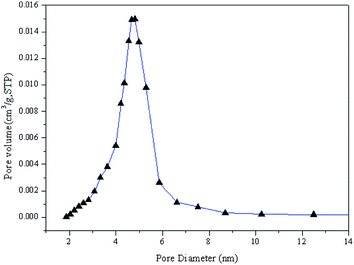
According to the principle of the adsorbents, the adsorption capacity depends on its specific surface area and pore size. The small pore sizes might limit the adsorption of the large sulfur molecular into the adsorbent pores. Fig. 5 shows the pore size distribution of the sorbent. Table 3 shows the specific surf-ace areas, pore volume and pore diameter of the adsorbent. It can be seen the pore size diameter ranges from 2.5 to 5.5 nm. These large pores are formed because of the sintering of relatively small pores under high calcination temperatures.24| SBET (m2 g−1) | Vtotal (cm3 g−1) | DA (nm) |
|---|---|---|
| 149.01 | 0.33 | 5.90 |
Table 3 presents that the specific surface area is about 149 m2 g−1, and pore diameter is about 5.90 nm. It means the sorbents have a big specific surface area, and the pore diameter distribution is large enough for the adsorption of sulfur components, even refractory sulfur compounds like benzothiophene (BT).
Dispersion of Ni component
To detect Ni dispersion, the hydrogen and oxygen pulse titration method is used. Table 4 shows the bulk metal dispersion (D), specific surface area (SANi) and metal crystal size (MCS) of Ni component in fresh sorbents. It can be seen that Ni component in adsorbent is difficult to be reduced after hydrogen and oxy-gen pulse titration, and the bulk metal dispersity is only about 0.02%. Based on the above data, the Ni element on the sorbent surface mostly exists in the form of NiO.| Sample | D (%) | SANi (m2 g−1) | MCS (nm) |
|---|---|---|---|
| Adsorbent | 0.0236 | 0.1568 | 3582.4852 |
XPS results
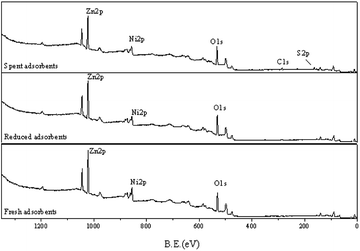
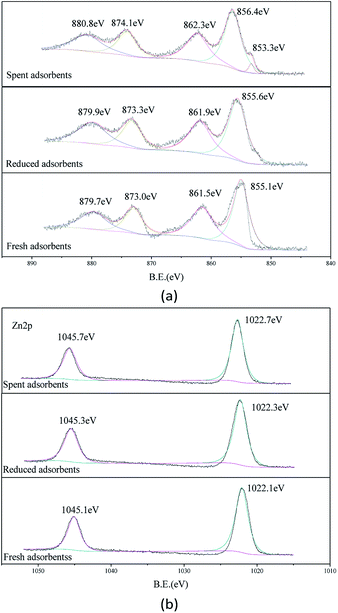
XPS spectra is used to characterize fresh, reduced and spent adsorbents, shown in Fig. 6. All XPS spectra were calibrated us-ing the C 1s peak at 285.4 eV. From Fig. 6, Zn, Ni and S elements are at 2p energy level. After the desulfurization, S and C elements can be detected on the adsorbent surface. It indicates that S elements are adsorbed and carbon deposits are formed on the surface of the adsorbents.XPS spectra of Ni and Zn are presented in Fig. 7. Normally, Ni XPS spectra of Ni-bearing compounds consist of a main photo-peak and an associated satellite peak located at 6 to 8 eV higher binding energy than the main peak. Fig. 7(a) presents Ni 2p3/2 photo-peaks of the Ni compounds. In the figure, the Ni 2p3/2 spectrum 852.5 (±0.2) eV of Ni metal was not observed for the three adsorbents.32 This indicates that NiO cannot be reduced by hydrogen pretreatment. Peaks of 855.1 eV and 861.5 eV of the fresh adsorbents are attributed to the main peak and the satellite peak of the Ni 2p3/2 spectra of NiO, respectively. The peaks centered at bind energy of 873.0 eV and 879.7 eV are attributed to Ni 2p1/2 spectra of NiO.33 In the XPS spectra of the spent adsorbent, a peak at bind energy 853.3 eV appears after desulfurization. This is the main peak of Ni 2p3/2 in NiS. Besides, small increments of binding energy of Ni 2p3/2 photo-peaks were observed for the reduced adsorbent and the spent adsorbent. This suggests that the chemical interaction between NiO and the support ZnO–Al2O3–SiO2 is enhanced.
Fig. 7(b) shows the Zn 2p spectra of various adsorbents. The peak centered at bind energy of 1022.1 eV in fresh adsorb-ent is assigned to Zn 2p3/2, and the peak at bind energy of 1045.25 eV is attributed to Zn 2p1/2. After desulfurization, the bind energy of Zn 2p increases a little, indicating that sulfur atom reacts with ZnO to form ZnS. Furthermore, for S 2p spectra (Fig. 6), the peak at 162.4 eV is attributed to ZnS group, also indic-ating sulfur atom transfers to ZnS from ZnO.
TEM results
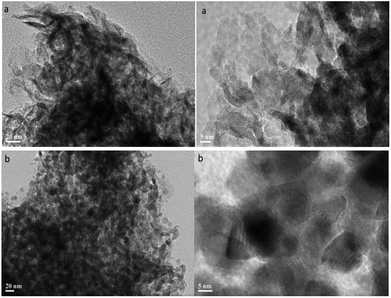
Fig. 8 illustrates the TEM photos of fresh and reduced adsorbents. For the fresh adsorbent, the spots in a diameter range close to 4 nm are NiO components, which are evenly dispersed on the supporter surface. The crystal lattice of adsorbent distributes in the shape of stripe, which may be caused by the preparation method. The striped crystal lattice may be formed by the supporter Al2O3 and SiO2. From the Fig. 8(b), after reduction process at 600 °C reduction temperature, the diameters of the black spots increase to 14 nm and the stripes become more visible and darker. Under high reduction temperature, it would lead to a certain degree of sintering of the adsorbent. Due to the strong interactions between NiO and the support, the NiO components are agglomerated to some extent and the alloy Al–Ni are formed. These stripes include the crystalline phases of AlNi3, SiO2, ZnO and NiO. Compared with the fresh sorbent, the phases have been crystallized again. Distinction between these grains is more obvious.Effect of hydrogen pretreatment on desulfurization
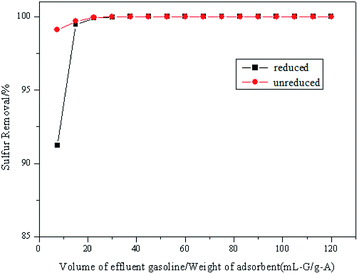
Fig. 9 shows the different desulfurization performance of the reduced and unreduced adsorbents. The sulfur content of the FCC gasoline feed is 243.48 μg g−1. It is interesting to see that the desulfurization capacity of unreduced sorbent is higher than that of the reduced sorbent at the beginning of desulf-urization process. The reduced sorbent does not give a better desulfurization performance at the starting point. The formation of Ni–Al or Ni–Zn alloy, after hydrogen pretreatment, is perhaps the main reason behind this phenomenon.19 After the point of 20 mL-G, the reduced and unreduced sorbents all show good desulfurization performance and keep a high desulfurization level. This indicates that hydrogen pretreatment decreases the activity of desulfurization of the sorbent and leads the active component NiO agglomerated, even to form Ni–Al alloy. With the desulfurization capacity increasing, the alloy will be separated to active NiO and ZnO components, and then the sorbents achieve high desulfurization capacity.19The above analysis demonstrates that NiO is hard to be reduced to Ni0 by hydrogen pretreatment. Also, NiO/ZnO–Al2O3–SiO2 adsorbent without hydrogen pretreatment performs a better desulfurization than the adsorbent after hydrogen pretreatment. It means hydrogen pretreatment is not necessary for RADS process. NiO and Ni0 show a good synergistic desulfurization ability as the active components in the desulfurization process. Apparently, the mechanism of desulfurization on NiO is different from that on Ni. The mechanism of desulfurization on NiO/ZnO–Al2O3–SiO2 adsorbent needs to be further discussed.
Mechanism of desulfurization on NiO/ZnO–Al2O3–SiO2 adsorbent
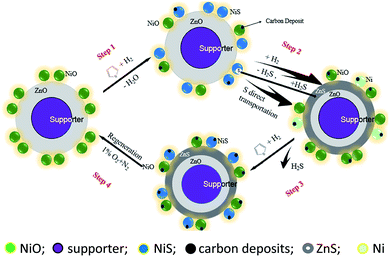
According to the reports of Babich et al. and Huang et al., the reactive mechanism of desulfurization on Ni/ZnO adsorbent can be concluded as follows: Firstly, thiophene can be adsorbed onto the reduced Ni sites, then the C–S bond ruptures to form Ni3S2 and C4 olefins, which is released back into the stream. After that, the sulfur is transferred from Ni3S2 to H2S in the presence of hydrogen, then H2S is accepted by ZnO to form ZnS. Finally, the Ni sites can participate in the adsorption of sulfur atoms again.9,34Based on the above mechanism, reduced Ni is considered as the main active component, but it probably ignores the fact that NiO could directly react with thiophene compound. On the basis of the testing results in this work, a small change of the RADS mechanism is proposed and shown in Fig. 10. In this mechanism, firstly, the sulfur atoms from thiophene molecules is attached to the surface NiO molecules through a reaction which leads to the formation of NiS. This new reaction is proved by the H2-TPR results and the desulfurization performance shown in Fig. 9. The next step will form Ni0 in that a certain proportion of NiS could be reduced. Besides, a direct transportation of sulfur from NiS to ZnO probably happened, which directly form NiO and ZnS. The conversion of ZnO to ZnS is progress-ed by both the latter reaction and the immobilization of H2S releas-ed by the reduction of NiS. After that, with the existence of metallic nickel, along with nickel oxide, further feed of thiophene is treated not only in the way described in step 1 but also through the reaction of Ni0.
Theoretically, desulfurization will continue till all ZnO species contained in adsorbents have been converted to ZnS. If the actual situation is taken into account, it should not be ignored that carbon deposits accumulate on the surface as the reaction goes on, which may strongly prevent the progressing of the significant step 2. After being placed in the mixed gas of 1% oxygen and 99% nitrogen at a certain temperature for a few hours listed in Table 2, carbon deposits on used adsorbents can be burned out.23 Usually those regenerated sorbents can serve as relatively fresh adsorbents to participate in desulfurization continuously.
Conclusions
The effect of hydrogen pretreatment for NiO/ZnO–Al2O3–SiO2 adsorbent is discussed in this work. XRD results showed that NiO is difficult to be reduced to Ni0 after hydrogen pretreatment at 440 °C reduction temperature. Combined with TPR results, high sintering temperature of the prepared adsorbent increases the reduction tempe-rature of NiO. The desulfurization performance showed that NiO/ZnO–Al2O3–SiO2 adsorbent without hydrogen pretreatment performed a better desulfurization than the adsorbent after hydrogen pretreatment at the beginning of desulfurization process. On the basis of the testing and RADS results, we assumed that NiO and metallic Ni could perform as the main active components together. Some change of the Babichet's RADS mechanism was proposed. First, the sulfur atoms from thiophene molecules could be attached to the surface NiO molecules to form NiS. Second, a direct transportation of sulfur from NiS to ZnO probably happened, which directly forms NiO and ZnS.Conflicts of interest
There are no conflicts to declare.Acknowledgements
The support from the Fundamental Research Funds for the Central Universities of China is gratefully acknowledged.Notes and references
- J. H. Kim, X. Ma, A. Zhou and C. Song, Catal. Today, 2006, 111, 74–83 CrossRef CAS
.
- H. J. Jeon, H. K. Chang, S. H. Kim and J. N. Kim, Energy Fuels, 2009, 23, 2537–2543 CrossRef CAS
.
- J. Xiao, Z. Li, B. Liu, Q. Xia and M. Yu, Energy Fuels, 2008, 22, 3858–3863 CrossRef CAS
.
- G. P. Khare, US Pat., 6 531 053, 2003
.
- G. P. Khare, US Pat., 6 184 176, 2001
.
- U. T. Turaga and J. J. Gislason, US Pat., 7 201 839, 2007
.
- S. Brunet, D. Mey, G. Pérot, C. Bouchy and F. Diehl, Appl. Catal., A, 2005, 278, 143–172 CrossRef CAS
.
- K. Tawara, T. Nishimura, H. Iwanami and T. Hasuike, J. Energy Chem., 2001, 40, 2367–2370 CAS
.
- I. V. Babich and J. A. Moulijn, Fuel, 2003, 82, 607–631 CrossRef CAS
.
- W. Xu, C. Xiong, G. Zhou and H. Zhou, Acta Pet. Sin., 2008, 24, 739–743 CAS
.
- T. Wang, X. Wang, Y. Gao, Y. Su, Z. Miao, C. Wang, L. Lu, L. Chou and X. Gao, J. Energy Chem., 2015, 24, 503–511 CrossRef
.
- J. Fan, W. Gang, S. Yu, C. Xu, H. Zhou, G. Zhou and J. Gao, Ind. Eng. Chem. Res., 2010, 49, 8450–8460 CrossRef CAS
.
- H. Li, L. Dong, L. Zhao and C. Xu, Ind. Eng. Chem. Res., 2017, 56, 3813–3821 CrossRef CAS
.
- M. T. Timko, J. A. Wang, J. Burgess, P. Kracke, L. Gonzalez, C. Jayee and D. A. Fischere, Fuel, 2016, 163, 223–231 CrossRef CAS
.
- W. Wang, X. Li, Y. Zhang and M. Tang, Catal. Sci. Technol., 2017, 7, 4413–4421 RSC
.
- R. Ullah, P. Bai, P. Wu, Z. Zhang and Z. Zhong, Energy Fuels, 2016, 30, 2874–2881 CrossRef CAS
.
- M. Moradi, R. Karimzadeh and E. S. Moosavi, Fuel, 2018, 217, 467–477 CrossRef CAS
.
- I. Bezverkhyy, O. V. Safonova, P. Afanasiev and J. P. Bellat, J. Phys. Chem. C, 2009, 113, 17064–17069 CrossRef CAS
.
- A. Ryzhikov, I. Bezverkhyy and J. P. Bellat, Appl. Catal., B, 2008, 84, 766–772 CrossRef CAS
.
- Y. Zhang, Y. Yang, H. Han, M. Yang, L. Wang, Y. Zhang, Z. Jiang and C. Li, Appl. Catal., B, 2012, 21, 13–19 CrossRef
.
- A. Ochoa, B. Aramburu, B. Valle, D. Resasco, J. Bilbao, A. Gayubo and P. Castaño, Green Chem., 2017, 19, 4315–4333 RSC
.
- J. Tapia, N. Acelas, D. López and A. Moreno, Univ. Sci., 2017, 22, 71–85 CrossRef
.
- F. Ju, C. Liu, C. Meng, S. Gao and H. Ling, Energy Fuels, 2015, 29, 6057–6067 CrossRef CAS
.
- F. Ju, C. Liu, K. Li, C. Meng, S. Gao and H. Ling, Energy Fuels, 2016, 30, 6688–6697 CrossRef
.
- H. Kim, K. Jun, S. Kim, H. Potdar and Y. Yoon, Energy Fuels, 2006, 20, 2170–2173 CrossRef CAS
.
- K. Jun, W. Shen, R. Rama and K. Lee, Appl. Catal., A, 1998, 174, 231–238 CrossRef CAS
.
- X. An, B. Wu, W. Hou, H. Wan, Z. Tao and T. Li, J. Mol. Catal. A: Chem., 2007, 263, 266–272 CrossRef CAS
.
- A. A. Mirzaei, H. R. Shaterian, R. W. Joyner, M. Stockenhuber, S. H. Taylor and G. J. Hutchings, Catal. Commun., 2003, 4, 17–20 CrossRef CAS
.
- P. Magnoux, P. Cartraud, S. Mignard and M. Guisnet, J. Catal., 1987, 106, 235–241 CrossRef CAS
.
- S. F. Rahbar, F. Meshkani and M. Rezaei, Ultrason. Sonochem., 2017, 34, 436–447 CrossRef PubMed
.
- J. D. Seader and E. J. Henley, Separation Process Principles, New York, Wiley, 1998 Search PubMed
.
- G. Ertl, R. Hierl, H. Knözinger, N. Thiele and H. P. Urbach, Appl. Surf. Sci., 1980, 5, 49–64 CrossRef CAS
.
- H. W. Nesbitt, D. Legrand and G. M. Bancroft, Phys. Chem. Miner., 2000, 27, 357–366 CrossRef CAS
.
- L. C. Huang, G. F. Wang, Z. F. Qin, M. X. Du, M. Dong, H. Ge, Z. W. Wu, Y. D. Zhao, C. Y. Ma, T. D. Hu and J. G. Wang, Catal. Commun., 2010, 11, 592–596 CrossRef CAS
.
| This journal is © The Royal Society of Chemistry 2018 |

