 Open Access Article
Synthesis of zeolitic imidazolate framework-8 on polyester fiber for PM2.5 removal
Yongyong Zhang,
Ying Jia and
Li'an Hou *
*
Xi'an High Technology Institute, Xi'an 710025, China. E-mail: houlian09@sina.com
First published on 7th September 2018
Abstract
Zeolitic imidazolate framework-8 (ZIF-8) was introduced on the surface of fibers of a non-woven fabric made of polyethylene terephthalate (PET). The phase structure, morphology, textural properties and chemical structure were studied using X-ray diffraction (XRD), scanning electron microscopy (SEM), nitrogen (N2) adsorption analyzer and Fourier transform infrared spectroscopy (FTIR). The XRD, SEM and FTIR results indicated that ZIF-8 had been successfully coated on the PET fibers. N2 adsorption analyses suggested that addition of ZIF-8 significantly increased the specific surface and micropore volume of composites. The PM2.5 removal experiment showed the filtration efficiency of ZIF-8/PET was twice as high as that of pure PET. Meanwhile, ZIF-8/PET also displayed a low pressure drop and good recycling performance. This research provided a facile method to deposit active ZIF-8 onto polymers with low air resistance, and that ZIF-8/PET was a good candidate as an air filter for PM2.5 removal.
1. Introduction
The World Health Organization (WHO) estimated that total global mortality due to air pollution was 7 million in 2012.1 Particulate matter (PM), especially PM2.5 (particulates with a size of 2.5 μm or less), has become one of the largest contributors to air pollution. Over the last decade, PM has increased in prominence globally and a large volume of epidemiological and toxicological evidence has indicated that adverse health effects in both developing and developed countries can be linked to this increase.2–4 Health effects related to PM include increased acute and chronic respiratory and cardiovascular morbidity, and even mortality in both children and adults.5,6 Besides, PM also has adverse effects on visibility and climate change.7,8 Many researchers have developed air filters for application in air purification.9 For example, Wang et al.10 prepared large scale ultrafine chitosan hybrid nanofibers containing TiO2 and/or Ag nanoparticles using a needleless electrospinning method for air filtration. Jeong et al.11 presented an environmental application demonstration of a Ag nanowire percolation network for a novel, electrical type transparent, reusable, and active PM2.5 air filter. Kim et al.12 reported a surface-modified polymer nanofiber membrane for high-efficiency microdust capturing. As for the use to purify air, low air-resistance should be concerned to meet the enough ventilation rate and low noise. Non-woven fabrics are usually used as the coarse filter to remove suspended particulate matters. Here, a cheap non-woven fabric made of polyethylene terephthalate (PET) was selected.As a subclass of metal–organic frameworks (MOFs), zeolitic imidazolate frameworks (ZIFs) are porous crystals with zeolite-type structures built by metal ions and imidazolate ligands.13 ZIFs possess the unique properties of high crystallinity, large surface area, exceptional chemical and thermal stability and functional tenability. As a result, ZIFs have gained considerable attention for their potential application in gas storage, CO2 capture, separation, sensing, catalysis, drug delivery and water treatment.14–21 Zeolitic imidazolate framework-8 (ZIF-8), with sodalite (SOD) topology constructed from Zn and Hmim is one of the most investigated ZIF materials.22,23 Recently, ZIF-8 had been used for PM2.5 removal experiment.24 The result showed that ZIF-8 possessed excellent PM2.5 capture property. Therefore, immobilization of ZIF-8 on PET will be a promising method to improve filtration performance.
Herein, ZIF-8 crystals were synthesized by mixing 2-methylimidazole with zinc nitrate hexahydrate in methanol solution. ZIF-8/PET was fabricated by growing ZIF-8 on the 3-aminopropyltriethoxysilane-modified PET in one step. X-ray diffraction (XRD), scanning electron microscopy (SEM) and gas sorption instrument as well as Fourier transform infrared (FTIR) spectra were employed for characterizing the structure of ZIF-8 and ZIF-8/PET. Furthermore, the PM2.5 removal property of ZIF-8/PET was also investigated.
2. Experimental
2.1 Materials
Zinc nitrate hexahydrate (>99.0%), 2-methylimidazole (>98.0%) and methanol (>99.5%) were purchased from Sigma Aldrich. 3-Aminopropyltriethoxysilane (APTES, >99%) and sodium formate (>99.0%) were obtained from Aladdin, Shanghai China. PET materials purchased from Beijing SIBAOTE Company (China) with thickness of 5 mm were used as substrate for the deposition of ZIF-8. All chemicals were of analytical grade and used without any purification. Deionized water was used throughout this work.2.2 Synthesis of ZIF-8
Typically, 2.932 g zinc nitrate hexahydrate was first dissolved in 50 mL methanol, which was labeled as solution A. 1.214 g 2-methylimidazole was dissolved in 50 mL methanol, which was labeled as solution B. The solution B was slowly poured into solution A under stirring at room temperature (25 ± 3 °C). The mixture solution was stirred for 10 min at constant speed of 200 rpm. Then the mixture solution was poured into a Teflon-lined stainless steel autoclave and heated to 120 °C in an air oven for 4 h. The final product were washed with methanol for 3 times and then dried in air for subsequent characterization.2.3 Synthesis of ZIF-8 on polyester fibers
First polyester fibers were washed with deionized water and methanol to remove residuals on the surface and dried under an ambient atmosphere. Then fibers were modified with APTES (2 wt% in methanol) at 25 °C for 1 h, leading to APTES layers deposited on the support surface.2.932 g zinc nitrate hexahydrate was first dissolved in 50 mL methanol, which was labeled as solution A. 1.214 g 2-methylimidazole and 0.671 g sodium formate was dissolved in 50 mL methanol, which was labeled as solution B. The solution B was slowly poured into solution A under stirring at room temperature (25 ± 3 °C). The mixture solution was stirred for 10 min at constant speed of 200 rpm. Then the APTES modified fibers were vertically placed in a Teflon-lined stainless steel autoclave which was filled with the mixture solution and heated to 120 °C in an air oven for 4 h. The final product were washed with methanol for 3 times to remove any possible residuals and then dried in air for subsequent characterization.
2.4 Characterization
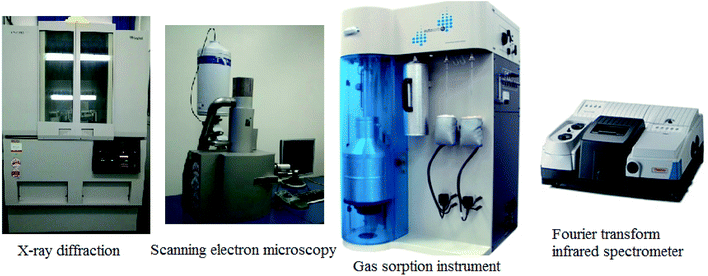
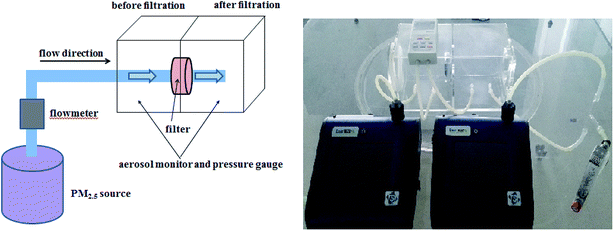
X-ray diffraction (XRD, X'PERT MRD, PANalytic, Holland) was performed using Cu Kα radiation at 40 kV and 50 mA to determine the crystalline. The 2θ scanning range was 5–35°, the step size was 0.008°(2θ) and the scanning speed was 3°(2θ) min−1. Scanning electron microscopy (SEM, TESCAN VEGAII XMUINCN, Czech Republic) in combination with energy dispersive spectrometer (EDS, OXFORD INCA) were used to characterize the morphology and particles size. The accelerating voltage and current of electron beam are 21 keV and 0.2 nA respectively. Each sample was coated with a very thin gold using a sputter coater under certain high-vacuum conditions to achieve conductivity and vacuum durability and then put into the SEM chamber. The surface area and adsorption–desorption isotherm measurements were carried out on a Quantachrome Autosorb-iQ gas sorption instrument at 77 K using liquid nitrogen as coolant. The sample was degassed at 150 °C for 3 h under vacuum before the measurements. The textural properties were determined via nitrogen sorption at −196 °C. Fourier transform infrared (FTIR) spectra in the range 4000–400 cm−1 were obtained on a Thermo Fisher Nicolet 6700 FTIR spectrometer using the KBr wafer technique. Pictures of the characterization setups were shown in Fig. 1 and 2.2.5 PM2.5 removal experiment
The PM2.5 was generated from incense smoke by burning. The inflow concentration was controlled by diluting the smoke by air to a hazardous pollution level equivalent to the PM2.5 mass concentration ∼600 μg m−3. The wind velocity used in the test was 0.2 m s−1 and the relative humidity was 50 ± 5%. PM0.5, PM1.0 and PM2.5 concentration were detected by DustTrak 8530 aerosol monitor (TSI Inc., USA) and the removal efficiency was calculated by comparing the mass concentration before and after filtration. The size distribution of the original PM2.5 source was presented in Table 1. The pressure drop was measured by a pressure gauge (DP1000-IIIC, Shanghai, China). Fifty groups of mass concentration data were collected to give the average concentration. The removal efficiency was calculated by the following equation:| Removal efficiency = (1 − c/c0) × 100% | (1) |
| Particle size interval | 0–0.5 μm | 0–1.0 μm | 0–2.5 μm |
| Mass percent (%) | 68.12 | 85.48 | 100 |
3. Results and discussion
3.1 XRD analysis
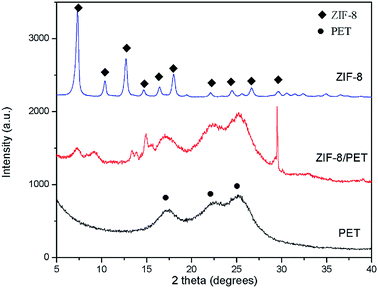
The phase structure of different samples was determined by XRD. The characteristic diffraction peaks at 2θ = 7.4°, 10.4°, 12.7°, 14.7°, 16.4°, 18.0°, 22.1°, 24.5°, 26.7° and 29.6° for ZIF-8 sample were observed clearly in Fig. 3, which can be assigned to (011), (002), (112), (022), (013), (222), (114), (233), (134) and (044) planes respectively. The prominent reflections agreed well with previous reports, confirming the typical sodalite structure of ZIF-8.13,25,26 Three diffraction peaks located around 17.1°, 22.6° and 26.2° for PET sample were observed, which corresponded to (010), (011) and (100) planes of PET, respectively.27 Similar diffraction pattern were shown in ZIF-8/PET sample, revealing that the addition of ZIF-8 did not affect the crystalline form of PET. Furthermore, ZIF-8/PET sample exhibits new peaks at 2θ = 7.4°, 14.7° and 29.6°, which belongs to ZIF-8, suggesting the presence of ZIF-8 on the surface of PET. Owing to the preferred orientation of crystal growth on PET, the relative peak intensity of ZIF-8/PET is different from that of pure ZIF-8, especially the (011) and (044) plane (2θ = 7.4° and 29.6°).28 However, some diffraction peaks positions were slightly shifted towards lower 2θ angles, indicating a slight expansion of ZIF-8 lattice. This phenomenon may be due to ZIF-8 framework distortion caused by the repulsive interactions between PET and imidazole groups in ZIF-8. Absence of some ZIF-8 diffraction peaks (e.g. 12.7°) in ZIF-8/PET sample could be attributed to the affinity interactions between these lattice planes and APTES or PET.3.2 SEM analysis
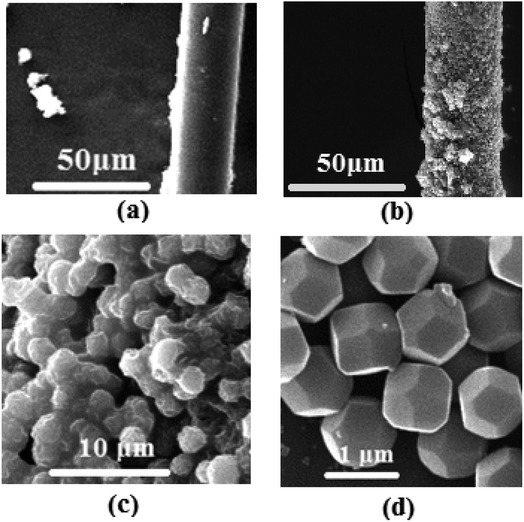
Fig. 4 displayed the morphology of synthesized samples. It can be clearly seen from Fig. 4(a) that the diameter of PET fibers was ∼20 μm and the surface of the raw fibers was smooth with a small amount of impurities. Pure ZIF-8 samples had rhombic dodecahedron morphologies with average particle size of 1 μm (Fig. 4(d)), which matched well the results in literature,29 confirming that the synthesized method was right. Fig. 4(b and c) is the representative SEM images of ZIF-8/PET with different magnifications. As shown in Fig. 4(b), the surface of the composites was rougher than that of the pure PET due to the adhesion of ZIF-8 crystals to the fiber. ZIF-8 particles may strengthen the interaction between PM2.5 and composites by the open metal sites, functional groups and electrostatic interactions.24 Besides, the rough fiber surface may be helpful for the capture of PM2.5. No visible cracks, pinholes or other defects were observed in the surface of ZIF-8/PET, indicating that the contact between ZIF-8 particles and PET was good. These particles had rhombic dodecahedron shape with particle size ranging from 1 μm to 2 μm (Fig. 4(c)).3.3 Textural analysis
In order to determine the presence of ZIF-8 grains in the PET, nitrogen adsorption–desorption isotherms of ZIF-8, PET and ZIF-8/PET were measured. As shown in Fig. 5(a), the nitrogen adsorption–desorption isotherms of synthesized ZIF-8 displayed typically reversible type I isotherms. The adsorbed nitrogen amount of all the samples at low pressures (P/P0 < 0.08) increased steeply, suggesting the existence of micropores. The results were in line with those reported previous.25,30,31 Furthermore, the isotherms of ZIF-8 exhibited hysteresis loop near P/P0 = 1, indicating the presence of interparticle mesoporosity and macroporosity between ZIF-8 particles.32 The main filtration mechanism is the strong adsorption force of various porous structures on the substance rather than a simple sieve effect.33 Indeed, the semi-log plot of nitrogen adsorption isotherms of ZIF-8 showed two steps occurring at 5 × 10⁻² and 5 × 10⁻³ P/P0 (Fig. 5(b)). The first step could be attributed to a reorganization of the nitrogen molecules caused by strong electrostatic interactions with ZIF framework, while the second step to the gas-induced rotation of the imidazolate linkers upon pressure, i.e. to the gate-opening effect.34 The increase in uptake going from the first to the second step was 28.6%, suggesting synthesized ZIF-8 possessed excellent flexibility. The PET and ZIF-8/PET samples also exhibited type I isotherms, which confirmed the presence of micropore structure. Both PET and ZIF-8/PET had relatively little pore structure, then the semi-log plot of nitrogen adsorption isotherms were not discussed here.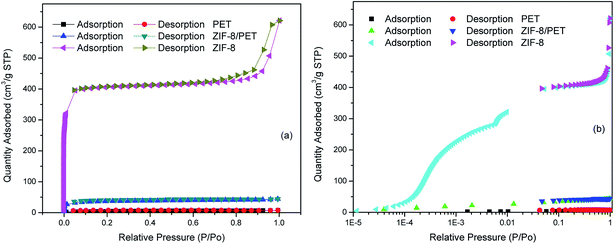 | ||
| Fig. 5 (a) Nitrogen adsorption–desorption isotherms of ZIF-8, PET and ZIF-8/PET, (b) logarithmic-scale plot of nitrogen adsorption. | ||
Table 2 presented the Brunauer–Emmett–Teller (BET) and Langmuir surface area, and micropore volume calculated with t-plot method. The BET, Langmuir surface area and micropore volume increased from 16 m2 g−1, 31 m2 g−1 and 0.0006 cm3 g−1 for pure PET to 116 m2 g−1, 185 m2 g−1 and 0.0394 cm3 g−1 for ZIF-8/PET, respectively. The additions of ZIF-8 to the PET significantly increased the specific surface and micropore volume, which was helpful for the capture of PM2.5.
3.4 FTIR spectroscopy analysis
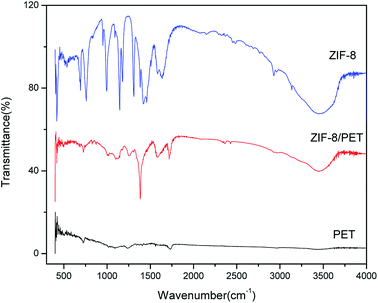
The chemical structure was defined by using FITR and presented in Fig. 6. It presented remarkable bands at 3455, 3135, 2929, 1635, 1585, 1458, 1425, 1385, 1309, 1146, 995, 760, 694 and 426 cm−1 for ZIF-8 sample. These FT-IR bands were consistent with those previously reported by Cravillon et al., Ordonez et al. and Jomekian et al.35–37 The band at 3455 cm−1 might be attributed to the N–H stretching vibration of the residual Hmim and the O–H stretching vibration of water from KBr deliquescence. The peaks at 3135 and 2929 cm−1 were associated with the aromatic and aliphatic C–H asymmetric stretching vibrations, respectively. Another signal around 1635 cm−1 arose from the C![[double bond, length as m-dash]](https://www.rsc.org/images/entities/char_e001.gif) C stretch mode, while band at 1585 cm−1 corresponded to the C
C stretch mode, while band at 1585 cm−1 corresponded to the C![[double bond, length as m-dash]](https://www.rsc.org/images/entities/char_e001.gif) N stretch vibration. The signals at 1300–1460 cm−1 were for the entire ring stretching, whereas band at 1146 cm−1 derived from aromatic C–N stretching mode. Similarly, the peaks at 995 and 760 cm−1 could be assigned as C–N bending vibration and C–H bending mode, respectively. And band at 694 cm−1 was due to the ring out-of-plane bending vibration of the Hmim. Interestingly, the noticeable Zn–N stretching vibration band was observed at the position of 426 cm−1, suggesting that zinc ions combined chemically with nitrogen atoms of the methylimidazole groups to form the imidazolate.38 Compared with the pure PET, the N–H stretching vibration, C
N stretch vibration. The signals at 1300–1460 cm−1 were for the entire ring stretching, whereas band at 1146 cm−1 derived from aromatic C–N stretching mode. Similarly, the peaks at 995 and 760 cm−1 could be assigned as C–N bending vibration and C–H bending mode, respectively. And band at 694 cm−1 was due to the ring out-of-plane bending vibration of the Hmim. Interestingly, the noticeable Zn–N stretching vibration band was observed at the position of 426 cm−1, suggesting that zinc ions combined chemically with nitrogen atoms of the methylimidazole groups to form the imidazolate.38 Compared with the pure PET, the N–H stretching vibration, C![[double bond, length as m-dash]](https://www.rsc.org/images/entities/char_e001.gif) C stretch mode, C
C stretch mode, C![[double bond, length as m-dash]](https://www.rsc.org/images/entities/char_e001.gif) N stretch vibration, entire ring stretching, aromatic C–N stretching mode, C–N bending vibration, C–H bending mode and Zn–N stretching vibration signals appeared in ZIF-8 still could be found in ZIF-8/PET, suggesting the existence of ZIF-8 on the PET. In addition, no new bands appeared in ZIF-8/PET sample. This evidenced that no strong chemical interactions between ZIF-8 particles and PET.
N stretch vibration, entire ring stretching, aromatic C–N stretching mode, C–N bending vibration, C–H bending mode and Zn–N stretching vibration signals appeared in ZIF-8 still could be found in ZIF-8/PET, suggesting the existence of ZIF-8 on the PET. In addition, no new bands appeared in ZIF-8/PET sample. This evidenced that no strong chemical interactions between ZIF-8 particles and PET.
3.5 PM2.5 capture property analysis
The performances of PET and ZIF-8/PET for PM2.5 capture were tested in a flow-through reactor. As shown in Fig. 7 (a), neat PET and ZIF-8/PET achieved PM2.5 removal efficiency of 38.30% and 77.15%, respectively. The additions of ZIF-8 made the composites have better performance for PM2.5 removal than pure PET. In addition to removal efficiency, low air resistance is one of the important properties for filters. Both PET and ZIF-8/PET had a pressure drop of less than 15 Pa. Compared with pure PET, the pressure drop of ZIF-8/PET was higher, which may be attributed to the voids reduction among fiber framework.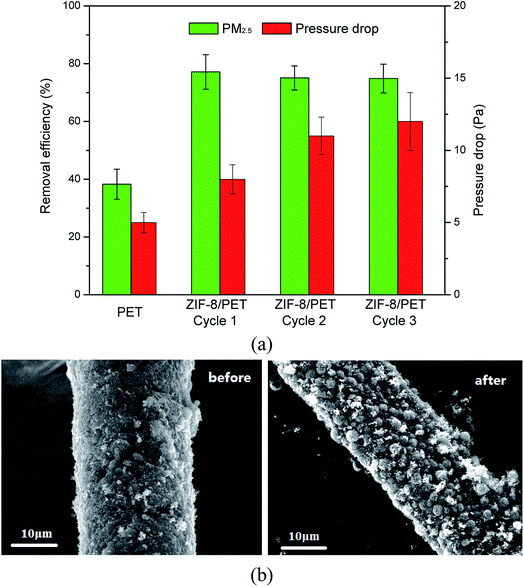 | ||
| Fig. 7 (a) PM2.5 removal efficiencies and the pressure drop of PET and ZIF-8/PET. (b) SEM images of the ZIF-8/PET filter before and after PM2.5 removal. | ||
Moreover, the recycling performance of ZIF-8/PET was also evaluated. ZIF-8/PET was washed in 50% methanol after 1 h PM2.5 capture experiment and then dried in the air. The washed and dried composites were used again to capture PM2.5. It can be seen from Fig. 7(a), the removal efficiency of PM2.5 decreases slightly and remain higher than 74% after three cycles. The pressure drop increases with the increasing of used times and remain lower than 15 Pa. Xiong et al.39 speculated that the residual particles after washed might result in the increase of air resistance, then leading to the increase of pressure drop.
The SEM images of ZIF-8/PET filter before and after PM2.5 removal were exhibited in Fig. 7(b). Tiny particles were captured and attached on the surface of the fibers. The roles of ZIF-8 played in the enhancement of PM2.5 capture property can be concluded as strengthen of adsorption ability. Specifically, the increase of specific surface and micropore volume can provide additional reaction space and adsorption sites. Then, the addition of ZIF-8 enriched the functional groups. Besides, electrostatic interactions between the composites and PM2.5 were another mechanism since ZIF-8 had been reported to exhibit positive surface charges.40,41
4. Conclusion
ZIF-8/PET was successfully synthesized by growing ZIF-8 on the fibers of non-woven fabric made of PET, which was light and cheap. The ZIF-8/PET material had better activity for PM2.5 capture than neat PET. And the additions of ZIF-8 doubled the filtration efficiency. In addition, the prepared composites showed low pressure drop and good recycling performance. ZIF-8/PET was promising for PM2.5 capture due to its unique characters.Conflicts of interest
The authors declare no competing interests.Acknowledgements
This research was supported by Special Research for Public-Beneficial Environment Protection (No. ln201409080) and the Key Consulting Project of Chinese Academy of Engineering (No. 2015-06-XZ-01).References
- World Health Organization, http://www.who.int/phe/health_topics/outdoorair/databases/FINAL_HAP_AAP_BoD_24March2014.pdf?ua=1, 2014.
- W. Huang, J. J. Cao, Y. B. Tao, L. Z. Dai, S. E. Lu and B. Hou, Am. J. Epidemiol., 2012, 175(6), 556–566 CrossRef PubMed
.
- T. D. Nelin, A. M. Joseph, M. W. Gorr and L. E. Wold, Toxicol. Lett., 2012, 208(3), 293–299 CrossRef PubMed
.
- J. Zhou, K. Ito, R. Lall, M. Lippmann and G. Thurston, Environ. Health Perspect., 2011, 119(4), 461–466 CrossRef PubMed
.
- R. D. Brook, S. Rajagopalan, C. A. Pope, J. R. Brook, A. Bhatnagar, A. V. Diez-Roux, F. Holguin, Y. Hong, R. V. Luepker and M. A. Mittleman, Circulation, 2010, 121(21), 2331–2378 CrossRef PubMed
.
- X. Zhang, Z. Zhao, T. Nordquist and D. Norback, Indoor Air, 2011, 21(6), 462–471 CrossRef PubMed
.
- J. G. Watson, J. Air Waste Manage. Assoc., 2002, 52(6), 628–713 CrossRef
.
- V. Ramanathan, P. J. Crutzen, J. Lelieveld, A. P. Mitra, D. Althausen, J. Anderson, M. O. Andreae, W. Cantrell, G. R. Cass, C. E. Chung, A. D. Clarke, J. A. Coakley, W. D. Collins, W. C. Conant, F. Dulac, J. Heintzenberg, A. J. Heymsfield, B. Holben, S. Howell, J. Hudson, A. Jayaraman, J. T. Kiehl, T. N. Krishnamurti, D. Lubin, G. McFarquhar, T. Novakov, J. A. Ogren, I. A. Podgorny, K. Prather, K. Priestley, J. M. Prospero, P. K. Quinn, K. Rajeev, P. Rasch, S. Rupert, R. Sadourny, S. K. Satheesh, G. E. Shaw, P. Sheridan and F. P. J. Valero, J. Geophys. Res., 2001, 106(D22), 28371–28398 CrossRef
.
- C. Wang, S. Wu, M. Jian, J. Xie, L. Xu, X. Yang and Q. Zheng, Nano Res., 2016, 9, 1–8 CrossRef
.
- L. Wang, C. Zhang, F. Gao and G. Pan, RSC Adv., 2016, 6, 105988–105995 RSC
.
- S. Jeong, H. Cho, S. Han, P. Won, H. Lee, S. Hong, J. Yeo, J. Kwon and S. H. Ko, Nano Lett., 2017, 17, 4339–4346 CrossRef PubMed
.
- H. J. Kim, S. J. Park, C. S. Park, T. H. Le, S. H. Lee, T. H. Ha, H. Kim, J. Kim, C. S. Lee, H. Yoon and O. S. Kwon, Chem. Eng. J., 2018, 339, 204–213 CrossRef
.
- K. S. Park, Z. Ni, A. P. Côté, J. Y. Choi, R. Huang, F. J. Uribe-Romo, H. K. Chae, M. O'Keeffe and O. M. Yaghi, Proc. Natl. Acad. Sci. U. S. A., 2006, 103(27), 10186–10191 CrossRef PubMed
.
- Y. B. He, W. Zhou, G. D. Qian and B. L. Chen, Chem. Soc. Rev., 2014, 43(16), 5657–5678 RSC
.
- F. Cacho-Bailo, B. Seoane, C. Teĺlez and J. Coronas, J. Membr. Sci., 2014, 464, 119–126 CrossRef
.
- P. F. Liu, K. Tao, G. C. Li, M. K. Wu, S. R. Zhu, F. Y. Yi, W. N. Zhao and L. Han, Dalton Trans., 2016, 45(32), 12632–12635 RSC
.
- A. Jomekian, B. Bazooyar, R. M. Behbahani, T. Mohammadi and A. Kargari, J. Membr. Sci., 2017, 524, 652–662 CrossRef
.
- J. J. Gassensmith, J. Y. Kim, J. M. Holcroft, O. K. Farha, J. F. Stoddart, J. T. Hupp and N. C. Jeong, J. Am. Chem. Soc., 2014, 136(23), 8277–8282 CrossRef PubMed
.
- L. Zeng, X. Y. Guo, C. He and C. Y. Duan, ACS Catal., 2016, 6(11), 7935–7947 CrossRef
.
- Z. Tian, X. Yao and Y. Zhu, Microporous Mesoporous Mater., 2017, 237, 160–167 CrossRef
.
- J. Dai, X. Xiao, S. Duan, J. Liu, J. He, J. Lei and L. Wang, Chem. Eng. J., 2018, 331, 64–74 CrossRef
.
- T. T. Bui, N. D. Cuong, Y. S. Kim and H. Chun, Mater. Lett., 2018, 212, 69–72 CrossRef
.
- S. Watanabe, S. Ohsaki, T. Hanafusa, K. Takada, H. Tanaka, K. Mae and M. T. Miyahara, Chem. Eng. J., 2017, 313, 724–733 CrossRef
.
- Y. Zhang, S. Yuan, X. Feng, H. Li, J. Zhou and B. Wang, J. Am. Chem. Soc., 2016, 138(18), 5785–5788 CrossRef PubMed
.
- Y. Pan, Y. Liu, G. Zeng, L. Zhao and Z. La, Chem. Commun., 2011, 47(7), 2071–2073 RSC
.
- A. Schejn, L. Balan, V. Falk, L. Aranda, G. Medjahdi and R. Schneider, CrystEngComm, 2014, 16(21), 4493–4500 RSC
.
- J. Font, J. Muntasell and E. Cesari, Mater. Res. Bull., 1999, 34(1), 157–165 CrossRef
.
- R. V. Surendar and A. C. Moises, J. Am. Chem. Soc., 2010, 132(1), 76–78 CrossRef PubMed
.
- O. Kolmykov, J.-M. Commenge, H. Alem, E. Girot, K. Mozet, G. Medjahdi and R. Schneider, Mater. Des., 2017, 122, 31–41 CrossRef
.
- L. S. Lai, Y. F. Yeong, N. C. Ani, K. K. Lau and A. M. Shariff, Part. Sci. Technol., 2014, 32(5), 520–528 CrossRef
.
- M. He, J. Yao, Q. Liu, K. Wang, F. Chen and H. Wang, Microporous Mesoporous Mater., 2014, 184, 55–60 CrossRef
.
- D. Liu, Y. Wu, Q. Xia, Z. Li and H. Xi, Adsorption, 2013, 19(1), 25–37 CrossRef
.
- Y. C. Du, J. Z. Sun, S. H. Zhang, R. Q. Hou and H. J. Li, Non-Met. Mines, 2016, 39(5), 34–37 Search PubMed
.
- J. D. Fairen, S. A. Moggach, M. T. Wharmby, P. A. Wright and S. D. Parsons, J. Am. Chem. Soc., 2011, 133(23), 8900–8902 CrossRef PubMed
.
- C. Janosch, M. Simon, L. Sven-Jare, F. Armin, H. Klaus and W. Michael, Chem. Mater., 2009, 21(8), 1410–1412 CrossRef
.
- M. J. C. Ordonez, K. J. Balkus, J. P. Ferraris and I. H. Musselman, J. Membr. Sci., 2010, 361(1–2), 28–37 CrossRef
.
- A. Jomekian, R. M. Behbahani, T. Mohammadi and A. Kargari, Microporous Mesoporous Mater., 2016, 234, 43–54 CrossRef
.
- Y. Hu, H. Kazemian, S. Rohani, Y. Huang and Y. Song, Chem. Commun., 2011, 47(47), 12694–12696 RSC
.
- Z. C. Xiong, R. L. Yang, Y. J. Zhu, F. F. Chen and L. Y. Dong, J. Mater. Chem. A, 2017, 5(33), 17482–17491 RSC
.
- B. K. Jung, J. W. Jun, Z. Hasan and S. H. Jhung, Chem. Eng. J., 2015, 267, 9–15 CrossRef
.
- K. Y. A. Lin, F. K. Hsu and W. D. Lee, J. Mater. Chem. A, 2015, 3(18), 9480–9490 RSC
.
| This journal is © The Royal Society of Chemistry 2018 |

