 Open Access Article
Bone regeneration in critically sized rat mandible defects through the endochondral pathway using hydroxyapatite-coated 3D-printed Ti6Al4V scaffolds
Yan Wang†
 a,
Xinjie Cai†ab,
Jing Huanga,
Yi Zhouab,
Tao Jiang
 *ab and
Yining Wang
 *ab
*ab
aThe State Key Laboratory Breeding Base of Basic Science of Stomatology (Hubei-MOST), Key Laboratory of Oral Biomedicine Ministry of Education, School and Hospital of Stomatology, Wuhan University, 237 Luoyu Road, Wuhan 430079, China. E-mail: jiangtao2006@whu.edu.cn; wang.yn@whu.edu.cn; Fax: +86 27 87873260; Tel: +86 27 87686318
bDepartment of Prosthodontics, Hospital of Stomatology, Wuhan University, Wuhan, China
First published on 12th September 2018
Abstract
The endochondral approach has been proved to be a promising pathway in bone tissue engineering. However, whether it is suitable for repairing critically sized mandible defects is unknown. We designed Ti6Al4V scaffolds with a suitable shape and pore size by a 3D-printing selective-laser-melting technique to implement this approach. In order to improve the surface bioactivity of the scaffolds, hydroxyapatite (HA) coatings (HA/L group and HA/H group) of different crystallite size were prepared on the scaffolds via electrochemical deposition. Rat bone mesenchymal stem cells (BMSCs) were seeded onto the scaffolds and chondrogenically differentiated in vitro for 4 weeks and then the scaffolds were implanted into critically sized rat mandible defects for 8 weeks. The bare scaffold and HA coatings were characterized with field emission scanning electron microscopy, water contact angle measurements and X-ray diffractometry. Cell proliferation results showed that the bioactivity of the HA coatings could better improve the growth rate of BMSCs compared with the bare surface. Additionally, safranin O staining showed abundant cartilage matrix and chondrocytes in the HA coated scaffold. Analyses using qPCR detected higher expression of chondrogenic-related gene Col2α1 and vegfα in the HA coated groups, especially in the HA/H group. Together these data demonstrate that the HA coating could improve the chondrogenic differentiation of BMSCs. In vivo, methylene blue staining of histological sections and micro-computed tomography revealed that the HA-coated groups, especially the HA/H group, increased new bone formation via endochondral ossification compared with the control group. Therefore, this strategy provides an alternative method to improve bone formation in mandible defects via the endochondral pathway and the scaffold with larger HA crystals was superior to those with smaller HA crystals.
1. Introduction
Oral and maxillofacial critically sized defects (CSDs) caused by congenital abnormalities, trauma or cancer surgery do not self-heal without external intervention. A widely used strategy involves autologous bone graft and allogeneic bone tissue transplantation.1 However, these strategies are usually associated with complications, such as pain and risk of infection, as well as a lack of sources,2 which limited their application in clinics. In contrast to traditional approaches, the field of bone tissue engineering (BTE) focuses on biological substitutes to induce new functional tissues. BTE that addresses the previously described issues in current clinical treatments has attracted the attention of scientists as a promising strategy for bone repair and regeneration.3Mesenchymal stem cells (MSCs) can differentiate into several types of cells, including osteoblasts4 and chondrocytes,5 and therefore, may be an alternative resource for regenerative therapy using BTE.6,7 During the development of the skeletal system, MSCs differentiate to form bone via two different pathways. The first is intramembranous ossification and the second is endochondral ossification.8 In the current field of BTE, using undifferentiated MSCs incorporated into a degradable scaffold as a bone tissue substitute to elicit bone regeneration has attracted wide attention.9 This direct ossification process is analogous to intramembranous ossification. However, the vascular supply and degradation of the tissue-engineered constructs when implanted in vivo have been a challenge in BTE.10–12 In addition, there are few studies that support the effectiveness of this strategy in bone repair of large defects, including CSDs of the mandible.13,14
Endochondral ossification occurs in the development of long bones and fracture healing.8 The chondrocytes can survive with poor nutrition and hypoxia.15 In addition, they secrete vascular endothelial growth factor (VEGF) in the hypertrophic stage, which enable the blood vessel in-growth.16 Several recent studies has achieved vascularized bone formation by subcutaneously implanting chondrogenically differentiated cell pellets.17–20 Our previous study showed regeneration of alveolar bone and ligament tissues via the chondrogenic differentiation approach.21 Although there are a few reports on the long-bone regeneration in CSDs through this pathway,22,23 there are no reports on the regeneration in maxillofacial CSDs via this pathway. In addition, these two types of bones develop via two different pathways. A previous study showed that the best chondrogenic priming time in vitro was 4 weeks,24 and so this time is also applied in our research. In this study, we explored repair of the mandible CSDs via the endochondral ossification pathway.
In this pathway, MSCs were firstly pre-differentiated into chondrocytes in vitro. A crucial process prior to the chondrogenic priming is the initial 3D expansion of the MSCs. Cells grow in a 2D manner in vitro,25 and so a 3D scaffold mimicking bone structure should be used to help the cells grow in a 3D manner. Selective-laser-melting (SLM) can melt metal powders to produce 3D structures layer by layer with high precision.26 It can produce a scaffold with a designed shape and interconnected pores that provide enough space for nutrient diffusion and blood vessel invasion and thus is promising for BTE.27 Ti6Al4V is a widely used material in clinical applications for bone substitution and fixation but insufficient bioactivity limits its application. Therefore, biochemical surface modification has been applied. A hydroxyapatite (HA) coating improves biocompatibility and osteoconductivity of titanium alloy scaffolds and has a similar chemical composition to the native bone mineral.28,29 In this study, we prepared HA coatings onto porous 3D scaffold using electrochemical deposition (ECD), which is widely used to produce HA coating.30–32 ECD is a versatile technique with the advantages of short processing time, and simple production apparatus compared with other methods of preparing HA coatings on porous substrates.33 Here we produced the HA coatings of different crystal size by increasing the concentration of ECD solution to evaluate and compare the effects of HA coatings on the differentiation of MSCs into chondrocytes.
We hypothesised that the 3D scaffolds with HA coatings would increase the cartilage formation and then achieve bone regeneration in mandible CSDs via endochondral ossification.
2. Materials and methods
2.1 Producing of the 3D titanium alloy scaffold
Porous Ti6Al4V scaffolds (porosity: 85 ± 6.2%, ∅: 5 mm, thickness: 1 mm, pores size: 600 ± 35 μm, stiffness: 0.46 ± 0.04 GPa, compressive strength: 6.28 ± 0.83 GPa) were fabricated using a BLT-S300 Metal Additive Manufacturing Machine (Bright Laser Technologies Co., Ltd, China) through SLM techniques. The 3D models were designed with Materialise/Magics™ software (Materialize, Leuven, Belgium), by which a 3D CAD file was designed then converted into a 2D STL file of each layer. Medical-grade Ti6Al4V powder (∅: 35 μm) was preheated to 30 °C. The fine metal powder was fused by high-power laser beam (IPG Photonics, Burbach, Germany) layer by layer repeatedly to build the final structure. The process was performed in argon gas. Disk-shaped samples (∅: 15 mm, thickness: 1 mm) were used in water contact angle test.2.2 Surface modification of porous Ti6Al4V scaffolds
![[thin space (1/6-em)]](https://www.rsc.org/images/entities/char_2009.gif) :
:![[thin space (1/6-em)]](https://www.rsc.org/images/entities/char_2009.gif) 1) at 65 °C for 30 min. After etching, the specimens were ultrasonically cleaned with acetone, ethanol, and distilled water for 15 min per treatment and then rinsed with ultrapure water.
1) at 65 °C for 30 min. After etching, the specimens were ultrasonically cleaned with acetone, ethanol, and distilled water for 15 min per treatment and then rinsed with ultrapure water.2.3 Characterization of titanium meshes and coatings
The microstructure of the scaffold and the HA coatings were visualized by field-emission scanning electron microscopy (FE-SEM, Zeiss, Germany). The specimens were coated with an ultra-thin layer of gold by sputtering to increase surface conductivity.The water contact angle was determined using a contact angle meter (SL200KS, KINO Industry Co., Ltd., USA). Briefly, water droplets of about 10 μl were dropped onto the surface of each disc-shaped samples at a flow rate of 0.25 μl s−1. Each sample was tested for three times. The shapes of the water droplet were captured and measured using drop shape analysis system CAST®3.0 (Cast, Toronto, Canada) (n = 3).
The powder of the HA coatings was collected and the crystalline state of the composition was measured using an X-ray diffractometer (Panalytical X'Pert Pro, Holland) at a voltage of 40 kV and a current of 30 mA with Cu Kα radiation. The diffraction angle ranged from 10° to 80° in the 2θ angle. The data was analysed by the jade 6.0 software and refers to Joint Committee on Powder Diffraction Standards (JCPDS) card number 09-0432.
2.4 Isolation and culture of cells
The MSCs were derived from 4 week-old male SD rats after approval from the School and Hospital of Stomatology, Wuhan University Animal Ethics Committee (approval number: 00140830). Briefly, both femora were dissected, the ends of the bones were cut-off and the bone marrow was flushed out using the basic cell culture medium (α-MEM supplemented with 10% foetal bovine serum) through a 10 ml needle. The flush-out from four rats was collected and cultured in α-MEM medium for 24 h in a humidified incubator (37 °C, 5% CO2), after which the medium was refreshed. Cells expanded for two passages were used for cell seeding. In order to ensure a high cell-loading efficiency, MSCs were seeded onto the 3D scaffolds by gently dropping 20 μl of the cell suspension containing 2 × 10⁶ cells into none treated 24-well culture plates. Cells were cultured for 30 min and then the proliferation medium (α-MEM medium supplemented with 10% foetal bovine serum, 100 U ml−1 penicillin, 100 μg ml−1 streptomycin, 50 μg ml−1 L-ascorbic acid and 10 nM dexamet hasone) was gently added (1 ml per well). The cell-seeded scaffolds were cultured in proliferation medium for 7 days. Thereafter, the medium was replaced with chondrogenic medium (RASMX-90041, Cyagen Biosciences, Santa Clara, CA, USA), which was refreshed twice a week and cells were cultured for another four weeks. All animal procedures were approved by the School and Hospital of Stomatology, Wuhan University Animal Ethics Committee (approval number: 00140830), and relevant guidelines and regulations were applied.2.5 In vitro tests
The MSCs were seeded onto the 3D scaffolds at a density of 2 × 10⁴ cells per scaffold in none treated 24-well culture plates. After incubation for 36 h, samples were fixed in 4% paraformaldehyde (PFA) in phosphate buffer saline (PBS) for 15 min and then permeabilized with 0.1% Triton-X 100 in 1× PBS for 5 min. Subsequently, the samples were rinsed with PBS for three times and then stained with rhodamine–phalloidin (RP (1![[thin space (1/6-em)]](https://www.rsc.org/images/entities/char_2009.gif) :
:![[thin space (1/6-em)]](https://www.rsc.org/images/entities/char_2009.gif) 200; Cytoskeleton, Inc. Germany)), at room temperature (RT) for 30 min. The nuclei were counterstained with 4′,6 diamidino-2-phenylindole (DAPI, Invitrogen, Basel, Switzerland). Images were captured using a fluorescence microscopy (Leica dm4000b, Germany) equipped with a digital camera (Olympus dp71, Japan).
200; Cytoskeleton, Inc. Germany)), at room temperature (RT) for 30 min. The nuclei were counterstained with 4′,6 diamidino-2-phenylindole (DAPI, Invitrogen, Basel, Switzerland). Images were captured using a fluorescence microscopy (Leica dm4000b, Germany) equipped with a digital camera (Olympus dp71, Japan).
| Primers | Forward (5′ → 3′) | Reverse (5′ → 3′) |
|---|---|---|
| β-Actin | GCAGGAGTACGATGAGTCCG | ACGCAGCTCAGTAACAGTCC |
| Sox9 | TCCCCGCAACAGATCTCCTA | AGCTGTGTGTAGACGGGTTG |
| Col2α1 | GACGCCACGCTCAAGTCGCT | CGCTGGGTTGGGGTAGACGC |
| Col10α1 | GGGCCCTATTGGACCACCAGG | CCGGCATGCCTGTTACCCCC |
| Vegfα | ACTCATCAGCCAGGGAGTCT | GGGAGTGAAGGAGCAACCTC |
2.6 In vivo implantation
The cell-scaffold structures and the bare scaffolds as a control were implanted into the mandible CSDs in 10 week-old male SD rats (n = 6). The rats were first anesthetized with 2% pentobarbital sodium (0.3 ml/100 g) via intraperitoneal injection. The hair on the lower faces of the rats was depilated and sterilized with povidone–iodine. Under aseptic conditions, an incision was made through the masseter muscle. A full thickness circular CSD (∅: 5 mm) was created with a core drill with intermittent rinses of PBS. The cell-scaffolds and the bare scaffolds were implanted directly into the prepared defects. The skin and muscle incisions were sutured and sterilized. To avoid wound infection, each animal was given an intramuscular injection of 20![[thin space (1/6-em)]](https://www.rsc.org/images/entities/char_2009.gif) 000 U of penicillin per day for 3 days after the operation.
000 U of penicillin per day for 3 days after the operation.
2.7 Micro-computed tomography (μCT) imaging
Eight weeks after implantation, rats (n = 5) were sacrificed under anesthesia by intravenous injection with pentobarbital. The mandibular bone samples were harvested and fixed immediately in 4% PFA in PBS for 2 days. All samples were scanned using μCT (Y. Cheetah, YXLON, Hamburg, Germany) to determine the new bone formation at a voltage of 90 kV, the beam current of 44 mA. The resolution is about 9.0 μm. The area of the 3D scaffold was selected as the region of interest (ROI). For the 3D analysis, image reconstruction and visualizations were made with VGStudio Max2.2 software (Volume Graphics, Germany). Percent bone regeneration was calculated by normalizing the bone volume by the ROI (BV/TV) using the threshold of 100–1500 for bone and 1500–3085 for scaffold via this software.2.8 Histological evaluation
After the μCT analysis, the same species (n = 5) then experienced the same histological preparation as previously described. The slices were stained with methylene blue and basic fuchsin (Sinopharm, Shanghai, China). Images were captured using a light microscopy (Olympus dp51). The panoramic images were made by photoshop (Adobe).2.9 Statistical analysis
Statistical data was analyzed with SPSS19.0 (SPSS, Chicago, USA) by one-way analysis of variance (ANOVA) with Tukey's post hoc test. Data are presented as the mean ± standard deviation. A P-value < 0.05 was defined as statistically significant.3. Results
3.1 Characterization of the bare scaffold and the HA coatings
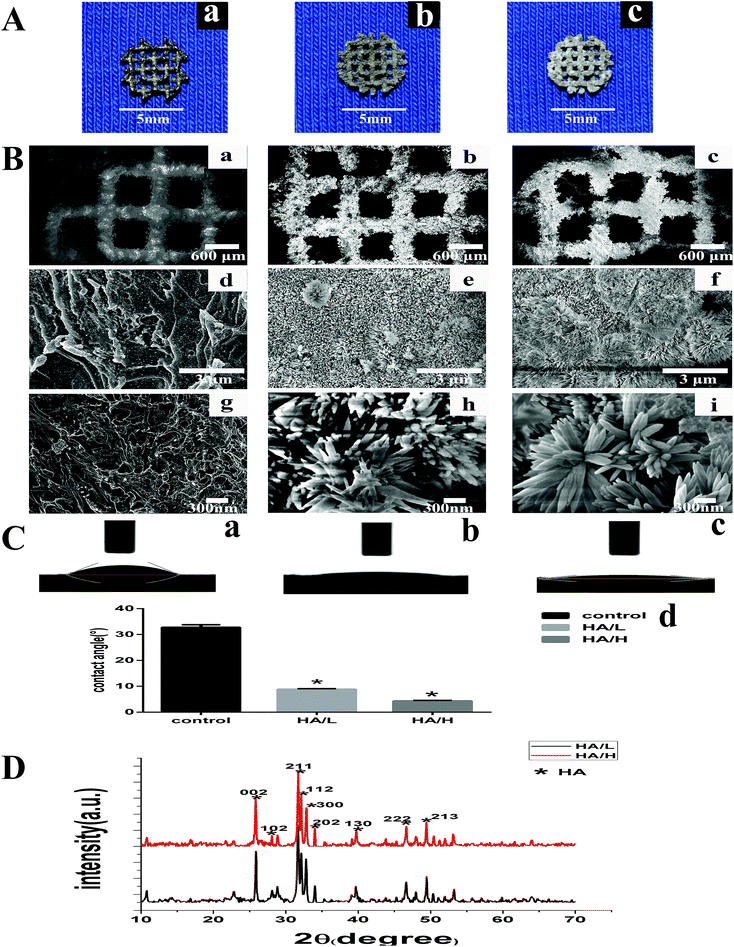
Fig. 1A shows the macro-morphology of three groups: the bare scaffold, the HA/L coated group and the HA/H coated group. Highly porous scaffolds composed of thin grids were produced. The HA coating was evenly distributed on the surface of the scaffold (Fig. 1A(b) and (c)). The HA coatings appeared gray/white in HA/L group and white in the HA/H group.SEM images of low magnification show that the 3D scaffolds had lots of granular balls on the rough surface (Fig. 1B(a)) while at high magnification, laminated structures could be seen on the surface (Fig. 1B(d) and (g)). The homogeneous HA coatings were distributed across the entire surface (Fig. 1B(b) and (c)) and rod-like crystals formed a petal-shaped structure (Fig. 1B(h) and (i)). We also observed that the size of the crystals grew larger and there were more flower-like structures as the ECD concentration increased (Fig. 1B(f)) and the rod-like crystals in the HA/L group showed a more uniform morphology (Fig. 1B(e)). The average length of the crystals in the HA/L group and in the HA/H group was 650 ± 62 nm and 500 ± 55 nm, respectively (p < 0.05).
For all the specimens, the values of contact angle were smaller than 90°, which indicates hydrophilic behaviour. The average water contact angle decreased from 33.18 ± 1.32° for the bare samples to 4.86 ± 0.21° in the HA/L coated group and to 6.48 ± 0.32° in the HA/H coated group (p < 0.05, Fig. 1C(d)), which indicates that the scaffolds after HA depositions had greater surface hydrophilicity. We assumed that the HA coating significantly increased the surface roughness of the scaffolds, which resulted in better hydrophilicity. The hydrophilicity is related to the biocompatibility; the smaller the contact angle the better biocompatibility.36 Therefore, the results reveal that the HA/H coated group gained better biocompatibility.
The diffraction peaks of the HA powder produced by ECD from the two different groups are displayed in Fig. 1D (2θ = 25.9° and 31° to 33°), which matched well with those of the characteristic HA pattern. The highest peaks of HA powder indicated that the preferable growth face of the HA crystals was 211 planes. Few peaks corresponding to other impurities were found in the traces. The XRD patterns suggest that a highly purified HA crystalline structure was successfully made in these two groups.
3.2 In vitro assays
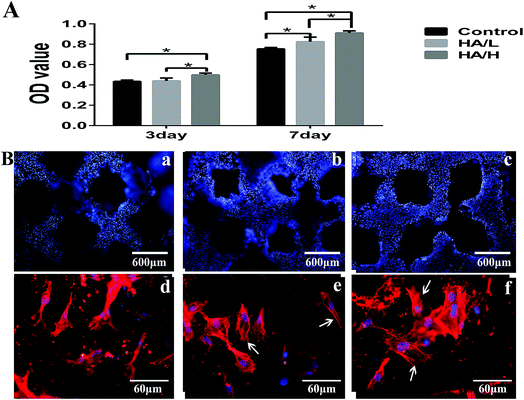
After being cultured for 36 h, MSCs were fluorescently stained with RP and DAPI to investigate cell growth and morphology. The abundant blue-stained nuclei indicate that ample cells were evenly seeded on the entire surface in all three groups (Fig. 2B(a)–(c)). Larger extensions area and more lamellipodia extensions and filopodia in the HA-coated groups (Fig. 2B(e) and (f)) which indicates that the HA coating is favorable for cell proliferation. However, in the control group most of the cells displayed a slender fusiform structure (Fig. 2B(d)).
3.3 μCT and histological analysis
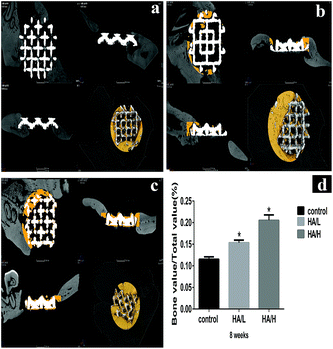
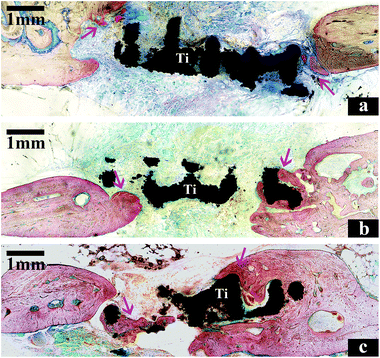
The newly formed bone (yellow color) in vivo was characterized by μ-CT. The average value of bone volume/total volume (BV/TV) was significantly higher in the HA/H group (0.205 ± 0.006) compared with the control group (0.115 ± 0.003) and the HA/L group (0.153 ± 0.003). The difference was statistically significant between the control group and the HA-coated groups (Fig. 5d). These results show that the bioactive HA coating on the 3D scaffolds played an important role in bone regeneration.Histological analysis based on the methylene blue and basic fuchsin staining was used to assess osteogenesis. There was integration between the newly formed bone and the scaffolds in the HA-coated groups. Furthermore, the newly formed bone (the dark red bone) was larger in the HA/H group (Fig. 6c) compared with the other two groups (Fig. 6a and b). In the control group, there was very little new bone formation and the gaps were obvious throughout the scaffold.
4. Discussion
To repair the clinically large maxillofacial bone defect, it is imperative to establish critically sized bone defect modals in vivo. In this study, we demonstrated the successful bone regeneration in mandible CSDs via the endochondral pathway. For this purpose, electrochemically deposited HA was coated onto porous 3D scaffolds seeded with chondrogenically differentiated MSCs in rat mandible CSDs.The 3D-structure is essential in BTE. The SLM technique could provide a porous 3D scaffold with a controllable pore size, geometry and porosity. Such 3D scaffolds are superior to the traditional 2D scaffold for bone defect regeneration.37 Previous studies showed that high porosity and a macropore size above 400 μm were beneficial for the growth of bone tissues38,39 and allowed higher production of GAGs.40 In this study, we designed a scaffold with 85% porosity and a pore size of about 600 μm which achieved bone regeneration in mandible CSD. However, during cell seeding, the large pore size led to less cell adhesion. In the future experiments, we will explore the optimal pore size of 3D scaffold for bone regeneration via the endochondral pathway.
The biological milieu can influence the extracellular matrix by host tissue–biomaterial interactions.41 Previous studies showed that surface wettability and roughness were crucially important for cellular responses to the substrates.42–44 In the present study, we show that the water contact angle was significantly decreased by the HA coating on the Ti6Al4V scaffold (Fig. 1C(d)), indicating that the surface wettability and hydrophilicity was substantially enhanced. It is well-known that the hydrophilic surfaces could promote cell adhesion and proliferation.45 Moreover, surface roughness increased after HA immobilization on the scaffolds, which could also enhance cell adhesion and proliferation.46,47 In this study, the CCK-8 results and the immunofluorescent staining indicate that the HA coating showed good bioactivity, which could improve the proliferation of BMCs.
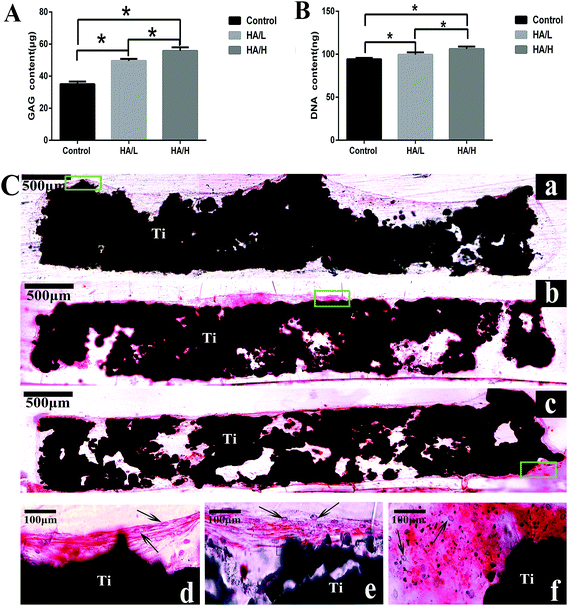
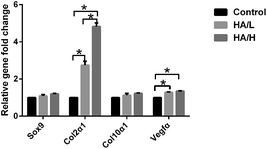
Chondrocytes are characterized by a characteristic rounded morphology and excretion of extracellular matrix, such as sulfated GAGs and Col2α1.48 The HA coating is commonly employed to improve bone regeneration of titanium scaffolds.49 However, there is no clear answer about the relationship between the HA and the formation of cartilage template elicited by MSC chondrogenic differentiation. One study by Isao Shibuya showed that the CaP-coated hydroxyapatite mineral particles (MPs) promoted the gene expression of chondrogenic and early osteogenic markers.50 However, another study showed that octacalcium phosphate suppresses chondrogenic differentiation of ATDC5 cells.51 In order to mimic the endochondral ossification process, we firstly produced a cartilage temple by seeding the BMSCs onto the scaffolds for chondrogenic priming in vitro. The RT-PCR results demonstrated the high expression of Col2α1 and Vegfα in the HA coated group, but there was low expression of Col10α1 and Sox9 among the three groups. As previous study showed, after 4 weeks of priming in vitro, the chondrocytes were at the late stage of hypertrophy, the expression level of Col10α1 (ref. 52) and Sox9 decreased.53 This result was consistent with our study. The results of GAG content, expression of Col2α1 and histological staining of safranin O in this study proved that the BMSCs successfully differentiated into chondrocytes. Moreover, the HA-coated scaffold induced higher expression of Col2α1 and increased GAG content, especially in the HA/H coated scaffold. We conclude that the HA coating is good for the chondrogenic differentiation of the BMSCs, and larger HA crystals had a better effect than smaller crystals. However, safranin O staining showed that the majority of cartilage matrix was located at the periphery of the scaffold. During the cell seeding, we observed that due to the large pore size, the cells in the pore center were lost. In addition, we found a deficiency of cartilage template in the central part of the scaffold. We assume that BMSCs in the central part of the scaffold can't tolerate poor nutritional support and so eventually undergo apoptosis.
Subsequently the cell-scaffold structures were put into the defect site, and this in vivo experiment showed that the new bone formation was also located at the periphery of the scaffolds, which is in line with the cartilage deposition. The HA/H group, which had highest expression level of Col2α1 and GAG deposition, induced the highest bone volume. It's assumed that the hypertrophic chondrocytes play important roles in bone formation. First, the hypertrophic chondrocytes release several factors, e.g. VEGF,54 matrix metalloproteinase 13 (MMP-13), bone morphogenetic protein-2 (BMP-2), osteopontin (OPN) and osteocalcin.55 The invasion of blood vessels triggers the breakdown of the cartilage matrix and new bone formation.53,56,57 Secondly, the hypertrophic chondrocytes recruit osteoblast and osteoclast precursors directly promote bone formation. Thirdly, the surrounding MSCs are attracted by the hypertrophic chondrocytes and then differentiated into osteoblasts, which lead to the mineralization of the matrix.
In terms of the results mentioned above, the close relationship between the cartilage and bone formation, we assume that more cartilage formation induces more new bone formation. However, the value of BV/TV in all the groups was not encouraging. In the next step, we will make attempt to improve the cartilage production. However, we still do not know what factors played a major role in this process, and these factors may include the pore size, porosity, the coating, or the source of stem cells.
5. Conclusions
Based on our findings, it can be concluded that HA coatings fabricated onto porous Ti6Al4V scaffolds via ECD are favor for cell proliferation and can promote the chondrogenic differentiation of MSCs. Moreover, more bone regeneration occurred in the HA-coated group. Therefore, HA coatings of 3D porous Ti6Al4V scaffolds are attractive for bone defect applications via the endochondral pathway. In particular, larger HA crystals showed a better ability to induce cartilage matrix formation and bone regeneration.Conflicts of interest
There are no conflicts to declare.Acknowledgements
We thank Chao Cheng who helped us manufacture the 3D scaffolds and Dong Chen who assisted in making hard tissue slices. This study was supported by National Natural Science Foundation of China (No. 81571011, 81371170 and 81470771), Fundamental Research Funds for the Central Universities (No. 2042017kf0075) and Hubei Provincial Natural Science Foundation of China (No. 2017CFB183).References
- R. Dimitriou, E. Jones, D. McGonagle and P. Giannoudis, BMC Med., 2011, 9, 66 CrossRef PubMed.
- E. Zomorodian and M. Baghaban Eslaminejad, Stem Cells Int., 2012, 2012, 980353 Search PubMed.
- J. I. Dawson and R. O. Oreffo, Arch. Biochem. Biophys., 2008, 473, 124–131 CrossRef PubMed.
- Y. Tsumanuma, T. Iwata, K. Washio, T. Yoshida, A. Yamada, R. Takagi, T. Ohno, K. Lin, M. Yamato, I. Ishikawa, T. Okano and Y. Izumi, Biomaterials, 2011, 32, 5819–5825 CrossRef PubMed.
- R. Nishimura, E. Nakamura, J. Kida, H. Yagi and K. Hata, Clin. Calcium, 2014, 24, 509–516 Search PubMed.
- B. Levi, J. S. Hyun, D. T. Montoro, D. D. Lo, C. K. F. Chan, S. J. Hu, N. Sun, M. Lee, M. Grova, A. J. Connolly, J. C. Wu, G. C. Gurtner, I. L. Weissman, D. C. Wan and M. T. Longaker, Proc. Natl. Acad. Sci. U. S. A., 2012, 109, 20379–20384 CrossRef PubMed.
- J. Handschel, K. Berr, R. A. Depprich, N. R. Kubler, C. Naujoks, H. P. Wiesmann, M. A. Ommerborn and U. Meyer, Head Face Med., 2008, 4, 10 CrossRef PubMed.
- A. Oryan, S. Monazzah and A. Bigham-Sadegh, Biomed. Environ. Sci., 2015, 28, 57–71 Search PubMed.
- F. Tortelli, R. Tasso, F. Loiacono and R. Cancedda, Biomaterials, 2010, 31, 242–249 CrossRef PubMed.
- F. G. Lyons, A. A. Al-Munajjed, S. M. Kieran, M. E. Toner, C. M. Murphy, G. P. Duffy and F. J. O'Brien, Biomaterials, 2010, 31, 9232–9243 CrossRef PubMed.
- A. R. Amini, C. T. Laurencin and S. P. Nukavarapu, Crit. Rev. Bioeng., 2012, 40, 363–408 Search PubMed.
- F. J. O'Brien, Mater. Today, 2011, 14, 88–95 CrossRef.
- A. Nakamura, M. Akahane, H. Shigematsu, M. Tadokoro, Y. Morita, H. Ohgushi, Y. Dohi, T. Imamura and Y. Tanaka, Bone, 2010, 46, 418–424 CrossRef PubMed.
- T. Long, Z. A. Zhu, H. A. Awad, E. M. Schwarz, M. J. Hilton and Y. F. Dong, Biomaterials, 2014, 35, 2752–2759 CrossRef PubMed.
- X. J. Sun, L. Wei, Q. Chen and R. M. Terek, Clin. Orthop. Relat. Res., 2015, 473, 907–913 CrossRef PubMed.
- J. Dai and A. B. M. Rabie, J. Dent. Res., 2007, 86, 937–950 CrossRef PubMed.
- W. Yang, F. Yang, Y. Wang, S. K. Both and J. A. Jansen, Acta Biomater., 2013, 9, 4505–4512 CrossRef PubMed.
- C. Scotti, B. Tonnarelli, A. Papadimitropoulos, A. Scherberich, S. Schaeren, A. Schauerte, J. Lopez-Rios, R. Zeller, A. Barbero and I. Martin, Proc. Natl. Acad. Sci. U. S. A., 2010, 107, 7251–7256 CrossRef PubMed.
- E. Farrell, S. K. Both, K. I. Odorfer, W. Koevoet, N. Kops, F. J. O'Brien, R. J. B. de Jong, J. A. Verhaar, V. Cuijpers, J. Jansen, R. G. Erben and G. J. V. M. van Osch, BMC Musculoskeletal Disord., 2011, 12, 19 CrossRef PubMed.
- C. Scotti, E. Piccinini, H. Takizawa, A. Todorov, P. Bourgine, A. Papadimitropoulos, A. Barbero, M. G. Manz and I. Martin, Proc. Natl. Acad. Sci. U. S. A., 2013, 110, 3997–4002 CrossRef PubMed.
- X. Cai, F. Yang, X. Yan, W. Yang, N. Yu, D. A. Oortgiesen, Y. Wang, J. A. Jansen and X. F. Walboomers, J. Clin. Periodontol., 2015, 42, 380–389 CrossRef PubMed.
- J. van der Stok, M. K. E. Koolen, H. Jahr, N. Kops, J. H. Waarsing, H. Weinans and O. P. van der Jagt, Eur. Cells Mater., 2014, 27, 137–148 CrossRef PubMed.
- N. Harada, Y. Watanabe, K. Sato, S. Abe, K. Yamanaka, Y. Sakai, T. Kaneko and T. Matsushita, Biomaterials, 2014, 35, 7800–7810 CrossRef PubMed.
- W. X. Yang, S. K. Both, G. J. V. M. van Osch, Y. N. Wang, J. A. Jansen and F. Yang, Acta Biomater., 2015, 13, 254–265 CrossRef PubMed.
- N. Shadjou and M. Hasanzadeh, Mater. Sci. Eng., C, 2015, 55, 401–409 CrossRef PubMed.
- B. J. Zhao, H. Wang, N. Qiao, C. Wang and M. Hu, Mater. Sci. Eng., C, 2017, 70, 832–841 CrossRef PubMed.
- H. C. Kroese-Deutman, J. W. M. Vehof, P. H. M. Spauwen, P. J. W. Stoelinga and J. A. Jansen, Int. J. Oral Surg., 2008, 37, 542–549 CrossRef PubMed.
- Y. Li, W. Yang, X. K. Li, X. Zhang, C. R. Wang, X. F. Meng, Y. F. Pei, X. L. Fan, P. H. Lan, C. H. Wang, X. J. Li and Z. Guo, ACS Appl. Mater. Interfaces, 2015, 7, 5715–5724 CrossRef PubMed.
- M. Hirota, T. Shima, I. Sato, T. Ozawa, T. Iwai, A. Ametani, M. Sato, Y. Noishiki, T. Ogawa, T. Hayakawa and I. Tohnai, Biomaterials, 2016, 75, 223–236 CrossRef PubMed.
- G. L. Yang, F. M. He, J. A. Hu, X. X. Wang and S. F. Zhao, Oral Surg., Oral Med., Oral Pathol., 2009, 107, 782–789 CrossRef PubMed.
- S.-f. Zhao, W.-j. Dong, Q.-h. Jiang, F.-m. He, X.-x. Wang and G.-l. Yang, J. Zhejiang Univ., Sci., B, 2013, 14, 518–525 CrossRef PubMed.
- G. L. Yang, F. M. He, J. A. Hu, X. X. Wang and S. F. Zhao, J. Oral Maxillofac. Surg., 2010, 68, 420–427 CrossRef PubMed.
- L. Besra and M. Liu, Prog. Mater. Sci., 2007, 52, 1–61 CrossRef.
- F. Kubaski, H. Osago, R. W. Mason, S. Yamaguchi, H. Kobayashi, M. Tsuchiya, T. Orii and S. Tomatsu, Mol. Genet. Metab., 2017, 120, 67–77 CrossRef PubMed.
- R. W. Farndale, D. J. Buttle and A. J. Barrett, Biochim. Biophys. Acta, Gen. Subj., 1986, 883, 173–177 CrossRef.
- M. Prodana, M. Duta, D. Ionita, D. Bojin, M. S. Stan, A. Dinischiotu and I. Demetrescu, Ceram. Int., 2015, 41, 6318–6325 CrossRef.
- D. Antoni, H. Burckel, E. Josset and G. Noel, Int. J. Mol. Sci., 2015, 16, 5517–5527 CrossRef PubMed.
- B. Feng, Z. Jinkang, W. Zhen, L. Jianxi, C. Jiang, L. Jian, M. Guolin and D. Xin, Biomed. Mater., 2011, 6, 015007 CrossRef PubMed.
- V. Karageorgiou and D. Kaplan, Biomaterials, 2005, 26, 5474–5491 CrossRef PubMed.
- R. A. Perez and G. Mestres, Mater. Sci. Eng., C, 2016, 61, 922–939 CrossRef PubMed.
- G. Sailaja, P. Ramesh, S. Vellappally, S. Anil and H. Varma, J. Biomed. Sci., 2016, 23, 77 CrossRef PubMed.
- D. O. Costa, P. D. H. Prowse, T. Chrones, S. M. Sims, D. W. Hamilton, A. S. Rizkalla and S. J. Dixon, Biomaterials, 2013, 34, 7215–7226 CrossRef PubMed.
- C. Bayram, M. Demirbilek, N. Caliskan, M. E. Demirbilek and E. B. Denkbas, J. Biomed. Nanotechnol., 2012, 8, 482–490 CrossRef PubMed.
- D. J. Cohen, A. Cheng, A. Kahn, M. Aviram, A. J. Whitehead, S. L. Hyzy, R. M. Clohessy, B. D. Boyan and Z. Schwartz, Sci. Rep., 2016, 6, 20493 CrossRef PubMed.
- F. Rupp, L. Scheideler, N. Olshanska, M. de Wild, M. Wieland and J. Geis-Gerstorfer, J. Biomed. Mater. Res., Part A, 2006, 76, 323–334 CrossRef PubMed.
- Y. Li, W. Yang, X. Li, X. Zhang, C. Wang, X. Meng, Y. Pei, X. Fan, P. Lan, C. Wang, X. Li and Z. Guo, ACS Appl. Mater. Interfaces, 2015, 7, 5715–5724 CrossRef PubMed.
- Q. Yuan, D. Liao, X. Yang, X. Li, N. Wei, Z. Tan and P. Gong, J. Biomed. Mater. Res., Part A, 2010, 93, 381–388 Search PubMed.
- C. Chung and J. A. Burdick, Adv. Drug Delivery Rev., 2008, 60, 243–262 CrossRef PubMed.
- M. Sato, A. Aslani, M. A. Sambito, N. M. Kalkhoran, E. B. Slamovich and T. J. Webster, J. Biomed. Mater. Res., Part A, 2008, 84A, 265–272 CrossRef PubMed.
- Y. Wang, X. Yu, C. Baker, W. L. Murphy and T. C. McDevitt, Acta Biomater., 2016, 29, 42–51 CrossRef PubMed.
- I. Shibuya, K. Yoshimura, Y. Miyamoto, A. Yamada, M. Takami, T. Suzawa, D. Suzuki, N. Ikumi, F. Hiura, T. Anada, O. Suzuki and R. Kamijo, Cell Tissue Res., 2013, 352, 401–412 CrossRef PubMed.
- W. Yang, S. K. Both, G. J. van Osch, Y. Wang, J. A. Jansen and F. Yang, Acta Biomater., 2015, 13, 254–265 CrossRef PubMed.
- E. Kozhemyakina, A. B. Lassar and E. Zelzer, Development, 2015, 142, 817–831 CrossRef PubMed.
- H. M. Kronenberg, Nature, 2003, 423, 332–336 CrossRef PubMed.
- B. Yan, Z. Zhang, D. Jin, C. Cai, C. Jia, W. Liu, T. Wang, S. Li, H. Zhang, B. Huang, P. Lai, H. Wang, A. Liu, C. Zeng, D. Cai, Y. Jiang and X. Bai, Nat. Commun., 2016, 7, 11151 CrossRef PubMed.
- N. Ortega, D. J. Behonick and Z. Werb, Trends Cell Biol., 2004, 14, 86–93 CrossRef PubMed.
- M. Wuelling and A. Vortkamp, Cartilage and Bone Development and Its Disorders, 2011, vol. 21, pp. 1–11 Search PubMed.
Footnote |
| † Both authors contributed equally. |
| This journal is © The Royal Society of Chemistry 2018 |

