 Open Access Article
Study of magnetic and electrical properties of Pr0.65Ca0.25Ba0.1MnO3 manganite
Ali Mleiki *ab,
R. Hanena,
H. Rahmouni
 a,
N. Guermazic,
K. Khirounid,
E. K. Hlile and
A. Cheikhrouhoub
aUnité de Recherche Matériaux Avancés et Nanotechnologies (URMAN), Institut Supérieur des Sciences Appliquées et de Technologie de Kasserine, Kairouan University, BP 471, Kasserine 1200, Tunisia. E-mail: alimlk1986@hotmail.com
bLT2S, Digital Research Center of Sfax, Sfax Technoparc, 3021, Sfax, Tunisia
cLaboratoire Génie des Matériaux et Environnement (LGME), Ecole Nationale d’Ingénieurs de Sfax (ENIS), Université de Sfax, Sfax, Tunisia
dLaboratoire de Physique des Matériaux et des Nanomatériaux Appliquée à l’Environnement, Faculté des Sciences de Gabès cité Erriadh, Université de Gabès, 6079 Gabès, Tunisia
eInstitut Néel, CNRS et Université Joseph Fourier, BP 166, F-38042 Grenoble Cedex 9, France
First published on 12th September 2018
Abstract
The magnetic properties and magnetocaloric effect (MCE) in Pr0.65Ca0.25Ba0.1MnO3 have been investigated supplemented by electrical data. X-ray diffraction shows that the sample crystallizes in the distorted orthorhombic system with the Pnma space group. Pr0.65Ca0.25Ba0.1MnO3 undergoes paramagnetic–ferromagnetic (PM–FM) phase transition at TC ∼ 85 K. For a magnetic field change of 5 T, the maximum value of the magnetic entropy change (−ΔSmaxM) is estimated to be 4.4 J kg−1 K−1 around TC with a large relative cooling power (RCP) value of 263.5 J kg−1. While the modified Arrott plots suggested that the magnetic transition belongs to the second order phase transitions, the universal curves of the rescaled magnetic entropy (ΔSM) proved the opposite. The electrical properties of Pr0.65Ca0.25Ba0.1MnO3 have been investigated using impedance spectroscopy techniques. The dc-resistivity (σdc) study shows the presence of semiconductor behavior. Ac-conductivity (σac) analysis shows that the conductivity is governed by a hopping process. From the analysis of the alternating regime, the exponent s variation obtained is in good agreement with Mott theory. The impedance spectrum analysis reveals the presence of a relaxation phenomenon. Based on these analyzes, the sample can be modeled by an electrical equivalent circuit.
1. Introduction
Manganese perovskites with the general formula AMnO3, where A = lanthanide or divalent alkaline earth, are of considerable technological importance, particularly with regard to electrical and magnetic properties. The physical properties of these materials can be changed using magnetic or electric fields, which opens up the field to important technological applications. The chemical and physical properties of perovskite oxides vary with composition from dielectric to superconducting, and they find application as magnetic sensors, spintronic devices, catalysts, magnetic recording devices, and magnetoresistive transducers and in magnetic refrigeration systems.1–4The structural, electrical, and magnetic properties of these compounds are sensitive to both the manganese valence and internal chemical factors, such as the average cationic radius 〈rA〉 in the A-site and the A-site cationic disorder. Introducing quenched disorder in manganites as different ions at A-site can leads to a change in structure, which modifies the original system completely. A-site doping can be strongly influenced by the average ionic radius, which exhibits a close relation between the distortion of MnO6 octahedra and the narrowing of the electronic bandwidth.
The low bandwidth manganites Pr1−xCaxMnO3 have been the subject of several studies with calcium concentration due to their diverse physical properties such as charge-ordering (CO),5 metamagnetic transition,6 colossal magnetoresistance7,8 and large magnetocaloric effects.9 In the case of a 35% Ca-doped sample,10 it undergoes a charge-ordering (CO) transition at about 230 K, an antiferromagnetic (AFM) transition in the vicinity of 160 K. Without applied magnetic field, its electrical conduction shows insulator characteristics. Below the AFM transition temperature, application of a high magnetic field (above μ0H = 4 T) leads this one to metallic and ferromagnetic (FM) state. In addition, it is worth mentioning for the Pr0.65(Ca1−xSrx)0.35MnO3 compounds the partial substitution of Sr2+ ions for Ca2+ ions, having higher ionic radius, shows up many physical interesting phenomena,11–13 particularly with x ≈ 0.3 the charge and orbital ordering appear below 200 K, but above x ≈ 0.3 collapse into the metallic state has been observed below 100 K.14
Study of A-site doped Pr0.65Ca0.35MnO3 sample would offer a complementary understanding of the structural, magnetic and electrical properties. To the best of our knowledge, there are no reports on the physical properties of Ba doped Pr0.65Ca0.35MnO3 compounds. Substitution of calcium by barium is interesting as the difference between ionic sizes of Ca and Ba is significantly large. The selection of Ba as a dopant was inspired by an intention to induce chemical pressure inside the lattice to favor the electron/hole transfer between the neighboring Mn sites. In this context, we report how a direct substitution of barium ion in the A-site affects the physical properties as compared to pure Pr0.65Ca0.35MnO3. Our results show that at x = 0.10 doping level the charge ordering (CO) is destroyed and drastic changes of properties have been observed.
2. Experimental details
Polycrystalline perovskite Pr0.65Ca0.25Ba0.1MnO3 sample was fabricated by standard solid-state reaction method. After thoroughly mixing the stoichiometric reactants of high purity (99.99%) [Aldrich] Pr6O11, CaCO3, BaCO3 and MnO2, the sample is fired at 900 °C for 12 h. Then, the mixture was pressed into pellets and sintered at 1000–1200 K for 48 h in air with several intermediate grindings. The powder X-ray diffractometer (“Panalytical X pert Pro” diffractometer with Cu-Kα radiation (λ = 1.5406 Å)) was employed to identify the phase purity and crystalline structure at room temperature. The unit cell parameters were refined using the Rietveld analysis of the X-ray powder diffraction data with the help of FULLPROF software.15 The static magnetic measurements were carried out in magnetic fields up to 5 T at temperatures between 5 and 285 K on a BS2 magnetometer equipped with a super conducting coil and developed at Neel Institute. On the both side of the pellet, we deposited a thin aluminum film through a circular mask of 6 mm of diameter. Then, we obtained a configuration of a plate capacitor used to measure both the capacitance and the conductance. The sample is mounted in a cryostat which allows the variation of temperature from 80 to 300 K. Conductance and capacitance measurement are performed using an Agilent 4294A analyzer.3. Results and discussion
(a) X-ray diffraction
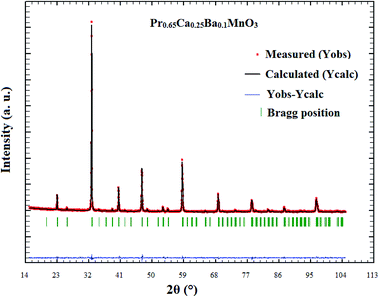
In order to determine the crystalline structure of Pr0.65Ca0.25Ba0.1MnO3, room temperature powder X-ray diffraction (XRD) pattern was collected. The XRD pattern of Pr0.65Ca0.25Ba0.1MnO3 sample is shown in Fig. 1. It is seen from the results that all peaks can be indexed according to a perovskite structure with orthorhombic Pnma symmetry. Rietveld refinement confirms that there are no detectable impurities in this compound. From the XRD pattern lattice parameters obtained from refinements are: 5.4565(3) Å, b = 7.7240(4) Å and c = 5.4519(5) Å.(b) Magnetic and magnetocaloric effect
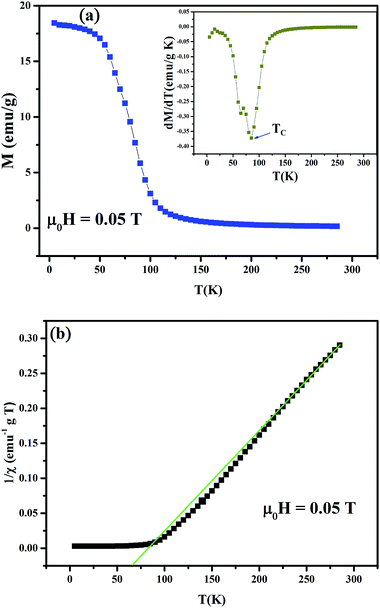
The temperature dependence of the magnetization, M(T), measured via field-cooled (FC) protocol at 0.05 T applied magnetic field is shown in Fig. 2(a). With decreasing temperature the Pr0.65Ca0.25Ba0.1MnO3 compound displays a typical paramagnetic–ferromagnetic (PM–FM) transition. The Curie temperature (TC), corresponding to the minimum in dM/dT − T curve (see inset of Fig. 2(a)), is determined to be 85 K. Apparently, as compared to Pr0.65Ca0.35MnO3,16 a 10% barium substitution at the A-site destroys the charge ordering (CO) in the pristine compound. Because the larger ionic size of Ba2+ compared to that of Ca2+, the destruction of CO state can be attributed to the increase of the average ionic radius of the A-site (〈rA〉) which leads to the increase of eg bandwidth, favors the electrons movement through the lattice and promotes the FM metallic state. The isoelectronic A-site substitution controls the structure by the distortion of MnO6 octahedra, i.e., tilting and rotation of the MnO6 octahedra, which modifies local structural parameters such as the Mn–O bond distance and Mn–O–Mn bond angle, and then directly influence the case of electron hopping between Mn ions.17 Several works on manganites show that the FM state as well as the CO are affected due to the chemical pressure at A-site.18–20In Fig. 2(b) we have reported the inverse susceptibility 1/χ as a function of temperature for Pr0.65Ca0.25Ba0.1MnO3. A deviation has been observed which starts around 225 K far above TC, which may be due to growth of short range magnetic interactions in the compound.17,19 However, the curve in PM regime from 230 to 285 K obeys the Curie–Weiss (CW) formula χ = C/(T − θP), where C is the Curie constant and θP is the PM Curie temperature. The fitting of the linear region to the CW law yields positive θP, θP = 66.5 K, indicating dominant FM interactions. On another hand, the detailed calculation of the theoretical effective moment (μtheoeff) can be found elsewhere.21 Moreover, the experimental effective moment is found to be μexpeff = 14.5μB, which is much larger than its theoretical counterpart μtheoeff = 5.53μB, confirming clearly the magnetic inhomogeneity of our sample. This behavior can be explained in terms of the presence of FM clusters of Mn3+, Mn4+ double exchange pairs together in the PM region22
Fig. 3(a) shows the evolution of isothermal magnetization as a function of the magnetic applied field, M(H), for Pr0.65Ca0.25Ba0.1MnO3 sample. At low temperature, we can see that magnetization increases sharply with the applied field for μ0H < 0.5 T indicating the presence of FM behavior. The magnetic nature of the sample above 156 K is clearly PM as the magnetization increases linearly with increasing magnetic field.
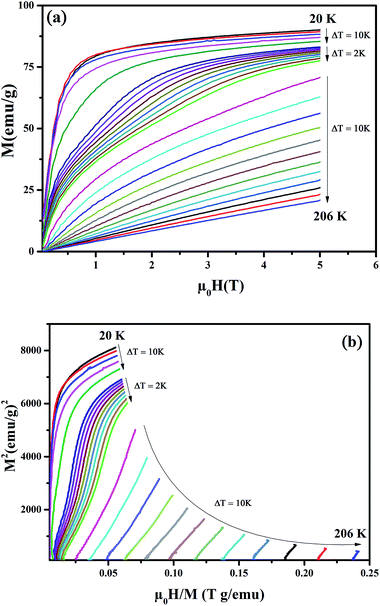 | ||
| Fig. 3 (a) Isothermal magnetization around TC for Pr0.65Ca0.25Ba0.1MnO3 compound at different temperatures. (b) Standard Arrott plots (isotherms M2 vs. H/M). | ||
Based on the Arrott plots, the isotherms of M2 as a function of H/M are shown in Fig. 3(b). The order of the magnetic transition was analyzed based in the criterion suggested by Banerjee.23 As can be observed, the positive slopes of the Arrott plots for Pr0.65Ca0.25Ba0.1MnO3 sample indicate a second-order magnetic transition. According to the mean field theory, the Arrott plots should give a series of parallel straight lines around TC.24 However, all M2 versus H/M curves show non-linear behavior in high-magnetic field having downward curvature which indicate the non-mean-field magnetic interactions in this sample.
The magnetocaloric effect (MCE) can be related to the magnetic properties of Pr0.65Ca0.25Ba0.1MnO3. The MCE have been estimated from the temperature and field dependence of the magnetization M(H, T), (see Fig. 3(a)), through the thermodynamics Maxwell's relation:25
 | (1) |
It can be found that the maximum value of magnetic entropy (−ΔSM) increases monotonically with increasing magnetic field change. In addition, we can see in Fig. 4(a) the presence of a transition temperature shift induced by the applied magnetic field. Therefore, the −ΔSM is maximized around TC and its maximum values (−ΔSmaxM) are found to be approximately 2.5 and 4.4 J kg−1 K−1 under a magnetic field changes of 2 and 5 T. Other important parameter of refrigerant materials is the relative cooling power (RCP) which is defined by the product of the peak entropy change and the full width at half maximum of the peak, i.e., RCP = −ΔSmaxM δTFWHM (where δTFWHM is the full width at half-maximum of ΔSM(T)). Thus, the resulting RCP values are found to be 104.2 and 263.5 J kg−1 under a magnetic field changes of 2 and 5 T, respectively. The obtained values are comparable with those of several manganite systems with a large MCE,26–32 suggesting that our compound may be suitable candidate for magnetic refrigeration. The large MCE in Pr0.65Ca0.25Ba0.1MnO3 can be understood by its sharp magnetization change at the FM–PM transition and its high magnetization saturation.
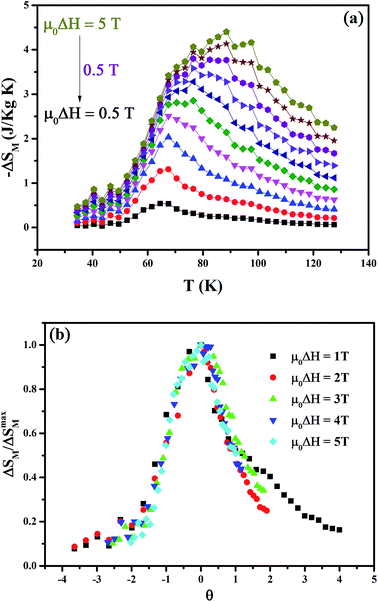 | ||
| Fig. 4 (a) Temperature dependence of the magnetic entropy changes ΔSM under various external magnetic fields. (b) Universal curves of Pr0.65Ca0.25Ba0.1MnO3 sample. | ||
Additionally, a phenomenological universal curve for ΔSM(T) in the vicinity of a second-order phase transition has been theoretically established33,34 and successfully applied to several families of magnetic material,35–38 which can be used as a further criterion to reveal the order of the magnetic phase transition. In addition, this scaling can be particularly helpful for investigating the refrigerant capacity of a similar material. However, a breakdown of the universal curve can be attributed to inhomogeneity within the material.39 The temperature axis was transformed according to the relation:
 | (2) |
(c) DC-resistivity study
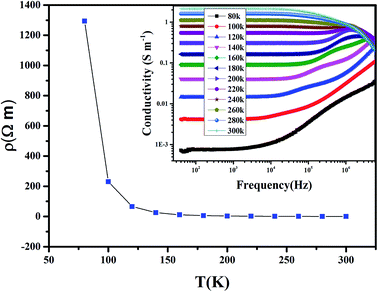
The variation of the dc-resistivity (ρ) as a function of temperature of Pr0.65Ca0.25Ba0.1MnO3 is represented schematically in Fig. 5. Across all the studied temperature ranges, the ρ decreases by increasing temperature which indicates that this compound exhibits a semiconductor behavior. The decrease in ρ when the temperature increases could be due to the increase the density of free carriers that acquire a sufficient thermal energy thermal energy to easily cross the barriers encountered.(d) AC-conductivity study
The inset of Fig. 5 shows the frequency dependence of conductivity (σ) at different temperatures for Pr0.65Ca0.25Ba0.1MnO3. As we can observe, ac-conductivity (σac) spectrum exhibits the presence of several behaviors. At low frequency (f < 104 Hz), a large plateau, corresponds to dc-conductivity (σdc), appears and the σ increases by increasing temperature. Such behavior indicates that conduction process is thermally activated by increasing the density of free carriers in the structure. Above 105 Hz and for T > 180 K, a metallic behavior appears accompanied by a decrease in σ. However, for T < 180 K the σ monotonically increases with increasing frequency, indicating a superposition of different relaxation processes.40 The range of temperature, where σ monotonically increases, could be described by the law of Jonscher:| A = ωs | (3) |
| s = 1 − (6 kBT/Wm) | (4) |
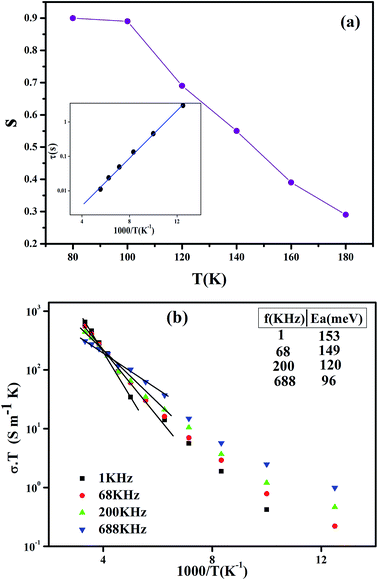 | ||
| Fig. 6 (a) Temperature dependence of the frequency exponent s, the inset shows the plot of ‘τ’ versus 1000/T. (b) Arrhenius plot of (σacT) at different frequencies for Pr0.65Ca0.25Ba0.1MnO3. | ||
Fig. 6(b) shows the product ‘conductivity temperature’ (σT) versus (1000/T) at different frequencies (1 kHz, 68 kHz, 200 kHz and 688 kHz). The high temperature conductance data were well fitted to the following equation:43
σ = σ0/T![[thin space (1/6-em)]](https://www.rsc.org/images/entities/char_2009.gif) exp(−Eac/kBT) exp(−Eac/kBT)
| (5) |
(e) Complex impedance analysis
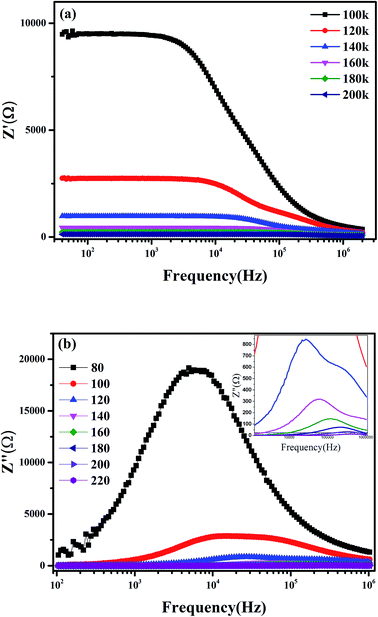
The complex impedance Z* of the network is defined as:| Z* = Z′(ω) + jZ′′(ω) | (6) |
![[thin space (1/6-em)]](https://www.rsc.org/images/entities/char_2009.gif) τ versus 1000/T. It is observed that the value of τ decreases by increasing the temperature, which indicate a thermally activated process. This result shows the presence of one conduction mechanism where the slope does not changes across all the studied temperature ranges.
τ versus 1000/T. It is observed that the value of τ decreases by increasing the temperature, which indicate a thermally activated process. This result shows the presence of one conduction mechanism where the slope does not changes across all the studied temperature ranges.
Fig. 8 shows the Nyquist diagram of the system Pr0.65Ca0.25Ba0.1MnO3 obtained at T = 80 K. The spectrum is characterized by the appearance of a semicircle arc. To connect the microstructure of the compound with its electrical response, an equivalent electrical circuit can be established by modelling the impedance data using Zview software. As can be seen in Fig. 8, the agreement between the experimental and theoretical data is satisfactory. Then, the equivalent configuration is of the type ((R1//ZCPE3) + (Rs//ZCPE2) + (Rp//ZCPE1)) as shown in the inset of Fig. 8.
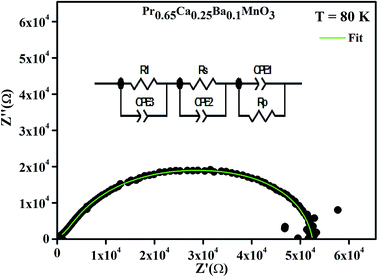 | ||
| Fig. 8 Complex impedance spectrum (Nyquist plot) at T = 80 K with the electrical equivalent circuit. | ||
(f) Dielectric properties
The study of the dielectric properties is another important source of information regarding the conduction process. The complex dielectric permittivity according to the Mott's theory43 is defined as:| ε* = ε′(ω) − jε′′(ω) | (7) |
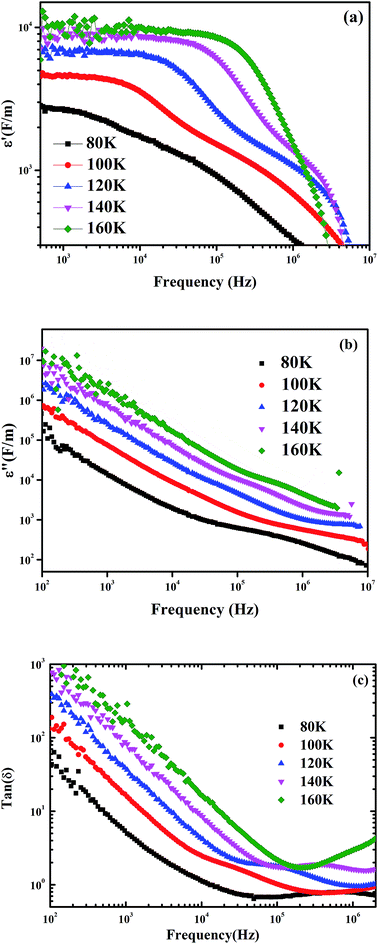 | ||
| Fig. 9 Variation of real part (a) and imaginary part (b) of permittivity as a function of frequency, (c) variation of loss tangent with frequency at different temperature for Pr0.65Ca0.25Ba0.1MnO3. | ||
Fig. 9(b) clearly shown that ε′′ decreases with increasing the frequency and no peak is observed, confirming that the polarization phenomenon in this sample is governed by a hopping process.60 This result may be due to space charge polarization and interface effects.61 At low frequencies, ε′′ has higher values, suggesting the contribution of all polarization effects particularly the interfacial/space polarization due to an inhomogeneous dielectric structure. At high frequencies, where the electric dipoles cannot follow the applied electric field, the low value attained may be due to the gradual decrease of the dielectric loss. On another hand, the variation of tang(δ) (=ε′′/ε′) as a function of frequency is shown in Fig. 9(c). At constant frequency the dielectric loss increases by increasing temperature which may be due to the increase in conductivity. However, by increasing frequency, the loss tangent first decreases and then increases. Since the charge carriers cannot follow the electric field, at higher frequencies, the value of tang(δ) remains low.
4. Conclusion
Structural, magnetic and electrical properties of Pr0.65Ca0.25Ba0.1MnO3 manganite were investigated. A Rietveld analysis shows that the sample crystallizes in the orthorhombic structure with Pnma space group. Magnetic measurements show a sharp paramagnetic to ferromagnetic transition around Curie temperature TC. A large maximum of magnetic entropy change (−ΔSmaxM) value has been found with a large relative cooling power (RCP) value. The variation of resistivity as a function of the temperature shows the presence of a semiconductor behavior. The ac-conductivity study is obeyed to the Jonscher law. The dominance of hopping mechanism was confirmed by the variation of the exponent s. Complex impedance analysis permits to model the sample by an electrical equivalent circuit and displays the presence of a relaxation phenomenon. The dielectric study shows the contribution of different types of polarization.Conflicts of interest
There are no conflicts to declare.References
- A. Mleiki, S. Othmani, W. Cheikhrouhou-Koubaa, A. Cheikhrouhou and E. K. Hlil, Enhanced relative cooling power in Ga-doped La0.7(Sr,Ca)0.3MnO3 with ferromagnetic-like canted state, RSC Adv., 2016, 6, 53602 RSC.
- Q. Zhang, L. Yin, W. Mi and X. Wang, Large Spatial Spin Polarization at Benzene/La2/3Sr1/3MnO3 Spinterface: Toward Organic Spintronic Devices, J. Phys. Chem. C, 2016, 120, 6156 CrossRef.
- R. Dinamarca, C. Sepúlveda, E. J. Delgado, O. Peña, J. L. G. Fierro and G. Pecchi, Electronic properties and catalytic performance for DME combustion of lanthanum manganites with partial B-site substitution, J. Catal., 2016, 338, 47 CrossRef.
- S. Saha, K. Das, S. Bandyopadhyay and I. Das, A-site cationic disorder induced significantly large magnetoresistance in polycrystalline La0.2Gd0.5Ba0.3MnO3 compound, J. Magn. Magn. Mater., 2017, 442, 196 CrossRef.
- Y. Tokura, Colossal Magnetoresistive Oxides, Gordon and Breach Science, New York, 2000 Search PubMed.
- T. Elovaara, H. Huhtinen, S. Majumdar and P. Paturi, Irreversible metamagnetic transition and magnetic memory in small-bandwidth manganite Pr1-xCaxMnO3 (x = 0.0–0.5), J. Phys.: Condens. Matter, 2012, 24, 216002 CrossRef PubMed.
- Y. Tokura, Critical features of colossal magnetoresistive manganites, Rep. Prog. Phys., 2006, 69, 797 CrossRef.
- A.-M. Haghiri-Gosnet and J.-P. Renard, CMR manganites: physics, thin films and devices, J. Phys. D: Appl. Phys., 2003, 36, R127 CrossRef.
- V. S. Kolat, T. Izgi, A. O. Kaya, N. Bayri, H. Gencer and S. Atalay, Metamagnetic transition and magnetocaloric effect in charge-ordered Pr0.68Ca0.32-xSrxMnO3 (x = 0, 0.1, 0.18, 0.26 and 0.32) compounds, J. Magn. Magn. Mater., 2010, 322, 427 CrossRef.
- J. Dho and N. H. Hur, Thermal relaxation of field-induced irreversible ferromagnetic phase in Pr-doped manganites, Phys. Rev. B: Condens. Matter Mater. Phys., 2003, 67, 214414 CrossRef.
- Y. Kashiwada, H. Fujishiro and M. Ibeke, Thermal conductivity of Pr0.65(Ca1−ZSrZ)0.35MnO3 under applied field, Physica B, 2003, 329, 924 CrossRef.
- A. Biswas, T. Samanta, S. Banerjee and I. Das, Influence of charge ordering on magnetocaloric properties of nanocrystalline Pr0.65(Ca0.7Sr0.3)0.35MnO3, Appl. Phys. Lett., 2008, 92, 012502 CrossRef.
- S. Saha, K. Das, S. Bandyopadhyay and I. Das, A comparative study of magnetic field induced meta-magnetic transition in nanocrystalline and bulk Pr0.65(Ca0.7Sr0.3)0.35MnO3 compound, J. Magn. Magn. Mater., 2017, 432, 271 CrossRef.
- H. Yoshizawa, R. Kajimoto, H. Kawano, Y. Tomioka and Y. Tokura, Bandwidth-control-induced insulator-metal transition in Pr0.65(Ca1−ySry)0.35MnO3 and Pr0.7Ca0.3MnO3, Phys. Rev. B: Condens. Matter Mater. Phys., 1997, 55, 2729 CrossRef.
- J. Rodriguez-Carvajal, Recent advances in magnetic structure determination by neutron powder diffraction, Physica B, 1993, 192, 55 CrossRef.
- S. Mollah, H. L. Huang, H. D. Yang, S. Pal, S. Taran and B. K. Chaudhuri, Non-adiabatic small-polaron hopping conduction in Pr0.65Ca0.35-xSrxMnO3 perovskites above the metal–insulator transition temperature, J. Magn. Magn. Mater., 2004, 284, 383 CrossRef.
- A. Mleiki, S. Othmani, W. Cheikhrouhou-Koubaa, M. Koubaa, A. Cheikhrouhou and E. K. Hlil, Effect of praseodymium doping on the structural, magnetic and magnetocaloric properties of Sm0.55-xPrxSr0.45MnO3 (0.1 ≤ x ≤ 0.4) manganites, J. Alloys Compd., 2015, 645, 559 CrossRef.
- H. Ben Khlifa, S. Othmani, I. Chaaba, S. Tarhouni, W. Cheikhrouhou-Koubaa, M. Koubaa, A. Cheikhrouhou and E. K. Hlil, Effect of K-doping on the structural, magnetic and magnetocaloric properties of Pr0.8Na0.2–xKxMnO3 (0 ≤ x ≤ 0.15) manganites, J. Alloys Compd., 2016, 680, 388 CrossRef.
- A. Mleiki, S. Othmani, W. Cheikhrouhou-Koubaa, M. Koubaa, A. Cheikhrouhou and E. K. Hlil, Effect of praseodymium doping on the structural, magnetic and magnetocaloric properties of Sm0.55Sr0.45MnO3 manganite, Solid State Commun., 2015, 223, 6 CrossRef.
- I. Sfifir, A. Ezaami, W. Cheikhrouhou-Koubaa and A. Cheikhrouhou, Structural, magnetic and magnetocaloric properties in La0.7-xDyxSr0.3MnO3 manganites (x = 0.00, 0.01 and 0.03), J. Alloys Compd., 2017, 696, 760 CrossRef.
- A. Mleiki, S. Othmani, W. Cheikhrouhou-Koubaa, A. Cheikhrouhou and E. K. Hlil, Normal and inverse magnetocaloric effect and short-range ferromagnetic interaction in (Pr,Sm)0.5Sr0.5MnO3 phase separated manganite, J. Alloys Compd., 2016, 688, 1214 CrossRef.
- R. P. Borges, F. Ott, R. M. Thomas, V. Skumryev, J. M. D. Coey, J. I. Arnaudas and L. Ranno, Field-induced transition in the paramagnetic state of Sm0.65Sr0.35MnO3 associated with magnetic clusters, Phys. Rev. B: Condens. Matter Mater. Phys., 1999, 60, 12847 CrossRef.
- B. K. Banerjee, On a generalised approach to first and second order magnetic transitions, Phys. Lett., 1964, 12, 16 CrossRef.
- A. Arrott and J. E. Noakes, Approximate equation of state for nickel near its critical temperature, Phys. Rev. Lett., 1967, 19, 786 CrossRef.
- K. A. Gschneidner Jr, V. K. Pecharsky and A. O. Tsokol, Recent developments in magnetocaloric materials, Rep. Prog. Phys., 2005, 68, 1479 CrossRef.
- A. Mleiki, R. M'nassri, W. Cheikhrouhou-Koubaa, A. Cheikhrouhou and E. K. Hlil, Structural characterization, magnetic, magnetocaloric properties and critical behavior in lacunar La0.5Eu0.2Ba0.2□0.1MnO3 nanoparticles, J. Alloys Compd., 2017, 727, 1203 CrossRef.
- M. Wali, R. Skini, M. Khlifi, E. Dhahri and E. K. Hlil, A giant magnetocaloric effect with a tunable temperature transition close to room temperature in Na-deficient La0.8Na0.2−xMnO3 manganites, Dalton Trans., 2015, 44, 12796 RSC.
- H. Omrani, M. Mansouri, W. C. Koubaa, M. Koubaa and A. Cheikhrouhou, Structural, magnetic and magnetocaloric investigations in Pr0.6-xErxCa0.1Sr0.3MnO3 (0 ≤ x ≤ 0.06) manganites, J. Alloys Compd., 2016, 688, 752 CrossRef.
- S. Tarhouni, A. Mleiki, I. Chaaba, H. B. Khelifa, W. Cheikhrouhou-Koubaa, M. Koubaa and E. K. Hlil, Structural, magnetic and magnetocaloric properties of Ag-doped Pr0.5Sr0.5-xAgxMnO3 manganites (0.0 ≤ x ≤ 0.4), Ceram. Int., 2017, 43, 133 CrossRef.
- A. Ezaami, E. Sellami-Jmal, I. Chaaba, W. Cheikhrouhou-Koubaa, A. Cheikhrouhou and E. K. Hlil, Effect of elaborating method on magnetocaloric properties of La0.7Ca0.2Ba0.1MnO3 manganite, J. Alloys Compd., 2016, 685, 710 CrossRef.
- A. Ezaami, W. Cheikhrouhou-Koubaa and A. Cheikhrouhou, Improvement of magnetocaloric properties over a large temperature range in 0.5La0.7Ca0.2Sr0.1MnO3/0.5La0. 7Ca0.15Sr0.15MnO3 composite, J. Alloys Compd., 2017, 724, 851 CrossRef.
- I. Messaoui, M. Kumaresavanji, K. Riahi, W. Cheikhrouhou Koubaa, M. Koubaa and A. Cheikhrouhou, Investigation on magnetic and magnetocaloric properties in the Pb-doped manganites La0.78Ca0.22-xPbxMnO3 (x = 0, 0.05 and 0.1), J. Alloys Compd., 2017, 693, 705 CrossRef.
- V. Franco, A. Conde, J. M. Romero-Enrique and J. S. Blázquez, A universal curve for the magnetocaloric effect: an analysis based on scaling relations, J. Phys.: Condens. Matter, 2008, 20, 285207 CrossRef.
- C. Romero-Muñiz, R. Tamura, S. Tanaka and V. Franco, Applicability of scaling behavior and power laws in the analysis of the magnetocaloric effect in second-order phase transition materials, Phys. Rev. B: Condens. Matter Mater. Phys., 2016, 94, 134401 CrossRef.
- A. Biswas, S. Chandra, T. Samanta, B. Ghosh, S. Datta, M. H. Phan, A. K. Raychaudhuri, I. Das and H. Srikanth, Universality in the entropy change for the inverse magnetocaloric effect, Phys. Rev. B: Condens. Matter Mater. Phys., 2013, 87, 134420 CrossRef.
- V. Franco, A. Conde, V. K. Pecharsky and K. A. Gschneidner, Field dependence of the magnetocaloric effect in Gd and (Er1−xDyx)Al2: Does a universal curve exist?, Europhys. Lett., 2007, 79, 47009 CrossRef.
- C. M. Bonilla, J. Herrero-Albillos, F. Bartolome, L. M. Garcıa, M. Parra-Borderıas and V. Franco, Universal behavior for magnetic entropy change in magnetocaloric materials: An analysis on the nature of phase transitions, Phys. Rev. B: Condens. Matter Mater. Phys., 2010, 81, 224424 CrossRef.
- V. Franco and A. Conde, Scaling laws for the magnetocaloric effect in second order phase transitions: From physics to applications for the characterization of materials, Int. J. Refrig., 2010, 33, 465473 CrossRef.
- V. Franco, R. Cabalero-Flores, A. Conde, Q. Y. Dong and H. W. Zhang, The influence of a minority magnetic phase on the field dependence of the magnetocaloric effect, J. Magn. Magn. Mater., 2009, 321, 1115 CrossRef.
- H. Rahmouni, R. Jemai, M. Nouiri, N. Kallel, F. Rzigua, A. Selmi, K. Khirouni and S. Alaya, Admittance spectroscopy and complex impedance analysis of Ti-modified La0.7Sr0.3MnO3, J. Cryst. Growth, 2008, 310, 556 CrossRef.
- S. R. Eilliot, Temperature dependence of ac. conductivity, Philos. Mag. B, 1978, 37, 553 Search PubMed.
- G. F. Pike, Phys. Rev. B: Solid State, 1972, 6, 1572 CrossRef.
- N. F. Mott and E. A. Davis, Electronic Process in Non-Crystalline Materials, Clarendon Press, Oxford, 1979 Search PubMed.
- E. V. Gopalan, K. A. Mallini, S. Saravanan, D. S. Kumar, Y. Yoshida and M. R. Anantharaman, Evidence for polaron conduction in nanostructured manganese ferrite, J. Phys. D: Appl. Phys., 2008, 41, 185005 CrossRef.
- K. Funke, Jump relaxation in solid electrolytes, Prog. Solid State Chem., 1993, 22, 111 CrossRef.
- J. Yang, X. Rong, D. Suter and Y. P. Sun, Electron paramagnetic resonance investigation of the electron-doped manganite La1-xTexMnO3 (0.1 ≤ x ≤ 0.2), Phys. Chem. Chem. Phys., 2011, 13, 16343 RSC.
- H. Rahmouni, B. Cherif, R. Jemai, A. Dhahri and K. Khirouni, Europium substitution for lanthanum in LaBaMnO-the structural and electrical properties of La0.7-xEuxBa0.3MnO3 perovskite, J. Alloys Compd., 2017, 690, 890 CrossRef.
- H. Rahmouni, M. Smari, B. Cherif, E. Dhahri and K. Khirouni, Conduction mechanism, impedance spectroscopic investigation and dielectric behavior of La0.5Ca0.5-xAgxMnO3 manganites with the composition below the concentration limit of silver solubility in perovskites (0 ≤ x ≤ 0.2), Dalton Trans., 2015, 44, 10457 RSC.
- A. Ben Jazia Kharrat, S. Moussa, N. Moutiaa, K. Khirouni and W. Boujelben, Structural, electrical and dielectric properties of Bi-doped Pr0.8-xBixSr0.2MnO3 manganite oxides prepared by sol-gel process, J. Alloys Compd., 2017, 724, 389 CrossRef.
- J. Suchanicz, The low-frequency dielectric relaxation Na0.5Bi0.5TiO3 ceramics, Mater. Sci. Eng., 1998, 55, 114 CrossRef.
- J. Hu and H. Qin, Giant magnetoimpedance effect in La0.7Ca0.3MnO3 under low magnetic fields, J. Magn. Magn. Mater., 2001, 231, 1 CrossRef.
- S. Khadhraoui, A. Triki, S. Hcini, S. Zemni and M. Oumezzine, Variable-range-hopping conduction and dielectric relaxation in Pr0.6Sr0.4Mn0.6Ti0.4O3±δ perovskite, J. Magn. Magn. Mater., 2014, 371, 69 CrossRef.
- H. Rahmouni, A. Selmi, K. Khirouni and N. Kallel, Chromium effects on the transport properties in La0.7Sr0.3Mn1−xCrxO3, J. Alloys Compd., 2012, 533, 93 CrossRef.
- M. Smari, H. Rahmouni, N. Elghoul, I. Wallha, E. Dhahri and K. khirouni, Electric–dielectric properties and complex impedance analysis of La0.5Ca0.5−xAgxMnO3 manganites, RSC Adv., 2014, 5, 2177 RSC.
- P. S. Anantha and K. Haritharan, Structure and ionic transport studies of sodium borophosphate glassy system, Mater. Chem. Phys., 2005, 89, 428 CrossRef.
- S. Kulkarni, B. M. Nagabhushana, N. Parvatikar, A. Koppalkar, C. Shivakumara and R. Damle, Dielectric and electrical studies of Pr3+ doped nano CaSiO3 perovskite ceramics, Mater. Res. Bull., 2014, 50, 197 CrossRef.
- N. K. Singh, A. Panigrahi and R. N. P. Chaudhary, Structural and dielectric properties of Ba5EuTi3−xZrxNb7O30 relaxor ferroelectrics, Mater. Lett., 2001, 50, 1 CrossRef.
- T. Kar and R. N. P. Chaudhary, Structural, dielectric and electrical conducting properties of CsB′B′′O6 (B′=Nb, Ta; B′′=W, Mo) ceramics, Mater. Sci. Eng., 2002, 90, 224 CrossRef.
- R. W. Sillars, The properties of a dielectric containing semiconducting particles of various shapes, J. Inst. Electr. Eng., 1937, 80, 378 Search PubMed.
- N. V. Prasad, G. Prasad, T. Bhimasankaran, S. V. Suryanarayana and G. S. Kumar, Dielectric properties of cobalt doped cadmium oxalate crystals, Bull. Mater. Sci., 1996, 19, 639 CrossRef.
- C. G. Koops, On the dispersion of resistivity and dielectric constant of some semiconductors at audio frequencies, Phys. Rev., 1951, 83, 121 CrossRef.
| This journal is © The Royal Society of Chemistry 2018 |

