 Open Access Article
pH-responsive and porous vancomycin-loaded PLGA microspheres: evidence of controlled and sustained release for localized inflammation inhibition in vitro†
Xiaoling Yu‡
ac,
Qingqing Pan‡a,
Zongfu Zhengb,
Yongzhong Chen*b,
Yuyuan Chena,
Shaohuang Weng *a and
Liying Huang*a
aDepartment of Pharmaceutical Analysis, School of Pharmacy, The Higher Educational Key Laboratory for Nano Biomedical Technology of Fujian Province, Fujian Medical University, Fuzhou 350122, P. R. China. E-mail: shweng@fjmu.edu.cn; fjmuhly88@sina.com
b476 Hospital of PLA, Fuzhou 350002, P. R. China. E-mail: chenyongzhong_476@126.com
cDepartment of Pharmaceutical, Mengchao Hepatobiliary Hospital of Fujian Medical University, Fuzhou, 350025, China
First published on 7th November 2018
Abstract
Adequate delivery of antibiotics to infected sites is crucial for the effective treatment of bacterial infections. A controlled and sustained release system based on porous and pH-responsive poly(lactic-co-glycolic acid) (PLGA)–vancomycin (Van) microspheres was developed. In this system, drug release is triggered by the weakly acidic environment, like local inflamed tissues. The microspheres, developed through the W1/O/W2 double-emulsion evaporation method, comprised a PLGA-based shell and a core containing Van and the bubble-generating agent of NaHCO3. The optimized preparation conditions for PLGA–NaHCO3–Van microspheres were investigated and characterized. The PLGA–NaHCO3–Van microspheres exhibited porous microstructures with regular shape and uniform size and the characteristic of controlled drug release, which could be attributed to the incorporation of NaHCO3. The results of the Kirby–Bauer assay confirmed that released Van retained effective antibacterial activity towards standard Staphylococcus aureus and methicillin-resistant S. aureus (MRSA) infected clinical samples, suggesting their further promising application in local anti-infection.
Introduction
The controlled and sustained release of therapeutic agents in target-specific diseases or injured sites is an important research objective in the field of drug development and regenerative medicine. Inflammation can cause numerous pathological disorders, such as osteomyelitis, that consequently exacerbate the patient's suffering and hinder treatment.1,2 Some local infections, such as osteomyelitis and periprosthetic joint infection, are treated using local debridement through surgical therapy accompanied by the long-term intravenous infusion of antibiotics.3,4 However, the effects of intravenously administered antibiotics still need to be improved for inflammation. Moreover, biofilm formation may protect pathogenic bacteria against the action of systemic antibiotics.5,6 In addition, prolonged systemic antibiotic treatment requires the frequent administration of a therapeutic drug given the rapid clearance of antibiotics from the patient's system.7 Frequent antibiotic administration, however, may cause side effects, such as cytotoxicity, ototoxicity, and nephrotoxicity.8 Moreover, sub-effective antibiotic concentrations can lead to the occurrence of microbial drug resistance.9 These shortcomings motivate the development of drug delivery systems that provide a high antibiotic dosage to an infected region. Drug delivery systems should possess the property of controlled release, which is needed to achieve effective drug levels and improve treatment effect while avoiding toxic damage to healthy tissues.10–12Drug delivery systems have been constructed using various carriers, such as liposomes, hydrogels, microparticles, and nanoparticles.13–17 In controlled release drug delivery systems, one or more active ingredients play a crucial role at specific locations and period when expected. Currently, the materials used as controlled-release vectors include natural and synthetic polymers.18,19 Macromolecular materials, such as chitosan, gelatin, sodium alginate, and synthetic polymer materials, are the main materials for drug delivery systems.20 Poly(lactic-co-glycolic acid) (PLGA) has been approved as a carrier by the US Food and Drug Administration due to its biocompatibility, biodegradability, and tunable mechanical properties.21,22 The decomposed products of PLGA are lactic acid and glycolic acid, which are safe to human. PLGA-based drug delivery systems have been widely used in the microencapsulation of proteins/peptides and cancer treatment.23,24 Controlled drug delivery systems have been used to treat inflammatory diseases, such as inflammatory bowel diseases,25 airway inflammatory diseases,26 and ophthalmic inflammatory disorders.27 Controllable antibiotic-loaded PLGA delivery systems that target special infection sites with sustained property have potential applications in the treatment or prevention of local infection.28 However, systematic researches on the fabrication of PLGA-based controlled delivery systems for infection treatment remain rare. And the studies of PLGA-based controlled delivery are in high demand due to their potential applications in the treatment of local infections.
In general, drug release in PLGA-based carriers without triggering reagents is slow.29,30 Drug delivery systems for localized infection treatment should exhibit a rapid initial drug release process to achieve high drug level for the control of infection. Drug release should then stabilize in a suitable level over time to improve therapeutic effectiveness. In several inflammatory diseases, like bone tissue infections, the pH in local area may reach 5.0–5.5 (ref. 31) accompanied by accelerated glucose consumption and increased lactic acid secretion due to the infiltration and activation of inflammatory.32 By contrast, normal tissues have a physiological pH of 7.2–7.4.33 Thus, using some carriers that are sensitive to faintly acid condition may be a suitable approach for drug delivery systems for the treatment of local infection.34,35 Small alkaline molecules, such as sodium carbonate (Na2CO3), sodium bicarbonate (NaHCO3), and ammonium bicarbonate (NH4HCO3), can effectively stimulate the generation of porous structures in polymer matrices under weakly acid condition.36 However, the use of alkaline molecules as a porogen that affect the morphology and drug release of the microspheres were not systematically evaluated.
Herein, pH-responsive and porous PLGA–porogen–vancomycin (Van) microspheres were developed as a controlled and sustained release system for the selective drug delivery to the weakly acidic environment of inflamed tissues. Van is a famous and important synthetic antibiotic for the treatment of serious infections. Van was used as a model of antibiotic for the preparation of controlled and sustained microspheres in this work. The microspheres were prepared through W1/O/W2 double-emulsion evaporation method. Each microsphere has a PLGA shell and an aqueous core containing Van and NaHCO3. NaHCO3 was applied as the bubble-generating porogen in the aqueous core. In order to obtain optimal drug-loading microsphere, several preparing factors about the different porogens that affect the morphology and drug release of the microspheres were systematically evaluated. Drug release kinetics and anti-bacterial activity effects against Staphylococcus aureus and methicillin-resistant S. aureus (MRSA) of Van released from PLGA–porogen–Van microspheres prepared with different concentrations of NaHCO3 were investigated under different pH conditions and release intervals.
Experimental
Materials
Van was obtained from VIANEX S.A. (Greece). PLGA (lactic acid/glycolic acid = 75/25, Mw = 40![[thin space (1/6-em)]](https://www.rsc.org/images/entities/char_2009.gif) 000, inherent viscosity = 0.35 dl g−1) was purchased from Shandong Medical Equipment Research Institute (Jinan, China). Polyvinyl alcohol (PVA, 88% hydrolyzed), anhydrous dichloromethane (CH2Cl2), sodium chloride (NaCl), Na2CO3, NaHCO3, NH4HCO3, acetonitrile, gelatin, hydrochloric acid (HCl), disodium hydrogen phosphate (Na2HPO4·12H2O), sodium dihydrogen phosphate (NaH2PO4·12H2O) and all other reagents were of analytical reagent or chromatographic-pure grade. These reagents were obtained from Sinopharm Chemical Reagent Co., Ltd, China. All solutions were prepared with ultrapure water purified by a Milli-Q system.
000, inherent viscosity = 0.35 dl g−1) was purchased from Shandong Medical Equipment Research Institute (Jinan, China). Polyvinyl alcohol (PVA, 88% hydrolyzed), anhydrous dichloromethane (CH2Cl2), sodium chloride (NaCl), Na2CO3, NaHCO3, NH4HCO3, acetonitrile, gelatin, hydrochloric acid (HCl), disodium hydrogen phosphate (Na2HPO4·12H2O), sodium dihydrogen phosphate (NaH2PO4·12H2O) and all other reagents were of analytical reagent or chromatographic-pure grade. These reagents were obtained from Sinopharm Chemical Reagent Co., Ltd, China. All solutions were prepared with ultrapure water purified by a Milli-Q system.
Instruments
UV-vis absorption spectra were conducted on Shimadzu UV2600 spectrophotometer. Scanning electron microscope (SEM) images were obtained through Hitachi S-4800 (Japan). STARe system TGA/DSC1 thermogravimeter (NETZSCH, Germany) was used to test the mass analysis of the microspheres. Avatar 330 Fourier Transform Infrared (FT-IR) spectra (Thermo Nicolet) were applied to record the molecular vibration information.Preparation of pH-responsive and porous PLGA–porogen–Van microspheres
pH-responsive and porous microspheres were designated as PLGA–porogen–Van. When a specific reagent, such as NaHCO3, was used as a porogen, the microsphere was designated as PLGA–NaHCO3–Van.The preparing procedure of PLGA–porogen–Van microspheres was carried out according to the optimized procedure for the preparation of PLGA–Van microspheres (shown in ESI and Table S1† for details). While, the procedure of the dissolution of Van in gelatin solution for PLGA–Van microspheres was changed into the dissolution of Van in aqueous solution containing porogen for PLGA–porogen–Van microspheres. Van (10.0 mg) was dissolved in 300 μL porogen solution to form an internal aqueous phase. Then, 1.0 mL of CH2Cl2 containing 75 mg PLGA was added to the above aqueous solution of Van and porogen. And the follow-up experimental steps from the formation of W1/O emulsion were the same as the optimized condition of the preparation of PLGA–Van microspheres, which was shown detailed in ESI.†
PLGA–porogen–Van microspheres with different morphologies and pore sizes were prepared by varying either porogen types (NaCl, Na2CO3, NaHCO3, and NH4HCO3) or contents (0%, 2.5%, 5%, 7.5%, and 10%). Blank PLGA microspheres were prepared using the similar procedure described above without the addition of Van. In this work, PLGA–porogen–Van microspheres with special content porogen like the content of 5% NaHCO3 as porogen was designated as 5% PLGA–NaHCO3–Van.
Determination of Van content of PLGA–porogen–Van microspheres
The loading efficiency (LE) of Van in PLGA–porogen–Van microspheres was investigated. First, 5 mg PLGA–porogen–Van microspheres were accurately weighed and dissolved in 4 mL of CH3CN/water (5![[thin space (1/6-em)]](https://www.rsc.org/images/entities/char_2009.gif) :
:![[thin space (1/6-em)]](https://www.rsc.org/images/entities/char_2009.gif) 5, v/v). The solution was sonicated until all microspheres were dissolved and then centrifuged (4000 rpm, 5 min). Van concentration was determined by measuring the absorbance of the solution at 280 nm using a UV-vis spectrometer. The specific absorbance spectrum of Van was shown in Fig. S1 (ESI†). The absorbance of a blank PLGA microsphere in the CH3CN/water co-solvent system was measured to ensure the exclusive absorbance of Van at 280 nm. Van standards (5–200 μg mL−1 dissolved in CH3CN/water) were used for calibration. Each experiment was conducted in triplicate. The LE and encapsulation efficiency (EE) of Van were calculated using following formulas:
5, v/v). The solution was sonicated until all microspheres were dissolved and then centrifuged (4000 rpm, 5 min). Van concentration was determined by measuring the absorbance of the solution at 280 nm using a UV-vis spectrometer. The specific absorbance spectrum of Van was shown in Fig. S1 (ESI†). The absorbance of a blank PLGA microsphere in the CH3CN/water co-solvent system was measured to ensure the exclusive absorbance of Van at 280 nm. Van standards (5–200 μg mL−1 dissolved in CH3CN/water) were used for calibration. Each experiment was conducted in triplicate. The LE and encapsulation efficiency (EE) of Van were calculated using following formulas:Characterization of microspheres
After suspending an appropriate amount of microspheres in ultrapure water, mean particle sizes were measured using an optical microscope. Each measurement included 200 microspheres. The samples of three independent batches were measured in parallel. The morphological characteristics and surfaces of the microspheres were characterized with SEM. Samples for SEM were prepared by dropping and drying microsphere suspension samples on a silicon chip.Thermogravimetric measurements were conducted on a Stare system TGA/DSC1 thermogravimeter. First, 5 mg samples of freeze-dried medicated microspheres, blank microspheres, and Van were respectively loaded into aluminum pans and heated from 40 °C to 600 °C at a heating rate of 10 °C min−1 in a nitrogen atmosphere.
Releasing experiments
The release process of the medicated microspheres was investigated in releasing solution with specific pH. Medicated microspheres (10 mg) were placed in centrifuge tubes filled with 5 mL phosphate buffer solution (PBS, 10 mmol L−1) at pH 7.4 or 5.0. The release study was performed for 50 days at 37 °C in an incubator with an orbital shaker at a constant shaking rate of 100 rpm. At predetermined intervals, medicated microspheres were centrifuged at 4000 rpm for 5 minutes, and a 2 mL aliquot of the release solution was collected and replaced with same volume fresh PBS. The amount of Van released in aqueous solutions was determined through UV-vis at 280 nm. Release profiles were obtained by plotting the absorbance intensities of the release solution vs. time. All experiments were performed in triplicate, and a release curve was constructed on the basis of the average results of three parallel experiments.In vitro antibacterial activity
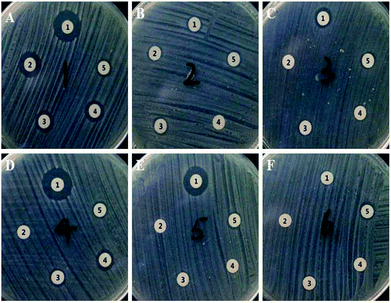
The effectiveness of the sustained drug release effect of medicated microspheres against bacteria was investigated through the Kirby–Bauer assay.37,38 The antibacterial activity of Van after at different intervals of release from 5% PLGA–NaHCO3–Van microspheres under different pH conditions was evaluated. In this work, standard S. aureus (the bacterial strain is ATCC25923) and six blood or phlegm samples from different patients infected by MRSA were used as model. The use of blood and phlegm from patients was approved by the Ethics Committee of Fujian Medical University and received the informed consent of the patients. The zones of inhibition (ZOIs) of bacterial growth on test disks were calculated as the index of Van released from the medicated microspheres. ZOI test disks were prepared using nutrient agar autoclaved at 121 °C for 2 h and then poured into 100 mm Petri dishes. The thickness of the culture medium was adjusted to 2 mm. S. aureus and 6 MRSA infecting clinical samples were respectively cultured aerobically on agar plates at 37 °C overnight. Later, all of the bacterial strains were further respectively precultured on agar plates for 18 h. Precultures were diluted with 0.9% NaCl to a concentration of approximately 108 bacteria per mL and then matched with 0.5 McIntosh turbidimetric tubes, which were previously prepared with the appropriate culture medium for each tested bacterium. Then, 350 μL of bacterial suspension was homogeneously spread with a sterile cotton swab on every agar plate. Test cement disks (Φ = 6 mm) were autoclaved at 121 °C for 2 h and then presoaked in 20 μL released sample of different intervals under pH 5.0 or 7.4. The disks were dried at 37 °C, sterilized by ultraviolet light, and gently placed on the surface of the prepared agar plate. A Sensi-Disc standard was used as a control. After 24 h of incubation at 37 °C, plates were photographed using a digital camera. Then, the diameters of the ZOIs for each sample were measured using the obtained images. The average and standard deviations of the diameters of ZOIs were calculated.Results and discussion
Formulation and characterization of pH-responsive and porous PLGA microspheres
On the basis of PLGA–Van microspheres without the addition of porogen, a single-factor experiment was performed to optimize the type and concentration of porogen for PLGA–porogen–Van microspheres. PLGA–porogen–Van microspheres were successfully manufactured using different porogens through W1/O/W2 double-emulsion solvent evaporation method, which was an effective method for microspheres.39,40 The physicochemical properties (e.g., LE, EE, and particle size) of the prepared PLGA–porogen–Van microspheres were compared and shown in Table 1. The porogen of the internal water phase (W1) was changed to none, NaCl, Na2CO3, NaHCO3, or NH4HCO3 (designated as Fa, Fb, Fc, Fd, and Fe in Table 1, respectively), whereas other process variables were kept constant. Except for the relatively small sizes of PLGA–Na2CO3–Van microspheres (Fc), PLGA–porogen–Van microspheres formulated with different porogens had similar and uniform particle sizes that ranged from 16 μm to 30 μm. Compared with other microsphere, PLGA–NaHCO3–Van microspheres (Fd) had higher LE and EE, whereas PLGA–NaCl-Van had lower LE and EE. The relatively low LE and EE of PLGA–NaCl–Van may be due to that NaCl induced relatively higher osmotic pressure in internal aqueous phase than the system of other porogens. The increased osmotic pressure made drug molecules diffuse out more apparently.41 Furthermore, the effect of the porogen concentration of the internal water phase (W1) was compared. Kept other process parameters constant, the concentrations of porogens varied in the following conditions of 2.5%, 5%, 7.5%, and 10%. As porogen concentration increased from 0% w/v (F1) to 2.5% w/v (F2, F6, F10, and F14) or 5% w/v (F3 and F11), the LE and EE of microspheres were also increased. This result could be attributed to gradual increments in the porosity and specific surface of the microspheres. These properties enhance drug loading and adsorption in the microspheres. However, excessive porogen may hinder the packing of the internal phase into microspheres, causing the drug leak out during microsphere preparation and consequently decreasing LE and EE.| Formulation ID | Porogen | Concentration (%, w/v) | LE ± SD (%) | EE ± SD (%) | Particle sizes (μm) | |
|---|---|---|---|---|---|---|
| Fa | F1 | None | 0 | 1.71 ± 0.33 | 10.34 ± 2.02 | 28.40 ± 0.59 |
| Fb | F2 | NaCl | 2.5 | 3.27 ± 0.16 | 26.71 ± 1.28 | 24.16 ± 0.68 |
| F3 | 5 | 4.41 ± 0.39 | 37.73 ± 3.3 | 29.76 ± 2.24 | ||
| F4 | 7.5 | 3.71 ± 0.16 | 31.33 ± 1.36 | 20.80 ± 0.89 | ||
| F5 | 10 | 1.86 ± 0.13 | 15.84 ± 1.15 | 21.58 ± 0.62 | ||
| Fc | F6 | Na2CO3 | 2.5 | 11.19 ± 0.10 | 95.09 ± 8.48 | 16.80 ± 0.75 |
| F7 | 5 | 9.25 ± 0.86 | 78.65 ± 7.33 | 20.45 ± 1.04 | ||
| F8 | 7.5 | 4.68 ± 0.26 | 39.60 ± 6.23 | 22.10 ± 0.69 | ||
| F9 | 10 | 5.34 ± 0.17 | 45.41 ± 1.43 | 16.80 ± 1.98 | ||
| Fd | F10 | NaHCO3 | 2.5 | 10.86 ± 1.24 | 92.86 ± 0.60 | 27.54 ± 1.76 |
| F11 | 5 | 11.50 ± 0.62 | 97.41 ± 1.30 | 27.80 ± 2.09 | ||
| F12 | 7.5 | 11.35 ± 1.66 | 97.18 ± 4.20 | 29.41 ± 1.15 | ||
| F13 | 10 | 8.52 ± 0.30 | 72.78 ± 2.55 | 26.20 ± 0.76 | ||
| Fe | F14 | NH4HCO3 | 2.5 | 9.10 ± 1.42 | 77.60 ± 12.1 | 20.14 ± 0.56 |
| F15 | 5 | 7.61 ± 0.47 | 64.90 ± 4.00 | 26.48 ± 1.32 | ||
| F16 | 7.5 | 6.77 ± 0.62 | 57.72 ± 5.29 | 27.76 ± 0.48 | ||
| F17 | 10 | 6.37 ± 0.59 | 54.23 ± 5.01 | 24.50 ± 1.85 | ||
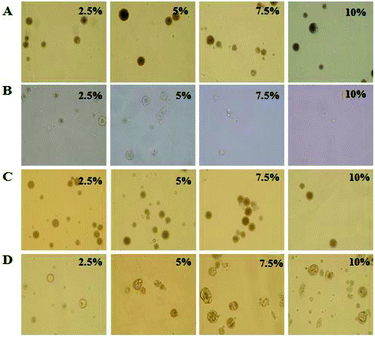
Optical microscopy images of the microspheres were shown in Fig. 1. The images indicated that the particle sizes of the microspheres have a narrow size distribution within the range of approximately 16 μm to 30 μm. When the porogen was NaCl or NaHCO3, the microspheres were spherical with regular shape and uniform size (Fig. 1A and C). Microspheres formulated with Na2CO3 as a porogen exhibited partially irregular spherical morphology (Fig. 1B). Using NH4HCO3 as a porogen, microspheres showed irregular spherical morphology with some collapsed structures (Fig. 1D). These morphological features could be attributed to the decomposition of NH4HCO3 into ammonia and CO2 during fabrication.42
NaHCO3 was identified as the optimum porogen on the basis of the LE, EE, and morphology among the four porogens. Thus, NaHCO3 was selected for the preparation of pH-responsive and porous PLGA-based microspheres for the controlled release of Van.
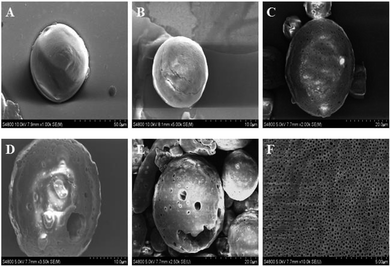
The morphology of PLGA–NaHCO3–Van microspheres was investigated through SEM, as shown in Fig. 2. Without the addition of NaHCO3 in the W1 phase, microspheres exhibited a smooth surface and compact structure with few internal pores (Fig. 2A). As shown in Fig. 2, the internal pore sizes of the microspheres increased as NaHCO3 concentrations increased from 2.5% to 10% w/v. PLGA–NaHCO3–Van microspheres prepared with 5% NaHCO3 exhibited uniform, appropriate sizes and well-distributed surface porous microstructures (Fig. 2C and F). PLGA–NaHCO3–Van microspheres prepared with other NaHCO3 concentrations presented poorly porous structures (Fig. 2B) or enlarged internal pores (Fig. 2D and E). These results suggested that an acid–base reaction could occur between partial NaHCO3 and H+ when the W1/O emulsion phase mixed with PVA solution in the W2 phase. CO2 generation during solvent evaporation and polymer solidification increased the number of internal pores. Increasing the content of NaHCO3 to 7.5% or 10% might prevent the uniform dispersion of NaHCO3 in the W1/O emulsion phase, causing NaHCO3 to concentrate in some parts. Therefore, microspheres prepared with excess NaHCO3 would develop large pores, which may cause uncontrollable drug release. Based on the above investigation, 5% NaHCO3 was identified as the optimal porogen concentration for the preparation of pH-responsive and porous PLGA–NaHCO3–Van.
Effect of NaHCO3 concentrations on drug release and release mechanism
The in vitro release profile of the PLGA–NaHCO3–Van microspheres prepared with 0% to 10% NaHCO3 was monitored in PBS with pH 5.0 or 7.4 for 50 days. In general, Van was released in an initial burst during the first day. And then, slow release of Van from PLGA–NaHCO3–Van microspheres remained in a 50 day period. 0% PLGA–NaHCO3–Van microspheres exhibited similar Van release behaviors under pH 5.0 and 7.4 (Fig. 3). Under different pH conditions, Van release exhibited an initial burst on the first day followed by a sustained release. Specifically, approximately 16.43% and 17.36% of Van was released on the first day under pH 5.0 and 7.4, respectively. Total percentages of Van released from 0% PLGA–NaHCO3–Van microspheres after 50 days in PBS (pH = 5.0 and 7.4) were only 48.54% and 53.08%, respectively. The relatively low release percentage could be attributed to the smooth surface and compact structure of the nonporous PLGA microsphere.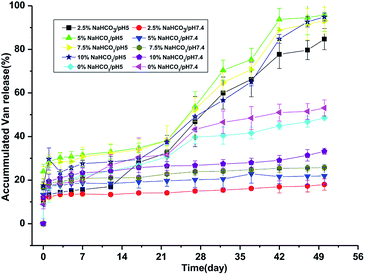 | ||
| Fig. 3 In vitro release profiles of Van from PLGA–NaHCO3–Van microspheres prepared with different NaHCO3 concentrations and incubated in PBS with pH 5.0 or 7.4 at 37 °C. | ||
The cumulative release profiles of Van from PLGA–NaHCO3–Van microspheres with different contents of NaHCO3 were further investigated (Fig. 3). Under pH 5.0, Van release slowly and stably over 21 days after the initial burst. Then, release was promoted during the 21st day to the 42nd day of the release experiment. The amount of Van released over the 50 day release experiment from PLGA–NaHCO3–Van microspheres prepared with 2.5%, 5%, 7.5%, and 10% NaHCO3 was approximately 84.73%, 95.81%, 93.22%, and 94.86%, respectively. The cumulative release profiles of Van from PLGA–NaHCO3–Van microspheres (2.5%, 5%, 7.5%, and 10%) under pH 7.4 were different from those under pH 5.0. Under pH 7.4, Van released stably and decreasingly throughout the 50 day period after the burst release at first day. And, lower amount of Van was released from PLGA–NaHCO3–Van microspheres (2.5%, 5%, 7.5%, and 10%). Approximately 30% of Van was released throughout 50 day period. This result revealed that Van was stably stored in PLGA–NaHCO3–Van under neutral pH. Under pH 7.4, microspheres fabricated with high contents of NaHCO3 released high amounts of Van. This releasing behavior could be attributed to the increased internal pore sizes of microspheres prepared with high concentrations of NaHCO3 (Fig. 2). This result suggested that suitable pore size was a critical factor for the controlled release. Conversely, except the total releasing amount of 84.75% of 2.5% PLGA–NaHCO3–Van, more than 90% of the encapsulated Van was released from PLGA–NaHCO3–Van over the 50 day process under pH 5.0. These results suggested that the release of Van from PLGA–NaHCO3–Van was triggered and controlled by pH conditions. The morphology of 5% PLGA–NaHCO3–Van microspheres after release experiment under pH 5.0 and 7.4 was also investigated through SEM. As shown in Fig. 4, SEM images indicated that microspheres were almost completely degraded under pH 5.0. While, some irregularly shaped spheres were still present after release under pH 7.4. These results suggested that the release of Van from 5% PLGA–NaHCO3–Van microspheres caused microsphere collapse, which could be ascribed to formed CO2 based on the reaction of NaHCO3 and H+ in weakly acidic media.
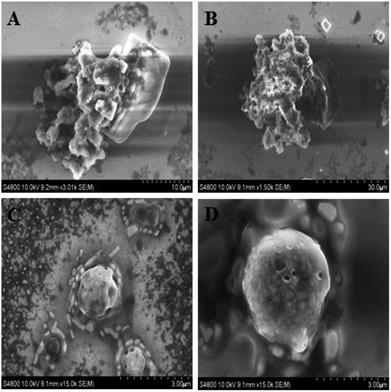 | ||
| Fig. 4 SEM images of 5% PLGA–NaHCO3–Van microspheres after 50 day release in PBS with pH 5.0 (A and B) and 7.4 (C and D). | ||
Releasing mechanism of PLGA–NaHCO3–Van microspheres
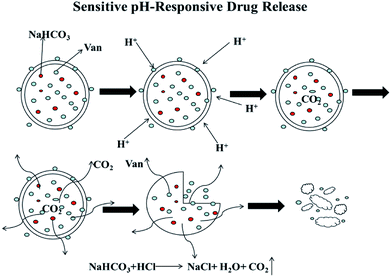
The inside of prepared PLGA–NaHCO3–Van microspheres contains NaHCO3, which is a gas-generating agent under acidic conditions. The release mechanism (Fig. 5) of PLGA–NaHCO3–Van microspheres was simulated based on the release profile shown in Fig. 3. Under weakly acidic conditions, NaHCO3 would react with external H+ to yield carbonic acid, which readily decomposes to CO2 and H2O,43 consequently increases pressure in the microsphere. The initial stage of the release of Van occurs slowly because the microspheres remain intact under gradually increased pressure. When pressure reaches a certain value, the PLGA shell is disrupted and the encapsulated Van is released. Van release is accelerated over time. Therefore, the developed PLGA–NaHCO3–Van system can act as a pH-responsive controlled release system that exhibits different releasing behavior in the different pH environments. This behavior improves the curative effect of the loaded drug while reducing the toxic risk to healthy tissues.44 In addition, the microspheres without NaHCO3 released at pH 5.0 and 7.4 more than microspheres with NaHCO3 at pH 7.4 may due to the specific binding between Van and NaHCO3 in the PLGA–NaHCO3–Van microspheres, which lead to the block of the release of Van.Characterization of 5% PLGA–NaHCO3–Van microspheres
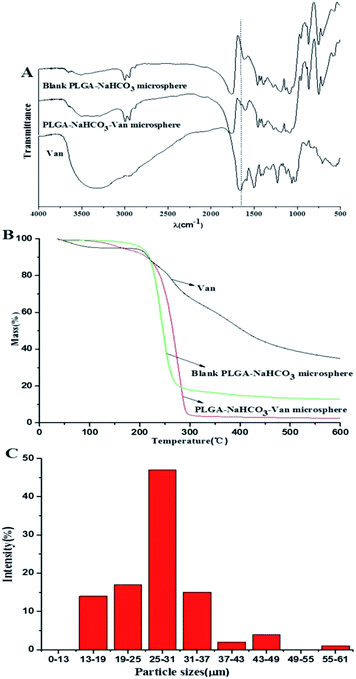
The molecular structures of PLGA–NaHCO3–Van microspheres were verified by FTIR, as shown in Fig. 6A. Characteristic peaks of –NH2 bending vibration at 1651 cm−1, C–C bending vibrations in aromatic rings at 1504 and 1587 cm−1, and C–H bending vibration at 1400 cm−1 indicated the molecular structure of Van. The spectrum of 5% PLGA–NaHCO3–Van microspheres was similar to that of blank PLGA–NaHCO3 microspheres. Both spectra exhibited bands at 3000, 1386, and 1105 cm−1 attributed to O–H, C–H, and C–O stretching vibrations, respectively. However, 5% PLGA–NaHCO3–Van microspheres exhibited a specific band at 1587 cm−1 that was assigned to C–C bending vibration of aromatic rings, which confirmed the presence of loaded Van. Furthermore, the weight ratio of loaded Van in 5% PLGA–NaHCO3–Van microspheres was investigated through thermogravimetric analysis (Fig. 6B). The main weight loss stage began from 100 °C. This stage comprised the weight-loss process of absorbed water. And the weight loss of Van was approximately 65.10% in the testing temperature. Blank PLGA–NaHCO3 microspheres exhibited main weight loss in the temperature from 140 °C to 275 °C. This weight loss was attributed to the composition of NaHCO3 and PLGA in the microspheres. The total weight loss of the blank PLGA–NaHCO3 microspheres was approximately 87.15%. By contrast, 5% PLGA–NaHCO3–Van microspheres showed approximately 98.04% weight loss throughout the whole temperature range. Compared with that of blank PLGA–NaHCO3 microspheres, the weight loss of 5% PLGA–NaHCO3–Van microspheres from 100 °C to 235 °C was more drastic, which was derived from specific binding between Van and NaHCO3 in the microspheres. Compared with the weight loss of PLGA–NaHCO3 microspheres, the 5% PLGA–NaHCO3–Van microspheres had a Van weight loss of approximately 10.89% (result from the subtraction of 98.04% and 87.15%), which was similar to the calculated LE of Van (11.50%) in 5% PLGA–NaHCO3–Van microspheres, confirming that 5% PLGA–NaHCO3–Van microspheres were successfully prepared (F11 in Table 1). The particle size distribution of 5% PLGA–NaHCO3–Van microspheres were calculated through optical microscope, as shown in Fig. 6C. It indicated that the particle sizes of the microspheres have a relatively narrow size distribution centered at 27.80 ± 2.09 μm.In vitro antibacterial activity
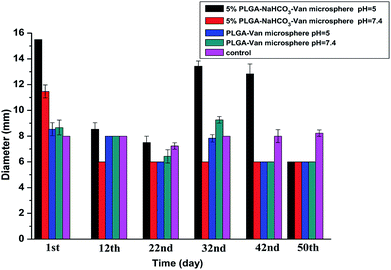
The inhibitory effects of released Van from 5% PLGA–NaHCO3–Van microspheres on standard S. aureus (Fig. 7) and MRSA (blood and sputum from six different patients, as shown in Fig. S2†) were compared with that of Van released from 0% PLGA–NaHCO3–Van microspheres. A Sensi-Disc standard loaded with an equivalent amount of 0.2 mg mL−1 Van was used as a positive control sample to ensure the accuracy of the comparison of the test cements.45 The ZOI of the positive control was applied as reference for that of the released Van from microspheres. Results showed that the diameters of ZOIs for positive control samples were 8.0 ± 0.4 mm. As shown in Fig. 7, ZOIs with different diameters were observed in S. aureus cultures incubated with released Van from 5% and 0% PLGA–NaHCO3–Van microspheres under different pH conditions at different intervals. The maximum ZOI of 15.5 ± 0.5 mm (Fig. 7A) was observed in the plate cultured with released Van from 5% PLGA–NaHCO3–Van microspheres under pH 5.0. This ZOI was larger than that observed under pH 7.4, especially during the first, 22nd, 32nd, and 42nd days of the release period, indicating the improved antibacterial activity of the released Van under pH 5.0 against S. aureus. Plates cultured with released Van from 5% PLGA–NaHCO3–Van microspheres under pH 7.4 just exhibited big ZOIs (11.4 ± 0.5 mm) on the first day due to the initial burst release. Furthermore, MRSA samples cultured with released Van from 5% PLGA–NaHCO3–Van microspheres under pH 5.0 exhibited a similar phenomenon and tendency of the inhibitory effect of S. aureus, as shown in Fig. S2.† Released Van at either pH from 0% PLGA–NaHCO3–Van microspheres showed relatively identical inhibitory area towards S. aureus and MRSA. The inhibitory area was smaller than that of the released Van from 5% PLGA–NaHCO3–Van microspheres under pH 5.0 and positive control, as shown in Fig. 7 and S2.†The ZOI diameters of Van released from 5% PLGA–NaHCO3–Van and 0% PLGA–NaHCO3–Van microspheres under different pH conditions at different release times were calculated, as shown in Fig. 8 and S3.† Compared with the result of the positive control, the ZOI diameters of released Van from 5% PLGA–NaHCO3–Van microspheres under pH 5.0 toward S. aureus and MRSA exhibited following three characteristics. (i) In the total releasing period, it showed higher values than that under pH 7.4; (ii) the variation tendency of ZOI diameters was high at first day with decreased values in the following 20 days and then increased coupled with decreasing again; (iii) all of the ZOI diameters were higher or comparable with the positive control. Correspondingly, except the high ZOI diameter due to initial burst release, released Van from 5% PLGA–NaHCO3–Van microspheres under pH 7.4 toward S. aureus and MRSA illustrated stable and small values, which was lower than that of positive control or that of released Van from 0% PLGA–NaHCO3–Van microspheres. Furthermore, ZOI diameters of released Van from 0% PLGA–NaHCO3–Van microspheres under pH 5.0 or 7.4 were relatively stable and effective values towards S. aureus and MRSA cultures in 50 day period. In addition, Van released from 5% PLGA–NaHCO3–Van microsphere under pH 5.0 retained antibacterial activity for 50 days. These phenomena confirmed that 5% PLGA–NaHCO3–Van microspheres promoted the long-term effectiveness of Van under weakly acidic condition ascribed to the controlled and sustained property. The results suggested that the microspheres can be applied as an inflammation-induced pH-responsive drug delivery system.
Conclusion
A system for the controlled and sustained release of Van was successfully developed. The system comprised pH-responsive and porous PLGA–NaHCO3–Van microspheres that formed CO2 bubbles to trigger drug release. Van and NaHCO3 can be loaded into PLGA under optimal process conditions to fabricate PLGA–NaHCO3–Van microspheres with relatively high LE and EE. Several preparing factors about the porogens that affect the morphology and drug release of the microspheres were systematically evaluated. The pH-responsive, controlled-release system answered under acidic conditions and facilitated the controlled release of Van. And Van released from the medicated microspheres under weakly acidic condition exhibited high antibacterial activity against the standard strain of S. aureus and MRSA with controlled and sustained process. These characteristics indicated that the system of PLGA–NaHCO3–Van microspheres had potential applications in the desired location of acidic and inflammatory tissues through the route of administration by local injection or implantation.Ethical statement
All experiments were performed in accordance with the Guidelines of relevant guidelines and institutional guidelines, and experiments were approved by the ethics committee at Fujian Medical university and 476 Hospital of PLA. Informed consents were obtained from human participants of this study.Conflicts of interest
There are no conflicts to declare.Acknowledgements
The authors gratefully acknowledge for financial support from the National Natural Science Foundation of China (21405016), the National Science Foundation of Fujian Province (2016I0004, 2015J01494), the Joint Funds for the innovation of science and Technology, Fujian province (2017Y9121), the Elite Cultivation Program of Health and Family Planning of Fujian Province (2017-ZQN-61).Notes and references
- A. G. Gristina, M. Oga, L. X. Webb and C. D. Hobgood, Science, 1985, 228, 990 CrossRef CAS PubMed.
- G. A. James, E. Swogger, R. Wolcott, E. D. Pulcini, P. Secor, J. Sestrich, J. W. Costerton and P. S. Stewart, Wound Repair Regen., 2007, 16, 37 CrossRef PubMed.
- N. Emanuel, Y. Rosenfeld, O. Cohen, Y. H. Applbaum, D. Segal and Y. Barenholz, J. Controlled Release, 2012, 160, 353 CrossRef CAS PubMed.
- A. F. Michael, M. C. Brian, T. O. Kamil, D. S. Bryan, R. L. Brett and J. D. V. Craig, J. Arthroplasty, 2017, 32, 2505 CrossRef PubMed.
- A. A. Mashruwala, A. van de Guchte and J. M. Boyd, eLife, 2017, 6, e23845 CrossRef PubMed.
- P. S. Stewart and J. W. Costerton, Lancet, 2001, 358, 135 CrossRef CAS.
- I. Elron-Gross, Y. Glucksam, I. E. Biton and R. Margalit, J. Controlled Release, 2009, 135, 65 CrossRef CAS PubMed.
- P. Wu and D. W. Grainger, Biomaterials, 2006, 27, 2450 CrossRef CAS PubMed.
- D. M. Aruguete, B. Kim, M. F. Hochella, Y. Ma, Y. Cheng, A. Hoegh, J. Liu and A. Pruden, Environ. Sci.: Processes Impacts, 2013, 15, 93 RSC.
- F. Valente, L. Astolfi, E. Simoni, S. Danti, V. Franceschini, M. Chicca and A. Martini, J. Drug Delivery Sci. Technol., 2017, 39, 28 CrossRef CAS.
- Y. Zhang, J. H. Zhang, M. Chen, H. Gong, S. Thamphiwatanna, L. Eckmann, W. Gao and L. F. Zhang, ACS Appl. Mater. Interfaces, 2016, 8, 18367 CrossRef CAS PubMed.
- S. K. Nandi, S. Bandyopadhyay, P. Das, I. Samanta, P. Mukherjee, S. Roy and B. Kundu, Biotechnol. Adv., 2016, 34, 1305 CrossRef CAS PubMed.
- S. Z. Vahed, R. Salehi, S. Davaran and S. Sharifi, Mater. Sci. Eng., C, 2017, 71, 1327 CrossRef PubMed.
- I. Solé, S. Vílchez, J. Miras, N. Montanya, M. J. Garciacelma and J. Esquena, Colloids Surf., A, 2017, 525, 85 CrossRef.
- G. M. Soliman, Int. J. Pharm., 2017, 523, 15 CrossRef CAS PubMed.
- T. R. Shantha, K. Soppimath and S. K. Nachaegari, Curr. Pharm. Biotechnol., 2006, 7, 261 Search PubMed.
- T. R. Hoare and D. S. Kohane, Polymer, 2008, 49, 1993 CrossRef CAS.
- D. G. Petlin, S. I. Tverdokhlebov and Y. G. Anissimov, J. Controlled Release, 2017, 266, 57 CrossRef CAS PubMed.
- A. Alenezi, Y. Naito, T. Terukina, W. Prananingrum, Y. Jinno, T. Tagami, T. Ozeki, S. Galli and R. Jimbo, J. Biomed. Mater. Res., Part B, 2018, 106, 201 CrossRef CAS PubMed.
- H. Jahangirian, E. G. Lemraski, T. J. Webster, R. Rafieemoghaddam and Y. Abdollahi, Int. J. Nanomed., 2017, 12, 2957 CrossRef CAS PubMed.
- P. J. T. Reardon, M. Parhizkar, A. H. Harker, R. J. Browning, V. Vassileva, E. Stride, R. B. Pedley, M. Edirisinghe and J. C. Knowles, Int. J. Nanomed., 2017, 12, 3913 CrossRef CAS PubMed.
- D. Encinas-Basurto, J. Ibarra, J. Juarez, M. D. Burboa, S. Barbosa, P. Taboada, R. Troncoso-Rojas and M. A. Valdez, J. Microencapsulation, 2017, 34, 231 CrossRef CAS PubMed.
- F. Wan and M. Yang, Int. J. Pharm., 2015, 498, 82 CrossRef PubMed.
- Y. H. Xu, C. S. Kim, D. M. Saylor and D. H. Koo, J. Biomed. Mater. Res., Part B, 2017, 105, 1692 CrossRef CAS PubMed.
- A. Melero, C. Draheim, S. Hansen, E. Giner, J. J. Garreras, R. Talens-Visconti, T. M. Garrigues, J. E. Peris, M. C. Recio, R. Giner and C. M. Lehr, Eur. J. Pharm. Biopharm., 2017, 119, 361 CrossRef CAS PubMed.
- D. Jeong, C. S. Kang, E. Jung, D. H. Yoo, D. Wu and D. Lee, J. Controlled Release, 2016, 233, 72 CrossRef CAS PubMed.
- J. Araujo, E. Vega, C. Lopes, M. A. Egea, M. L. Garcia and E. B. Souto, Colloids Surf., B, 2009, 72, 48 CrossRef CAS PubMed.
- F. Danhier, E. Ansorena, J. M. Silva, R. Coco, A. L. Breton and V. Preat, J. Controlled Release, 2012, 161, 505 CrossRef CAS PubMed.
- C. J. Ke, T. Y. Su, H. L. Chen, H. L. Liu, W. L. Chiang, P. C. Chu, Y. Xia and H. W. Sung, Angew. Chem., 2011, 123, 8236 CrossRef.
- K. E. Broaders, S. Grandhe and J. M. J. Frefichet, J. Am. Chem. Soc., 2011, 133, 756 CrossRef CAS PubMed.
- A. P. N. Lotito, M. N. Muscara, M. H. B. Kiss, S. A. Teixeira, G. S. Novaes, I. M. Laurindo, C. A. Silva and S. B. Mello, J. Rheumatol., 2004, 31, 992 CAS.
- K. Rajamäki, T. Nordstrom, K. Nurmi, K. E. O. Åkerman, P. T. Kovanen, K. Öörni and K. K. Eklund, J. Biol. Chem., 2013, 288, 13410 CrossRef PubMed.
- V. Estrella, T. A. Chen, M. Lloyd, J. Wojtkowiak, H. H. Cornnell, A. Ibrahim-Hashim, K. Bailey, Y. Balagurunathan, J. M. Rothberg, B. F. Sloane, J. Johnson, R. A. Gatenby and R. J. Gilies, Cancer Res., 2013, 73, 1524 CrossRef CAS PubMed.
- F. J. Huang, W. C. Liao, Y. S. Sohn, R. Nechushtai, C. H. Lu and I. Willner, J. Am. Chem. Soc., 2016, 138, 8936 CrossRef CAS PubMed.
- W. C. Liao, S. Lilienthal, J. S. Kahn, M. Riutin, Y. S. Sohn, R. Nechushtai and I. Willner, Chem. Sci., 2017, 8, 3362 RSC.
- M. F. Chung, W. T. Chia, H. Y. Liu, C. W. Hsiao, H. C. Hsiao, C. M. Yang and H. W. Sung, Adv. Healthcare Mater., 2014, 3, 18541 Search PubMed.
- J. J. Xue, M. He, H. Liu, Y. Z. Niu, A. Crawford, P. D. Coates, D. F. Chen, R. Shi and L. Q. Zhang, Biomaterials, 2014, 35, 9395 CrossRef CAS PubMed.
- Q. Q. Pan, N. Li, Y. Hong, H. Tang, Z. F. Zheng, S. H. Weng, Y. J. Zheng and L. Y. Huang, RSC Adv., 2017, 7, 21352 RSC.
- J. J. Blaker, J. C. Knowles and R. M. Day, Acta Biomater., 2008, 4, 264 CrossRef CAS PubMed.
- C. Sturesson and J. Carlfors, J. Controlled Release, 2000, 67, 171 CrossRef CAS PubMed.
- F. Qi, J. Wu, Q. Z. Fan, F. He, G. F. Tian, T. Y. Yang, G. H. Ma and Z. G. Su, Colloids Surf., B, 2013, 112, 492 CrossRef CAS PubMed.
- M. J. Kwon, J. H. Bae and J. J. Kim, Int. J. Pharm., 2007, 333, 5 CrossRef CAS PubMed.
- C. J. Ke, W. L. Chiang, Z. X. Liao, H. L. Chen, P. S. Lai, J. S. Sun and H. W. Sung, Biomaterials, 2013, 34, 1 CrossRef CAS PubMed.
- Y. Suzuki, M. Tanihara, Y. Nishimura, K. Suzuki, Y. Kakimaru and Y. Shimizu, J. Biomed. Mater. Res., 1998, 42, 112 CrossRef CAS PubMed.
- J. S. Moskowitz, M. R. Blaisse, R. E. Samuel, H. P. Hsu, H. Mitchel, S. Martin, J. Lee, M. Spector and P. Hammond, Biomaterials, 2010, 31, 6019 CrossRef CAS PubMed.
Footnotes |
| † Electronic supplementary information (ESI) available: UV-vis spectrum of Van, the preparation of PLGA–Van microspheres and figures of the antibacterial results of MRSA infecting clinical samples treated with released Van from 5% PLGA–NaHCO3–Van microspheres. See DOI: 10.1039/c8ra06659k |
| ‡ Yu and Pan contributed equally to this work. |
| This journal is © The Royal Society of Chemistry 2018 |


