 Open Access Article
Zipping assembly of an Fe3O4/carbon nanosheet composite as a high-performance supercapacitor electrode material
Jihui Li ,
Kang Sun*,
Changyu Leng
 and
Jianchun Jiang
Institute of Chemical Industry of Forest Products, CAF, National Engineering Lab for Biomass Chemical Utilization, Key and Open Lab on Forest Chemical Engineering, SFA, Nanjing 210042, China. E-mail: sunkang0226@163.com
First published on 7th November 2018
Abstract
Reasonable structure design and component selection are crucial to electrochemical performance of supercapacitor electrode materials. Sodium alginate (SA), with a novel structure which can immobilize multivalent metal cations, was used to coordinate with Fe3+ to fabricate a carbon and Fe3O4 composite by an easy sol–gel method. Due to the chelation effect between SA and Fe3+, the carbon composite was constructed into a two-dimensional sheet-like structure, and the Fe3O4 particles were nanosize and homogenously distributed on the surface of the carbon nanosheet. As an electrode material for supercapacitors, the composite electrode showed a high specific capacitance of 550 F g−1 at 1 A g−1 in the potential range from −1.1 to 0 V, and excellent cycling stability of 89% retention after 2000 cycles. The enhanced electrochemical performance could be attributed to the abundant exposed active sites, producing high pseudocapacitance, to the two-dimensional nanosheet structure, facilitating electrolyte transport and to the strong attachment strength, improving cycle life. This environmentally-friendly design can provide an alternative to existing methods, resulting in the development of a two-dimensional carbon/metal oxide composite for energy storage devices.
Introduction
Novel energy storage sources are urgently needed. Numerous efforts have been made towards the development of energy storage and conversion devices such as lithium-ion batteries, fuel cells and supercapacitors. Among all kinds of energy storage and conversion devices, supercapacitors with fast charge/discharge rates, high power density and long cycle life are needed for consumer electronics, energy management, hybrid vehicles and large aircraft.1–3 Energy storage mechanisms of electrode materials can be classified either as electro-double layer capacitors (EDLC) or as pseudo-capacitors. The capacitance of the former results from the electro-double layer that surrounds the electrode surface, which enables the EDLC to display high power density and stability, owing to the non-faradic process. Pseudo-capacitance can be attributed to the fast-redox reaction that occurs between the electrode and electrolyte.4,5Carbonaceous materials are completely used materials for electrodes because they have various morphologies, excellent electronic conductivity and physicochemical stability.6–8 Unfortunately, the ability to store energy is far less than batteries. Extensive strategies have been devised to enhance the electrochemical performance of carbonaceous materials with respect to specific areas and surface properties. However, the limited area specific capacitance of 15–50 mF cm−2 is not enough for high energy applications.9,10
Transitional metal oxides are another common electrode material. Contrary to carbonaceous materials, their capacitance results from a faradic process which enables the storage of higher energy than carbon-based electrode materials. As an example, RuO has been shown to be an ideal electrode material because of its high energy density and excellent conductivity.11,12 However, the high price of electrode made of RuO is a barrier to their commercialization. Other transitional metals, such as Mn, Co, Ni and Fe have also been employed as electrode materials.13–16 Iron oxides are found to be a promising material for supercapacitor electrode due to its high theoretical capacitance, wide operating potential window, low cost and natural abundance.17–21 However, there are still several defects that can't be ignored for practical application, which are poor electric conductivity, physiochemical strain and deficient electron transfer. Though efforts have been made towards improving the above shortcomings in terms of surface morphology, surface area, and crystallinity particle distribution, the problems mentioned above are still not well solved, resulting in unsatisfied electrochemical performance.22–27
To address problems of both iron oxide and carbonaceous materials for electrode systems, a possible strategy is to combine them, making a hybrid structure. In such a hybrid composites, iron oxides can provide energy density by reversible fast faradic redox processes, where the carbonaceous materials serve as substrate for supporting iron oxides, with their porous structure providing channels for charges transporting. In addition, power density and rate ability, typical in large current density systems, in which iron oxides are at a disadvantage, can benefit from higher electronic conductivity of carbonaceous materials. Carbon materials and iron oxide hybrids, which integrate the advantages and mitigates the demerits of both constituent, can produce a synergetic effect. Conventional methods used to fabricate hybrid composites include hydrothermal decomposition, thermal decomposition, chemical precipitation and co-precipitation. Most methods used to deposit iron oxides on carbon supports don't result in the deposition of well-anchored particles, which results in agglomeration, leaching and coarsening of particles during supercapacitors operation. Lots of work have been done to deal with the problem. A binary composite with well dispersed Fe3O4 inserted on the surface of carbon nanotube, by using the hydrothermal method, was accomplished; high specific capacitance and excellent cycling stability compared with pure Fe3O4 were reported.28 Electrophoretic deposition was used to synthesize reduced graphene oxide-Fe3O4 (RGO-Fe3O4) nanocomposite, a system where Fe3O4 nanoparticles with 20–50 nm in diameter were uniformly formed on the surface of RGO; high specific capacitance of 236 F g−1 was obtained at 1 A g−1, retaining 97% of the initial capacitance after 500 cycles was reported.29 Conventional methods to fabricate iron oxides/carbon composites were based on the already formed carbonaceous materials, followed by additional in situ growth or deposition of iron oxides. In such processes, carbon bulks, formed prior to metal particles, restricts solid attachment between two species, leading to poor durability, which is caused by the agglomeration of iron oxides nanoparticles during charging–discharging processes. Recently, there have been some reports of successfully synthesis composites with desired attribute, however most methods are complex synthesis and expensive.29,30 Therefore, a practical method to fabricate a composite with reasonable nanostructure and strong connection between carbonaceous materials and iron oxides is desirable.
In this paper, a two-dimensional Fe3O4/carbon nanosheet composite with a novel zipping assembly method was designed and fabricated. Sodium alginate (SA), a nature polysaccharide extracted from brown algae, was selected as the carbon precursor.31,32 The multivalent ferrous ions can coordinate with specific oxygen groups of SA and be confined within an “egg-box” structure;31 iron oxides can be, therefore, restrained in small size and provide sufficient active sits. SA were constructed into two-dimensional carbon nanosheets through a zipping process, and Fe3O4 nanoparticles were homogenously anchored on the surface. The obtained nanocomposite as supercapacitor electrode material exhibited a high performance of 550 F g−1 at 1 A g−1 and a stable cycling performance of 89% capacitance retention after 2000 cycles, making it a promising material for further application as energy storage devices.
Experimental
Material synthesis
In a typical synthesis process of SA/Fe3O4 composite, a 2 wt% aqueous solution of sodium alginate (SA, (C6H7O6Na)n, viscosity 200 ± 20 mPa s, Aladdin, CAS: 9005-38-3) was vigorously stirred at room temperature for about 3 h. Subsequently, excessive 2 wt% FeCl3 solution was added under continuous stirring. Numerous flocculent insoluble hydrogels were immediately obtained. After stirring for 3 h, the obtained gels were collected by vacuum filtration, washed with distilled water and absolute ethanol and dried at 60 °C in vacuum for 10 h. Subsequently the dried gels were carbonized in a tubular furnace under an argon flow of 100 mL min−1 at 600 °C for 2 h. As controls, the same procedure was repeated solely with SA.Characterization
Fourier transform infrared spectroscopy (FT-IR, Nicolet iS10) was used to determine the functional group of the samples. Thermos gravimetric-mass spectrometry (TG-MS, QMS 403 C Aëolos®) was performed at a heating rate of 10 °C min−1 under an argon flow to determine the pyrolysis temperature and the possible reaction of ferric ions in the process of carbonization. Raman spectra was recorded on a DXR Raman spectrometer. The nanostructure of the composite was identified by scanning electron microscopy (SEM, SU8010) and high-resolution transmission electron microscope (HRTEM, JEOL JEM-2100F). The crystalline phase of the samples was examined by X-ray diffraction (XRD, D8D-Focus). X-ray photoelectron spectroscopy (XPS, AXIS-UltraDLD) measurements were carried out to analysis the surface atomic content.Electrochemical measurements
Electrochemical testing was conducted in a typical three-electrode system with a Pt wire as counter electrode and a Hg/HgO reference electrode in 6 M KOH electrolyte. The overall electrochemical measurements were conducted on an electrochemical station (VMP3, Bio-Logic). The well mixed slurry containing 10 wt% polytetrafluoroethylene (PTFE), 10 wt% acetylene black and 80 wt% samples powders was pressed on a stainless steel 10 MPa for 1 min. The thickness of electrode material was 100 μm, the electrode area was 1 cm2, and the mass loadings of active materials were around 4 mg. The voltage window for aqueous electrolyte was set to be −1.2 to 0 V. The galvanostatic charge–discharge curves were performed under a current density range from 1 to 5 A g−1. The scan rate was in the range of 5 to 50 mV s−1. Electrochemical impedance spectroscope was collected with frequencies ranging from 100 kHz to 10 mHz.Results and discussion
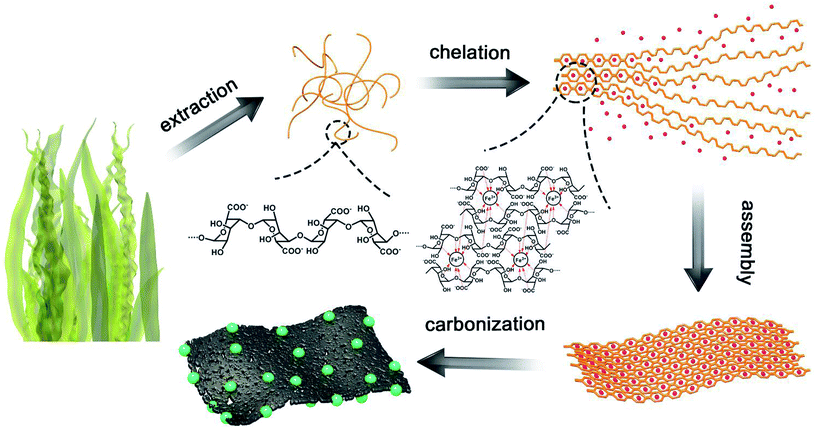
The process of the synthesis of SA/Fe3O4 is shown in Fig. 1. The central synthesis is based on the novel zipping assembly process. After the exchange reaction between ferric ions and SA's sodium ions, Fe3+ was chelated by the oxygen functional groups of G-blocks and trapped in the gel structure; fibrous SA molecules consequently cohered into two-dimensional sheet-like structures. After gelation, the displaced sodium ions and excessive chloride ions were removed by distilled water and absolute ethanol. During the pyrolysis step, Fe3+ combined with functional oxygen groups and formed Fe3O4 nanoparticles. Because of the effect of chelation between Fe3+ and SA, ferric ions were immobilized in a constant position of the nanostructure, which prevented ferric ions from agglomerating during the Fe3O4 formation process, leading to homogeneous dispersion of Fe3O4 nanoparticles. The effect of chelation reinforced the attachment among macromolecule chains of fibrous SA, and generated inflexible gel straps and two-dimensional sheet like structure after carbonization.SA reduced the production of small size Fe3O4 nanoparticles; chains-like macromolecules were interweaved into a two-dimensional nanosheet, avoiding particles agglomeration. Besides, most reported fabrication methods of the hybrid composite, two species were not formed simultaneously, couldn't form the tight attachment, which hampered its electrochemical performance to some extent. In this fabrication processes, iron oxides were well immersed in SA molecular structure, and resulted in a delicate combination. The two-dimensional sheet-like nanostructure of SA can facilitate unimpeded ions transferring, enabling Fe3O4 nanoparticles to contain sufficient active sites for faradic redox reactions. The fabrication process, with no dispersing agents, is environment friendly, the non-templated synthesis method can economically be deployed at large scale.
Fig. 2a shows the IR spectra of SA and SA/Fe3O4 before heating treatment. In the curve of SA, the vibrational bands at 3300, 1579 and 1027 cm−1 are assigned to –OH, –COOH and C–O–C stretching vibration respectively. For the SA/Fe3O4, the –OH stretching vibration at 3300 cm−1 becomes sharper, and C–O–C stretching vibration becomes weaker. The result reveals the chelating reaction between Fe3+ and –OH, which limited the C–O–C stretching vibration simultaneously. The peak for the –COOH stretching vibration of SA/Fe3O4 moves to 1578 cm−1, which is caused by a valent bonding between Fe3+ and sodium alginate from another plane. The result also demonstrates the formation of the two-dimensional structure.
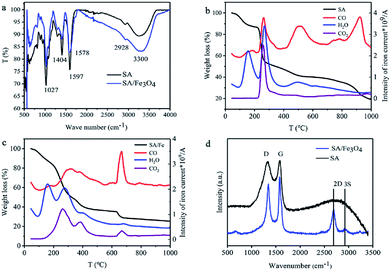 | ||
| Fig. 2 FT-IR spectra (a) of SA and SA/Fe3O4, TG-MS spectra of SA (b) and SA/Fe3O4 sample (c), Raman spectrum (d) of SA and SA/Fe3O4 sample. | ||
Thermogravimetric-mass spectrometry (TG-MS) was used to demonstrate the process of the formation of both carbon nanosheets and Fe3O4. To further evaluate the impact of Fe3+ addition to in the process of carbonization, pure SA was used as the control. As shown in Fig. 2b, weight-loss at different temperature follows the evolution of volatile compounds. Weight loss below 200 °C is mainly ascribed to the evolution of absorbed water. For the SA sample, at the temperature range between 200 °C to 300 °C, a sharp weight loss is related to release of H2O, CO2 and CO, which can be attributed to dehydration and decarboxylation of the sample. The temperature between 400 °C to 600 °C is the degradation of the polymer. Most cellulose derived materials decompose in the narrow temperature range of 300 to 350 °C, resulting in low oxygen content.33,34 SA presented completely different thermal behaviour than that of cellulose, decomposing at the temperature higher than 1000 °C. A certain amount of CO volatilized at 900 °C, indicating oxygen stability, which is important for in situ immobilization of Fe3+, preventing Fe3O4 nanoparticles from agglomeration at high temperatures. The temperature stability of SA is an important factor for its selection as a carbon substrate. Fig. 2c presents the thermal stability of SA/Fe3O4 sample. The two periods of the degradation of the polymer are ahead in the SA/Fe3O4 sample, which can be attributed to the function of ferric ions. Owing to the reaction between Fe3+ and oxygen groups, Fe3+ were transferred into Fe3O4 nanoparticles. The last range oxygen evolution in forms of CO appeared at 650 °C to 700 °C. To maximize the oxygen group content, which is important for electrochemical performance in terms of both wettability and pseudo-capacitance, SA/Fe3O4 composite were prepared at 600 °C. Fig. 2d presents the Raman spectrum of SA and SA/Fe3O4 samples. The typical D and G bands are corresponding to disordered carbon and sp2 hybridized carbon, respectively.34,35 The intensity ratio of D/G reflects the degree of graphitization, and the higher value of SA (∼0.99) in comparison to SA/Fe3O4 (∼0.87) indicates a relative high graphitic structure of the composite because of the catalytic effect of Fe3O4.36 2D and 3S peaks reveal the presence of tremendous disorder in the samples. The intensity ratio of 3S/2D in SA/Fe3O4 decreases significantly compared with SA, indicating a reduced defects concentration, which could be resulted from the particular two-dimensional structure, leading to higher electron mobility and excellent conductivity.21
XRD was performed to determine the crystalline structure and composition of SA/Fe3O4 nanocomposites. As shown in Fig. 3a, diffraction peaks at 30.10°, 35.45°, 37.1°, 42.9°, 56.98° and 62.75° correspond to the reflection planes of (220), (311), (440), (422), (511) and (400), respectively, indicating that Fe3+ was transferred into either Fe3O4 or γ-Fe2O3 as both contain the inverse spine structure and can have similar detectable XRD patterns at nanoscale.35 XPS was further employed to characterize the oxidation particles. Fig. 3b shows the X-ray photoelectron spectra (XPS) in the Fe 2p region for the SA/Fe3O4 composite. The Fe 2p core-level spectrum exhibits two characteristic peaks located at 711.1 eV and 724.8 eV corresponding to Fe 2p3/2 and Fe 2p1/2 of Fe3O4.37 Moreover, the absence of satellite peak at 718.0 eV further substantiate that the crystalline phases of iron oxides are not γ-Fe2O3.38 Fe3O4 is a mixed valence compound and often be expressed to FeO·Fe2O3, so the Fe2+![[thin space (1/6-em)]](https://www.rsc.org/images/entities/char_2009.gif) :
:![[thin space (1/6-em)]](https://www.rsc.org/images/entities/char_2009.gif) Fe3+ ratio should be 1
Fe3+ ratio should be 1![[thin space (1/6-em)]](https://www.rsc.org/images/entities/char_2009.gif) :
:![[thin space (1/6-em)]](https://www.rsc.org/images/entities/char_2009.gif) 2. The result of Fe2+
2. The result of Fe2+![[thin space (1/6-em)]](https://www.rsc.org/images/entities/char_2009.gif) :
:![[thin space (1/6-em)]](https://www.rsc.org/images/entities/char_2009.gif) Fe3+ ratio was 1
Fe3+ ratio was 1![[thin space (1/6-em)]](https://www.rsc.org/images/entities/char_2009.gif) :
:![[thin space (1/6-em)]](https://www.rsc.org/images/entities/char_2009.gif) 2.03 in the Fe 2p3/2, which was basically agree with the predicted value. Fig. 3c presents C 1s spectrum of SA/Fe3O4 composite; the deconvoluted peak at 285 eV can be attributed to C–C and C
2.03 in the Fe 2p3/2, which was basically agree with the predicted value. Fig. 3c presents C 1s spectrum of SA/Fe3O4 composite; the deconvoluted peak at 285 eV can be attributed to C–C and C![[double bond, length as m-dash]](https://www.rsc.org/images/entities/char_e001.gif) C bonds, and other broad and weak peaks at 286.4 eV and 289.5 eV are related to C–O and O–C
C bonds, and other broad and weak peaks at 286.4 eV and 289.5 eV are related to C–O and O–C![[double bond, length as m-dash]](https://www.rsc.org/images/entities/char_e001.gif) O bonds, respectively.19,39 O 1s spectrum is presented in Fig. 3d. There are only Fe3O4 peak and carbon oxygen groups, indicating pure crystalline phase of FeO, which is agreeing well with XRD result.40
O bonds, respectively.19,39 O 1s spectrum is presented in Fig. 3d. There are only Fe3O4 peak and carbon oxygen groups, indicating pure crystalline phase of FeO, which is agreeing well with XRD result.40
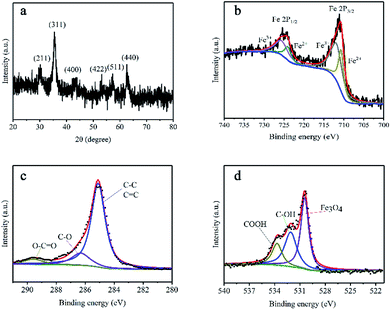 | ||
| Fig. 3 (a) XRD pattern of SA/Fe3O4 sample. (b–d) Fe 2p, C 1s and O 1s XPS core-level spectra of SA/Fe3O4 sample. | ||
The morphology of the composite was characterized by SEM and TEM. Fig. 4a shows SEM image of pure SA, amorphous carbon blocks with various size can be observed. Owing to the one-step carbonization method without any activating process, it can be observed that the surface of the carbon blocks is extremely smooth, indicating that the SA derived carbon material would not contain sufficient area to generate capacitance. As shown in Fig. 4b and c, SA/Fe3O4 composite presents a two-dimensional nanosheet nanostructure with nanosized thickness, which is totally different from the pure SA. Loose feature can be attributed to the composite's contract caused by pyrolysis at high temperature. From the TEM image (Fig. 4d), a large amount of Fe3O4 nanoparticles of 5 to 10 nm are homogeneously distributed in the nanosheet. The cohesive fibrous structure at the edge of the composite can be observed at a high magnification, which further confirmed the synthetic process mentioned before. HRTEM image of the sample is shown in Fig. 4f; the lattice fringe spacing was measured to be 0.25 nm, which corresponded to the (311) d-spacing of Fe3O4 species, agreeing with the XRD and XPS results.41
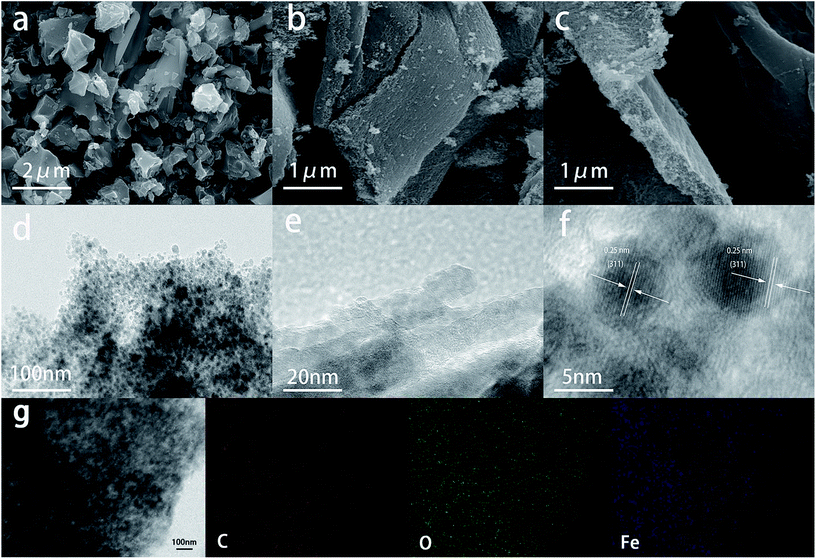 | ||
| Fig. 4 SEM images of SA sample (a) and SA/Fe3O4 composite (b and c). (d–f) TEM, HRTEM and EDX mapping images of SA/Fe3O4 sample (g). | ||
The chemical composition of the composite was further determined by EDX mapping (Fig. 4e), illustrating the homogeneous distribution of Fe, O and C and convincing the delicate integration of both materials. These results showed that Fe3O4 nanoparticles were separated by carbon materials without any agglomeration. SA molecules were templated into two-dimensional architecture by chelation with Fe3+. Accordingly, iron atoms were anchored on the carbon nanosheets at an atomic scale and Fe3O4 nanoparticles were well integrated into the carbon nanosheets. The two-dimensional structure could expose tremendous active sits of Fe3O4 to generate high specific capacitance, and seamless connection could effectively prevent Fe3O4 nanoparticles from leakage during the charging and discharging process, resulting in stable electrochemical performance.
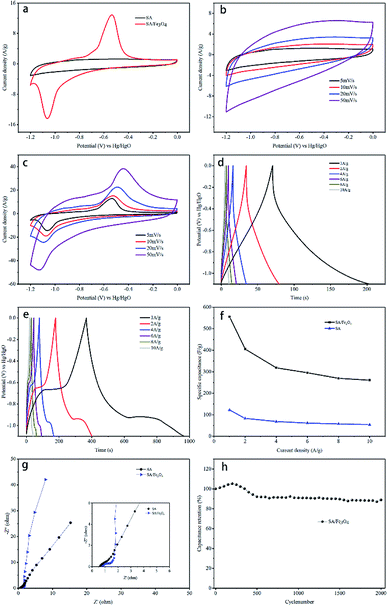
The capacitive performance of SA and SA/Fe3O4 composite were evaluated by cyclic voltammetry (CV), galvanostatic charge/discharge (GCD) and electrochemical impedance spectroscopy (EIS) measurements in 6 M KOH aqueous electrolyte. Fig. 5a shows typical CV curves of SA and SA/Fe3O4 composite samples at a scan rate of 5 mV s−1. The SA sample presents a quasi-rectangular CV curve, which can be ascribed to EDLC. Different from the pure carbon material, two redox peaks are identified at the potential of approximately −0.5 V and −1.1 V, implying the presence of pseudocapacitive materials. The pair of cathodic and anodic peaks corresponded well with the reversible reaction between Fe3+ and Fe2+.42 Furthermore, owing to the fact that the area of CV curves is proportional to specific capacitance, the specific capacitance of SA/Fe3O4 composite was higher than that of pure SA derived carbon materials.43 CV curves of SA at different scan rate are presented in Fig. 5b. With increasing scan rates, the shapes of CV curves also gradually changed. Notably, the shape of curve became almost a declining rectangular when scan rate reached 50 mV s−1. CV curves of SA/Fe3O4 sample, at a range of scan rate from 5 to 50 mV s−1, are shown in Fig. 5c. The CV curves retained similar shapes at different scan rates, which indicated fast charge transfer kinetics, owing to novel two-dimensional sheet-like structure.
Galvanostatic charge/discharge (GCD) measurements were also conducted at current densities from 1 A g−1 to 10 A g−1. GCD curves of SA and SA/Fe3O4 samples are represented in Fig. 5d and e. The discharging time is directly related to the specific capacitance at the same current density. The discharging time of SA/Fe3O4 sample, is longer than that of SA, indicating higher specific capacitance of SA/Fe3O4 and agreeing with the results of CV curves. The specific capacitances were calculated by GCD curves in the potential range of −1.1 V to 0 V at various current density, according to the following equation:
Electrochemical impedance spectroscope (EIS) was performed at room temperature on SA and SA/Fe3O4 composite to obtain information of charge-transfer resistance. The resulting Nyquist plot is shown in Fig. 5g, where an arc is observed in high frequency region while an inclined line is seen in low frequency region. The intersection of the Nyquist plot at high frequency on the real axis represents the equivalent series resistance (ESR), which is related to the electrolyte solution resistance, the intrinsic resistance of active material and the contact resistance at the electrode–electrolyte interface. The arc is usually attributed to charge transfer resistance, whose value is associated with the diameter of the semi-circle. The inclined part in the low frequency represents the ion diffusion in the electrode pores.44 It is observed that SA/Fe3O4 sample shows a more distinct semi-circle in high frequency, implying a higher charge transfer resistance developed at the interface of electrode and electrolyte. This result can be attributed to the introducing of Fe3O4 with low electric conductivity. However, SA/Fe3O4 composite shows a relatively higher phase angle in low frequency region, indicating a smaller ion diffusion resistance. These results clearly indicate that the introducing of Fe3O4 nanoparticles hampers the conductivity of the carbon frame to some extent, but the transformation in architecture enormously enhances its electrochemical performance with regards to specific capacitance, rate ability and cycling performance.
Cycling performance is a vital parameter in order to evaluate the practical application of SA/Fe3O4 as electrode material. An endurance test was conducted at 2 A g−1 and presented in Fig. 5h. The SA/Fe3O4 composite could retain 89% of its initial capacitance after 2000 cycles, indicating a good cycling stability. It is well known that most metal oxides/carbon composite lack mechanical expansion performance during ion insertion and desertion processes, resulting in poor stability during long cycle test. Thus, the excellent cycling stability of SA/Fe3O4 system illustrates superiority of the unique structure compared with other architectures synthesized by conventional methods.
In all, the attractive electrochemical performance of SA/Fe3O4 of large specific capacitance, notable rate performance and excellent cycling performance is ascribed to the novel structure that Fe3O4 particles with nanosized provide numerous active sites to store energy, while the constructed carbon nanosheet considerably promoted the diffusion of electrolyte ions.
Conclusion
A two-dimensional SA/Fe3O4 composite was synthesized through a simple method with SA and FeCl3·6H2O as precursors. As a kind of marine resources with abundant reserve, SA possess a unique structure which can coordinate with Fe3+ to produce a novel nanocomposite with Fe3O4 nanoparticles uniformly anchored on the surface of carbon nanosheets with strong attachment strength. Thus supercapacitor electrode material showed a high specific capacitance of 550 F g−1 at 1 A g−1 in 6 M KOH electrolyte, and 86% specific capacitance retention rate after 2000 cycles. The enhanced performance was attributed to the self-assembly two-dimensional architecture that provided numerous active sites increasing its pseudocapacitive properties, open scaffold facilitating ion accessibility and firm attachment between two species for cycle stability. Fe3O4 is relatively inexpensive, in pact cheaper than other transitional metal, such as Mn, Co, Ni, while SA is derived from abundant marine resources. The simple sol–gel method is scalable. The novel structure and the simple fabrication method described in this work provides a promising avenue for further application in supercapacitor electrode materials.Conflicts of interest
There are no conflicts to declare.Acknowledgements
This research is financially supported by the National Natural Science Foundation (31770629).Notes and references
- L. L. Zhang and X. S. Zhao, Chem. Soc. Rev., 2009, 38, 2520 RSC.
- P. Simon and Y. Gogotsi, Nat. Mater., 2008, 7, 845–854 CrossRef CAS PubMed.
- J. R. Miller and P. Simon, Science, 2008, 321, 651–652 CrossRef CAS PubMed.
- H. Jiang, P. S. Lee and C. Li, Energy Environ. Sci., 2012, 6, 41–53 RSC.
- Q. Lu and P. J. Q. Xiao, Angew. Chem., 2013, 52, 1882 CrossRef CAS PubMed.
- Y. Zhu, S. Murali, M. D. Stoller, K. J. Ganesh, W. Cai, P. J. Ferreira, A. Pirkle, R. M. Wallace, K. A. Cychosz and M. Thommes, Science, 2011, 332, 1537 CrossRef CAS PubMed.
- D. N. Futaba, K. Hata, T. Yamada, T. Hiraoka, Y. Hayamizu, Y. Kakudate, O. Tanaike, H. Hatori, M. Yumura and S. Iijima, Nat. Mater., 2006, 5, 987–994 CrossRef CAS PubMed.
- Z. L. Xie, R. J. White, J. Weber, A. Taubert and M. M. Titirici, J. Mater. Chem., 2011, 21, 7434–7442 RSC.
- M. D. Stoller, C. W. Magnuson, Y. Zhu, S. Murali, W. S. Ji, R. Piner and R. S. Ruoff, Energy Environ. Sci., 2011, 4, 4685–4689 RSC.
- E. Frackowiak and F. Béguin, Carbon, 2001, 39, 937–950 CrossRef CAS.
- P. Wang, H. Liu, Q. Tan and J. Yang, RSC Adv., 2014, 4, 42839–42845 RSC.
- Q. Qu, S. Yang and X. Feng, Adv. Mater., 2011, 23, 5574 CrossRef CAS PubMed.
- M. Huang, F. Li, F. Dong, Y. X. Zhang and L. L. Zhang, J. Mater. Chem. A, 2015, 3, 21380–21423 RSC.
- G. Wang, L. Zhang and J. Zhang, Chem. Soc. Rev., 2012, 43, 797–828 RSC.
- C. Feng, J. Zhang, Y. He, Z. Cheng, W. Hu, L. Liu and Y. Deng, ACS Nano, 2015, 9, 1730 CrossRef CAS PubMed.
- M. Wang, Z. Li, C. Wang, R. Zhao, C. Li, D. Guo, L. Zhang and L. Yin, Adv. Funct. Mater., 2017, 27, 1701014 CrossRef.
- J. Sun, Y. Huang, C. Fu, Y. Huang, M. Zhu, X. M. Tao, C. Zhi and H. Hu, J. Mater. Chem. A, 2016, 4, 14877–14883 RSC.
- V. D. Nithya and N. S. Arul, J. Mater. Chem. A, 2016, 4, 2643–2646 RSC.
- C. Fu, A. Mahadevegowda and P. S. Grant, J. Mater. Chem. A, 2015, 3, 14245–14253 RSC.
- S. L. You, C. W. Lai and S. B. A. Hamid, RSC Adv., 2017, 7, 23030–23040 RSC.
- X. Li, L. Zhang and G. He, Carbon, 2016, 99, 514–522 CrossRef CAS.
- J. Chen, K. Huang and S. Liu, Electrochim. Acta, 2009, 55, 1–5 CrossRef CAS.
- L. Wang, H. Ji, S. Wang, L. Kong, X. Jiang and G. Yang, Nanoscale, 2013, 5, 3793–3799 RSC.
- S. C. Pang, W. H. Khoh and S. F. Chin, J. Mater. Sci., 2010, 45, 5598–5604 CrossRef CAS.
- E. Mitchell, R. K. Gupta, K. Mensahdarkwa, D. Kumar, K. Ramasamy, B. K. Gupta and P. Kahol, New J. Chem., 2014, 38, 4344–4350 RSC.
- K. Bhattacharya and P. Deb, Dalton Trans., 2015, 44, 9221 RSC.
- F. Y. Zhao, M. R. Ding, J. Chen, Y. L. Li and L. H. Li, Appl. Mech. Mater., 2015, 748, 111–114 Search PubMed.
- D. Guan, Z. Gao, W. Yang, J. Wang, Y. Yuan, B. Wang, M. Zhang and L. Liu, Mater. Sci. Eng., B, 2013, 178, 736–743 CrossRef CAS.
- S. Ghasemi and F. Ahmadi, J. Power Sources, 2015, 289, 129–137 CrossRef CAS.
- S. Yang, Y. Liu, Y. Hao, X. Yang, R. W. Goddard, X. L. Zhang and B. Cao, Adv. Sci., 2018, 5, 1700659 CrossRef PubMed.
- X.-L. Wu, L.-L. Chen, S. Xin, Y. X. Yin, Y. G. G. Prof, Q. S. Kong and Y. Z. X. Prof, ChemSusChem, 2010, 3, 703–707 CrossRef CAS PubMed.
- M. Y. Song, H. Y. Park, D. S. Yang, D. Bhattacharjya and J. S. Yu, ChemSusChem, 2014, 7, 1755 CrossRef CAS PubMed.
- Q. Liu, C. Lv, Y. Yang, F. He and L. Ling, J. Mol. Struct., 2005, 733, 193–202 CrossRef CAS.
- O. Paris, C. Zollfrank and G. A. Zickler, Carbon, 2005, 43, 53–66 CrossRef CAS.
- A. C. Ferrari, J. C. Meyer, V. Scardaci, C. Casiraghi, M. Lazzeri, F. Mauri, S. Piscanec, D. Jiang, K. S. Novoselov and S. Roth, Phys. Rev. Lett., 2006, 97, 187401 CrossRef CAS PubMed.
- T. Zhang, D. Huang, Y. Yang, F. Kang and J. Gu, Polymer, 2012, 53, 6000–6007 CrossRef CAS.
- H. Peng, Z. Mo, S. Liao, H. Liang, L. Yang, F. Luo, H. Song, Y. Zhong and B. Zhang, Sci. Rep., 2013, 3, 1765 CrossRef.
- I. Oh, M. Kim and J. Kim, Appl. Surf. Sci., 2015, 328, 222–228 CrossRef CAS.
- S. Tai, Z. Zhang, J. Xiao, C. Chen, X. Fei, W. Shuai and Y. Liu, Sci. Rep., 2013, 3, 2527 CrossRef PubMed.
- I. Oh, M. Kim and J. Kim, Energy, 2015, 86, 292–299 CrossRef CAS.
- A. Hu, X. Chen, Q. Tang and B. Zeng, Ceram. Int., 2014, 40, 14713–14725 CrossRef CAS.
- X. Du, C. Wang, M. Chen, Y. Jiao and J. Wang, J. Phys. Chem. C, 2009, 113, 2643–2646 CrossRef CAS.
- A. K. Das, S. Sahoo, A. Prabhakaran, S. Zhang and J. J. Shim, RSC Adv., 2016, 6, 107057–107064 RSC.
- W. Shi, J. Zhu, D. H. Sim, Y. Y. Tay, Z. Lu, X. Zhang, Y. Sharma, M. Srinivasan, H. Zhang and H. H. Hng, J. Mater. Chem., 2011, 21, 3422–3427 RSC.
| This journal is © The Royal Society of Chemistry 2018 |

