 Open Access Article
Far-red-emitting double-perovskite CaLaMgSbO6:Mn4+ phosphors with high photoluminescence efficiency and thermal stability for indoor plant cultivation LEDs
Jia Liang,
Liangling Sun,
Balaji Devakumar,
Shaoying Wang,
Qi Sun,
Heng Guo,
Bin Li and
Xiaoyong Huang *
*
Key Lab of Advanced Transducers and Intelligent Control System, Ministry of Education and Shanxi Province, College of Physics and Optoelectronics, Taiyuan University of Technology, Taiyuan 030024, P. R. China. E-mail: huangxy04@126.com
First published on 12th September 2018
Abstract
A series of Mn4+-activated CaLaMgSbO6 far-red-emitting phosphors were synthesized by a solid-state reaction route and the microstructure and optical characterizations were investigated in detail. Upon excitation at 370 and 469 nm, the samples showed intense far-red emission at about 708 nm originating from the 2Eg → 4A2g transition and the optimal Mn4+ concentration was 0.7 mol%. The as-prepared phosphors also exhibited excellent internal quantum efficiency (88%) and high thermal stability. The emission intensity at room temperature dropped to 54% when the temperature rose to 423 K and the activation energy was 0.34 eV. The outstanding optical properties and the fact that the emission band of the obtained phosphors had a broad overlap with the absorption band of phytochrome PFR demonstrated that the CaLaMgSbO6:Mn4+ phosphors may be promising potential spectral converters for applying to indoor plant cultivation light-emitting diodes.
Introduction
In recent years, indoor plant growth has developed rapidly to avoid the harmful effects of extreme weather, disease, pests, and other factors on plants, which also increases the crop yield and plant quality.1–3 The light environment is an indispensable condition for plant cultivation, and moreover, light at different wavelengths has different influences on plant growth; for example, blue light (∼440 nm) can promote protein synthesis and enhance chloroplast activity, while red light (∼660 nm) can accelerate the flowering and fruiting as well as increasing production,4–11 and far-red light (∼730 nm) can control the process of plant growth (adjusting the ratio of phytochrome PFR and PR to effect the growth of the plant).12 Hence, for indoor plants, artificial light as an energy source plays an essential role. Meanwhile, it was reported that under an appropriate light-emitting diode (LED) lamp, plants grow faster than naturally grown plants because the artificial light can be adjusted according to the different light needs of the plants to achieve the most favourable conditions for plant growth.Inorganic phosphors with admirable properties have been widely used in solid-state lighting.13–21 Mn4+ as the non-rare-earth transition metal ion has the 3d3 electron configuration and can generate deep red emissions due to the spin- and parity-forbidden 2Eg → 4A2g transition.22–31 Importantly, the deep red emission bands of Mn4+ under the excitation of near-ultraviolet (near-UV) and blue lights satisfy the demand of plant growth for far-red light. Besides, the lower price of Mn4+ ion also makes it an ideal activator compared with the rare-earth ions.
Recently, the double-perovskite compounds have been researched extensively due to their good chemical properties and thermal stability.32–37 For AA′BB′O6 structure compounds, B sites provide octahedral centers, in which Mn4+ ions can exhibit good stability and emit far-red light.38–42 In novel double-perovskite CaLaMgSbO6 (CLMS) host, Sb atoms are coordinated with 6 oxygen atoms to form [SbO6] octahedrons, offering suitable sites for Mn4+ ions.
In this present paper, we reported double-perovskite CaLaMgSbO6:Mn4+ (CLMS:Mn4+) far-red-emitting phosphors. Under excitation by near-UV and blue lights, the as-prepared phosphors gave bright far-red emission around 708 nm, which matched well with the absorption band of phytochrome PFR. Moreover, CLMS:Mn4+ phosphors also presented outstanding internal quantum efficiency (IQE) of 88% and good thermal stability. The above results implied that CLMS:Mn4+ phosphors may be promising candidates for applying to indoor plant cultivation illumination.
Experimental
Samples of CaLaMgSb1−xO6:xMn4+ (abbreviated as CLMS:xMn4+; x = 0.1%, 0.3%, 0.5%, 0.7%, 1.0%, 1.2%, and 1.5%) phosphors were synthesized by a conventional high-temperature solid-state reaction method in an air atmosphere. The stoichiometric amounts of raw materials CaCO3 (analytical reagent, abbreviated as AR), La2O3 (99.99%), MgO (AR), Sb2O5 (AR), and MnCO3 (AR) were weighed first and then ground thoroughly in an agate mortar. Subsequently, the mixtures were transferred to the alumina crucibles and then sintered at 1500 °C for 6 h in a furnace. When the samples were cooled down naturally to room temperature, ground them again for further characterizations.The phase purity and crystal structure of the samples were recorded by an X-ray diffractometer (XRD; Bruker D8 Advance) with Cu Kα radiation. The room-temperature photoluminescence (PL) and PL excitation (PLE) spectra were measured by Edinburgh FS5 spectrometer equipped with a 150 W continuous-wave xenon lamp. The decay curves, IQE, and temperature-dependent emission spectra of the obtained phosphors were also recorded by Edinburgh FS5 spectrometer equipped with a pulsed xenon lamp, an integrating sphere coated with barium sulfate, and a temperature controller.
The as-prepared CLMS:0.7% Mn4+ red phosphors and silicone were mixed thoroughly to get the phosphor–silicone mixture, and then the obtained mixture was coated on the surface of the 365 nm LED chip to fabricate prototype LED device.
Results and discussion
The phase purity and structure of the as-prepared phosphors were analysed by using XRD and Rietveld refinement. Fig. 1(a) shows the XRD patterns of CLMS:xMn4+ (x = 0.1%, 0.7%, and 1.5%) phosphors, from which it can be seen that the main diffraction peaks of the spectra matched well with the standard card PDF#30-0261 except some small impurity peaks situated at 25.2°, 39.5°, and 52.6°, and moreover, the impurity peaks belonged to Mg3Sb2 (PDF#03-0375) compound, illustrating that the impurity materials were not of any manganese compound and the dopant entered into the host without significant influence. Fig. 1(b) presents the Rietveld refinement of CLMS:0.7% Mn4+ phosphors and Table 1 gives the relevant crystallographic parameters. The CLMS compound belonged to monoclinic P21/n space group with lattice parameters a = 5.57801(21) Å, b = 5.65024(18) Å, c = 7.93650(30) Å, and V = 250.135(14) Å3. In addition, with an AA′BB′O6 double-perovskite structure, CLMS compound demonstrated a rock salt ordering of Mg and Sb on the B sites as displayed in Fig. 1(c).43,44 Both Mg and Sb atoms were surrounded by 6 oxygen atoms to provide an octahedral environment for Mn. Considering the ions radius and valance state (Mg2+, r = 0.72 Å, coordination number (CN) = 6; Sb5+, r = 0.60 Å, CN = 6; Mn4+, r = 0.53 Å, CN = 6),45 the Mn4+ dopants preferred to substituted Sb5+ ions.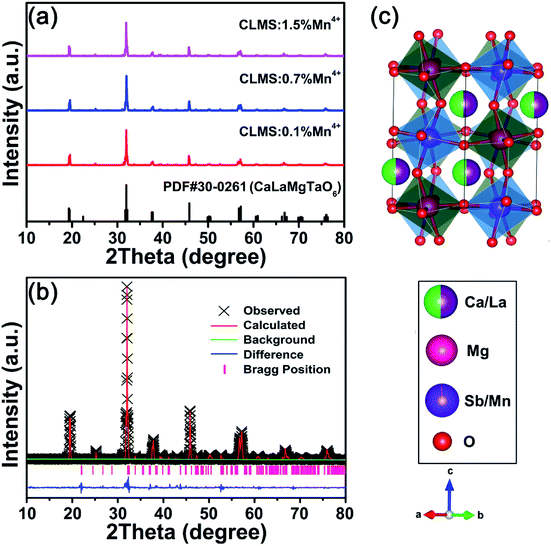 | ||
| Fig. 1 (a) XRD patterns of CLMS:xMn4+ (x = 0.1%, 0.7%, and 1.5%) phosphors. (b and c) Rietveld refinement (b) and crystal structure (c) of CLMS:0.7% Mn4+ phosphors. | ||
| Formula | CaLaMgSbO6:0.7% Mn4+ |
| Space group | P21/n – monoclinic |
| Lattice parameters | a = 5.57801(21) Å |
| b = 5.65024(18) Å | |
| c = 7.93650(30) Å | |
| α = γ = 90° | |
| β = 89.901(4)° | |
| Unit cell volume | V = 250.135(14) Å3 |
Fig. 2(a) shows the typical PLE and PL spectra of CLMS:0.7% Mn4+ phosphors. When monitored at 708 nm, the PLE spectrum consisted of two broad bands in the wavelength range of 250–600 nm, which matched well with the emission bands of near-UV and blue LED chips. The PLE spectrum can also be fitted by four Gaussian curves centered at 312, 371, 468, and 519 nm, which were attributed to Mn4+–O2− charge transfer band (CTB), 4A2g → 4T1g, 4A2g → 2T2g, and 4A2g → 4T2g transitions of Mn4+ ions, respectively.46–48 It should be noted that the spike-like PLE peak series observed in Fig. 2(a) had been sometimes observed in some Mn4+-activated fluoride phosphors that were caused by a vibronic progression of the local octahedron vibration mode or, in some cases, exogenously produced by a xenon lamp used in the PLE measurements.49,50 It seemed that such peak series observed in the present study may be due to the xenon-lamp excitation source. Furthermore, under the excitations of 370 and 469 nm, two sharp bands at 695 and 708 nm ascribing to the diverse vibrational modes of 2Eg → 4A2g transitions were observed,51,52 and the full-width at half maximum was found to be 35 nm. More importantly, the emission bands of CLMS:Mn4+ phosphors had a broad overlap with the absorption band of phytochrome PFR, as exhibited in Fig. 2(b), which meant that CLMS:Mn4+ phosphors had potential application in indoor plant cultivation.
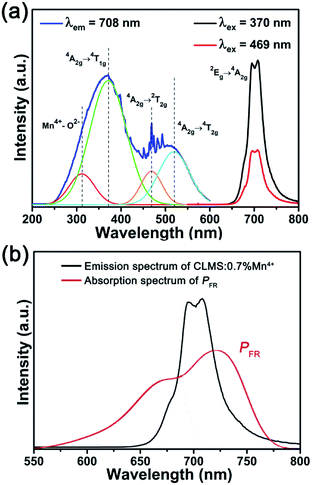 | ||
| Fig. 2 (a) PLE and PL spectra of CLMS:0.7% Mn4+ phosphors. (b) Comparison of emission spectrum of CLMS:0.7% Mn4+ phosphors (λex = 370 nm) and absorption spectrum of phytochrome PFR. | ||
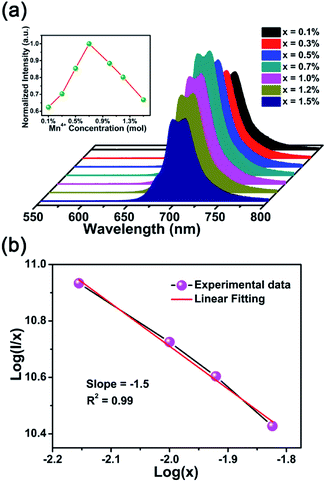
The PL spectra and relevant normalized PL intensity as a function of Mn4+ concentration under the 370 nm excitation were presented in Fig. 3(a). The contours of PL spectra had no change with the various concentrations of Mn4+ apart from the intensity. With the increasing dopant concentration, the intensity increased gradually until reached the maximum value when x = 0.7%, and subsequently, the intensity decreased slowly due to the concentration quenching effect. The PLE and PL spectra of the Mn4+ ion clearly overlapped in the 2Eg absorption/emission transition region.53 However, the Mn4+ ion in the CLMS:Mn4+ phosphors acted not only as acceptor but also as donor and, therefore, no efficient radiation reabsorption occurred in these phosphors. If the acceptor and donor ions are different ions and their absorption and emission spectra efficiently overlap, then there is a risk of radiation reabsorption that often occurs in a mixture between nitride red phosphor and Y3Al5O12:Ce3+ yellow phosphor.54 So the energy transfer mechanism must be exchange interaction or electric multipolar interaction. According to the theory proposed by Blasse,55 the critical distance (Rc) can be used to verify the nonradiative energy transfer among the adjacent Mn4+ ions, as follows:55
 | (1) |
| I/x = K[1 + β(x)θ/3]−1 | (2) |
The room-temperature fluorescent decay curves of CLMS:xMn4+ phosphors were presented in Fig. 4(a). Upon the excitation of 370 nm, the obtained decay curves can be fitted by the following double-exponential function:57
I(t) = A1![[thin space (1/6-em)]](https://www.rsc.org/images/entities/char_2009.gif) exp(−t/τ1) + A2 exp(−t/τ1) + A2![[thin space (1/6-em)]](https://www.rsc.org/images/entities/char_2009.gif) exp(−t/τ2) exp(−t/τ2)
| (3) |
| τs = (A1τ12 + A2τ22)/(A1τ1 + A2τ2) | (4) |
The τs of CLMS:xMn4+ were determined to be 1.127, 1.121, 1.117, 1.113, 1.088, 1.063, and 1.039 ms corresponding to x = 0.1%, 0.3%, 0.5%, 0.7%, 1.0%, 1.2%, and 1.5%, respectively. The lifetimes declined with the increasing dopant concentration, which was due to the nonradiative energy transfer among the Mn4+ ions.
Fig. 4(b) shows the representative CIE chromaticity diagram of CLMS:0.7% Mn4+ phosphors under 370 nm excitation. On the basis of the PL spectrum, the CIE coordinates were determined to be (0.7251, 0.2748), which located at far-red range. Besides, the phosphors emitted bright red light under near-UV light (inset of Fig. 4(b)). The color purity was investigated as the following equation:59
 | (5) |
IQE is a crucial factor to evaluate the application of the phosphors.61 The IQE of CLMS:0.7% Mn4+ phosphors was investigated as Fig. 4(c) according to the following formula:62
 | (6) |
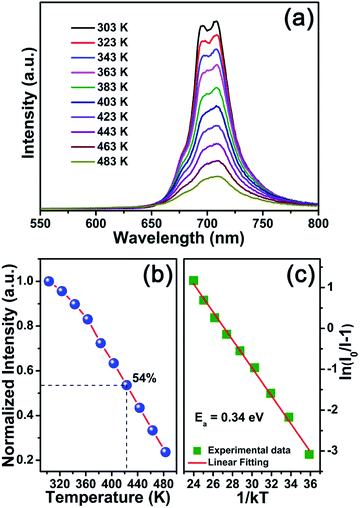
The temperature-dependent PL spectra of CLMS:0.7% Mn4+ phosphors were demonstrated in Fig. 5(a). Under the excitation of 370 nm, as the temperature was increased from 303 K to 483 K, the PL intensity decreased gradually which can be attributed to the thermal quenching effect. The PL intensity at 423 K maintained 54% of the initial value at 303 K, as shown in Fig. 5(b), which indicated an excellent thermal stability of the as-prepared phosphors. Besides, to further investigated the thermal quenching effect, the activation energy was calculated as the equation of Arrhenius:67
 | (7) |
In order to test the effect of the as-prepared phosphors in practical applications, a prototype far-red LED device was fabricated with the help of CLMS:0.7% Mn4+ phosphors and a 365 nm LED chip. The electroluminescence (EL) spectrum presented an intense far-red emission band ranging from 650 to 800 nm, which corresponding to the PL spectra of the phosphors as shown in Fig. 6. From the inset, bright red light was observed from the LED device under 60 mA current and 3 V voltage, and the CIE coordinates were obtained to be (0.7331, 0.2669), matching well with the need of the plant growth for deep red light. The above results demonstrated that the CLMS:Mn4+ far-red phosphors were potential materials for applying in indoor plant growth.
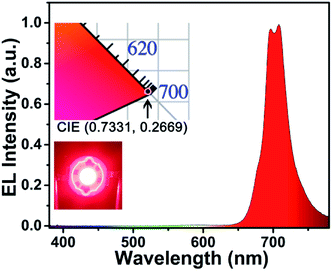 | ||
| Fig. 6 EL spectrum of the fabricated far-red-emitting LED device. Insets show CIE chromaticity diagram and the luminescent image of the fabricated LED device. | ||
Conclusions
Novel Mn4+-activated CaLaMgSbO6 far-red-emitting phosphors were synthesized via a high-temperature solid-state reaction method. The phosphors exhibited intense far-red light centered at about 708 nm when excited at 370 and 469 nm. The optimal concentration of Mn4+ ions was 0.7 mol%, and the CIE chromaticity coordinates of CLMS:0.7% Mn4+ sample were (0.7251, 0.2748) which situated at far red region. The phosphors had high IQE of 88%, and also showed excellent thermal stability that the PL intensity at 423 K was 54% of that at 303 K. The above splendid luminescence properties illustrated that the CLMS:Mn4+ compounds were potential far-red-emitting phosphors for plant cultivation LEDs applications.Conflicts of interest
There are no conflicts to declare.Acknowledgements
This work was supported by the National Natural Science Foundation of China (No. 51502190), the Program for the Outstanding Innovative Teams of Higher Learning Institutions of Shanxi, and the Open Fund of the State Key Laboratory of Luminescent Materials and Devices (South China University of Technology, No. 2017-skllmd-01).Notes and references
- N. Yeh and J.-P. Chung, Renewable Sustainable Energy Rev., 2009, 13, 2175–2180 CrossRef.
- X. Huang and H. Guo, Dyes Pigm., 2018, 152, 36–42 CrossRef.
- T. Nakajima and T. Tsuchiya, ACS Appl. Mater. Interfaces, 2015, 7, 21398–21407 CrossRef PubMed.
- J. Chen, N. Zhang, C. Guo, F. Pan, X. Zhou, H. Suo, X. Zhao and E. M. Goldys, ACS Appl. Mater. Interfaces, 2016, 8, 20856–20864 CrossRef PubMed.
- P. F. Devlin, J. M. Christie and M. J. Terry, J. Exp. Bot., 2007, 58, 3071–3077 CrossRef PubMed.
- R. Cao, Z. Shi, G. Quan, T. Chen, S. Guo, Z. Hu and P. Liu, J. Lumin., 2017, 188, 577–581 CrossRef.
- Z. Zhou, J. Zheng, R. Shi, N. Zhang, J. Chen, R. Zhang, H. Suo, E. M. Goldys and C. Guo, ACS Appl. Mater. Interfaces, 2017, 9, 6177–6185 CrossRef PubMed.
- Y. J. Yun, J. K. Kim, J. Y. Ju, S. K. Choi, W. I. Park, J. Y. Suh, H. K. Jung, Y. Kim and S. Choi, Phys. Chem. Chem. Phys., 2017, 19, 11111–11119 RSC.
- N. Yeh, T. J. Ding and P. Yeh, Renewable Sustainable Energy Rev., 2015, 51, 55–61 CrossRef.
- Y. Zheng, H. Zhang, H. Zhang, Z. Xia, Y. Liu, M. S. Molokeev and B. Lei, J. Mater. Chem. C, 2018, 6, 4217–4224 RSC.
- Z. Zhou, M. Xia, Y. Zhong, S. Gai, S. Huang, Y. Tian, X. Lu and N. Zhou, J. Mater. Chem. C, 2017, 5, 8201–8210 RSC.
- K. A. Franklin and P. H. Quail, J. Exp. Bot., 2010, 61, 11–24 CrossRef PubMed.
- J. Xue, X. Wang, J. H. Jeong and X. Yan, Phys. Chem. Chem. Phys., 2018, 20, 11516–11541 RSC.
- X. Li, D. Xu, X. Liu and H. Guo, RSC Adv., 2017, 7, 53839–53845 RSC.
- D. Chen, S. Yuan, X. Li and W. Xu, RSC Adv., 2017, 7, 36168–36174 RSC.
- J. Qiao, L. Ning, M. Molokeev, Y.-C. Chuang, Q. Liu and Z. Xia, J. Am. Ceram. Soc., 2018, 140, 9730–9736 Search PubMed.
- X. Huang, Nat. Photonics, 2014, 8, 748–749 CrossRef.
- Y. Zhu, L. Cao, M. G. Brik, X. Zhang, L. Huang, T. Xuan and J. Wang, J. Mater. Chem. C, 2017, 5, 6420–6426 RSC.
- X. Huang, J. Alloys Compd., 2017, 690, 356–359 CrossRef.
- B. Li, X. Huang, H. Guo and Y. Zeng, Dyes Pigm., 2018, 150, 67–72 CrossRef.
- P. Du, L. Luo, X. Huang and J. S. Yu, J. Colloid Interface Sci., 2018, 514, 172–181 CrossRef PubMed.
- Q. Sun, S. Wang, B. Li, H. Guo and X. Huang, J. Lumin., 2018, 203, 371–375 CrossRef.
- P. Cai, X. Wang and H. J. Seo, Phys. Chem. Chem. Phys., 2018, 20, 2028–2035 RSC.
- D. Chen, Y. Zhou and J. Zhong, RSC Adv., 2016, 6, 86285–86296 RSC.
- Q. Sun, B. Li, S. Wang, H. Guo and X. Huang, J. Mater. Sci.: Mater. Electron., 2018, 29, 12972–12977 CrossRef.
- S. Liang, M. Shang, H. Lian, K. Li, Y. Zhang and J. Lin, J. Mater. Chem. C, 2017, 5, 2927–2935 RSC.
- M. Zhu, Y. Pan, L. Xi, H. Lian and J. Lin, J. Mater. Chem. C, 2017, 5, 10241–10250 RSC.
- L. Xi, Y. Pan, M. Zhu, H. Lian and J. Lin, J. Mater. Chem. C, 2017, 5, 9255–9263 RSC.
- S. Wang, Q. Sun, B. Devakumar, L. Sun, J. Liang and X. Huang, RSC Adv., 2018, 8, 30191–30200 RSC.
- K. Sankarasubramanian, B. Devakumar, G. Annadurai, L. Sun, Y.-J. Zeng and X. Huang, RSC Adv., 2018, 8, 30223–30229 RSC.
- M. Peng, X. Yin, P. A. Tanner, M. G. Brik and P. Li, Chem. Mater., 2015, 27, 2938–2945 CrossRef.
- J. Liang, L. Sun, B. Devakumar, S. Wang, Q. Sun, H. Guo, B. Li and X. Huang, RSC Adv., 2018, 8, 27144–27151 RSC.
- Q. Liu, L. Wang, W. Huang, L. Zhang, M. Yu and Q. Zhang, J. Alloys Compd., 2017, 717, 156–163 CrossRef.
- R. Yu, C. Wang, J. Chen, Y. Wu, H. Li and H. Ma, ECS J. Solid State Sci. Technol., 2014, 3, R33–R37 CrossRef.
- T. T. Deng, E. H. Song, Y. Y. Zhou, L. Y. Wang and Q. Y. Zhang, J. Mater. Chem. C, 2017, 5, 12422–12429 RSC.
- Y. Liang, H. M. Noh, W. Ran, S. H. Park, B. C. Choi, J. H. Jeong and K. H. Kim, J. Alloys Compd., 2017, 716, 56–64 CrossRef.
- J. Zhong, D. Chen, X. Chen, K. Wang, X. Li, Y. Zhu and Z. Ji, Dalton Trans., 2018, 47, 6528–6537 RSC.
- D. R. Kim, S. W. Park, B. K. Moon, S. H. Park, J. H. Jeong, H. Choi and J. H. Kim, RSC Adv., 2017, 7, 1464–1470 RSC.
- P. Cai, L. Qin, C. Chen, J. Wang, S. Bi, S. I. Kim, Y. Huang and H. J. Seo, Inorg. Chem., 2018, 57, 3073–3081 CrossRef PubMed.
- G. Jiang, B. Yang, G. Zhao, Y. Liu, J. Zou, H. Sun, H. Ou, Y. Fang and J. Hou, Opt. Mater., 2018, 83, 93–98 CrossRef.
- H. Chen, H. Lin, Q. Huang, F. Huang, J. Xu, B. Wang, Z. Lin, J. Zhou and Y. Wang, J. Mater. Chem. C, 2016, 4, 2374–2381 RSC.
- Y. Li, S. Qi, P. Li and Z. Wang, RSC Adv., 2017, 7, 38318–38334 RSC.
- L. Wang, Q. Liu, K. Shen, Q. Zhang, L. Zhang, B. Song and C. Wong, J. Alloys Compd., 2017, 696, 443–449 CrossRef.
- Q. Liu, L. Wang, W. Huang, X. Li, M. Yu and Q. Zhang, Ceram. Int., 2017, 43, 16292–16299 CrossRef.
- Q. Liu, L. Wang, W. Huang, X. Li, M. Yu and Q. Zhang, Ceram. Int., 2018, 44, 1662–1667 CrossRef.
- A. Fu, L. Zhou, S. Wang and Y. Li, Dyes Pigm., 2018, 148, 9–15 CrossRef.
- Q. Huang, W. Ye, G. Hu, X. Jiao and X. Liu, J. Lumin., 2018, 194, 557–564 CrossRef.
- J. Y. Park, J. S. Joo, H. K. Yang and M. Kwak, J. Alloys Compd., 2017, 714, 390–396 CrossRef.
- S. Adachi, J. Lumin., 2018, 197, 119–130 CrossRef.
- S. Adachi, J. Lumin., 2018, 202, 263–281 CrossRef.
- Y. Xu, Y. Zhang, L. Wang, M. Shi, L. Liu and Y. Chen, J. Mater. Sci.: Mater. Electron., 2017, 28, 12032–12038 CrossRef.
- J. Long, X. Yuan, C. Ma, M. Du, X. Ma, Z. Wen, R. Ma, Y. Wang and Y. Cao, RSC Adv., 2018, 8, 1469–1476 RSC.
- T. Arai and S. Adachi, Jpn. J. Appl. Phys., 2011, 50, 092401 Search PubMed.
- B. Wang, H. Lin, J. Xu, H. Chen and Y. Wang, ACS Appl. Mater. Interfaces, 2014, 6, 22905–22913 CrossRef PubMed.
- G. Blasse, Phys. Lett. A, 1968, 28, 444–445 CrossRef.
- D. L. Dexter, J. Chem. Phys., 1953, 21, 836–850 CrossRef.
- X. Huang, B. Li and H. Guo, J. Alloys Compd., 2017, 695, 2773–2780 CrossRef.
- P. Du, X. Huang and J. S. Yu, Inorg. Chem. Front., 2017, 4, 1987–1995 RSC.
- X. Huang, B. Li, H. Guo and D. Chen, Dyes Pigm., 2017, 143, 86–94 CrossRef.
- H. Guo, X. Huang and Y. Zeng, J. Alloys Compd., 2018, 741, 300–306 CrossRef.
- X. Huang, H. Guo and B. Li, J. Alloys Compd., 2017, 720, 29–38 CrossRef.
- P. Du, X. Huang and J. S. Yu, Chem. Eng. J., 2018, 337, 91–100 CrossRef.
- K. Li, H. Lian and R. Van Deun, Dalton Trans., 2018, 47, 2501–2505 RSC.
- Y. Takeda, H. Kato, M. Kobayashi, H. Kobayashi and M. Kakihana, Chem. Lett., 2015, 44, 1541–1543 CrossRef.
- K. Li, H. Lian and D. R. Van, J. Lumin., 2018, 198, 155–162 CrossRef.
- X. Huang, J. Liang, B. Li, L. Sun and J. Lin, Opt. Lett., 2018, 43, 3305–3308 CrossRef PubMed.
- S. A. Arrhenius, Z. Phys. Chem., 1889, 4, 96–116 Search PubMed.
- S. Zhang, Y. Hu, H. Duan, Y. Fu and M. He, J. Alloys Compd., 2016, 693, 315–325 CrossRef.
- Y. Zhang, L. Li, X. Zhang and Q. Xi, J. Rare Earths, 2008, 26, 446–449 CrossRef.
| This journal is © The Royal Society of Chemistry 2018 |

