 Open Access Article
Dissolving organic matter from low-organic sewage sludge for shortening the anaerobic digestion time†
Yiyong Liab,
Yongyou Hu *cd,
Guofu Huangef,
Ziqi Yucd,
Wei Bicd,
Hao Fancd and
Jianjun Duab
aCollege of Environment Science and Engineering, Zhongkai University of Agriculture and Engineering, Guangzhou, Guangdong 510225, China
bGuangdong Provincial Engineering and Technology Research Center for Agricultural Land Pollution Prevention and Control, Guangzhou 510225, China
cMinistry of Education Key Laboratory of Pollution Control and Ecological Remediation for Industrial Agglomeration Area, College of Environment and Energy, South China University of Technology, No. 382, East Waihuan Road, Guangzhou Higher Education Mega Center, Guangzhou 510006, China. E-mail: yueguangzhuying@126.com; Tel: +86 13602746125
dState Key Lab of Pulp and Paper Engineering, College of Light Industry and Food Science, South China University of Technology, Guangzhou 510640, China
eSchool of Chemical and Environmental Engineering, Weifang University of Science and Technology, Shouguang, 262700, China
fShandong Peninsula Engineering Research Center of Comprehensive Brine Utilization, Shouguang 262700, China
First published on 1st November 2018
Abstract
Pretreatments have been successfully used to shorten the HRT of anaerobic digestion (AD) of sewage sludge, but they become ineffective for low-organic sewage sludge, with HRT > 10 days. Herein, a new process using alkaline hydrolysis-anaerobic digestion has been developed to solve this problem. Firstly, maximum organic matter in the sludge was dissolved by strong alkaline hydrolysis (pH > 11) in a two-stage alkaline hydrolysis system (TSAHS). Secondly, only the supernatant of the sludge that contained most of the methane potential was applied for AD. The operational conditions were optimized and the process mechanism was also analyzed. The results showed that under optimum operational conditions, above 19% of the organic matter in the sludge was released into the supernatant after alkaline hydrolysis in TSAHS, and the supernatant for AD achieved a methane production of 392 mL CH4 per g COD. The process attained a methane production of 0.26 m3 CH4 per kg VS and a VS reduction of 43.5%, while the HRT was only 12 h. The advantage of the mechanism was that the alkaline neutralization capacity of the sludge maintained a proper pH value for the supernatant from TSAHS, which benefited subsequent AD. It is concluded that the new process based on the dissolution of organic matter can attain a short digestion time for low-organic sludge.
1 Introduction
Sewage sludge discharged from wastewater treatment plants (WWTPs) has become a worldwide problem due to the large output and secondary pollution risk.1 In 2015, approximately 39.73 million tons of sewage sludge (80% moisture content) was generated in China.2 Huge amounts of human, physical and financial resources have been dedicated to sewage sludge disposal, and it has become clear that resource utilization of sewage sludge is an inevitable requirement. Value-added products and biomass energy can be reclaimed; the latter has received preferential attention for the sake of sanitation safety and energy demand. Anaerobic digestion (AD) is widely used for energy reclamation from sewage sludge. Nevertheless, the main disadvantage of AD is its long digestion time with a hydraulic retention time (HRT) of more than 20 days resulting in a heavy investment burden for reactor, space, etc.3 Limited hydrolysis of hard biodegradable cells and extracellular biopolymers in the sewage sludge are accused for the slow release of organic matters from the sewage sludge.4 Therefore, researchers tried to accelerate the release of organic matter using pretreatments to shorten the HRT.5 Shin and Kang6 adopted an electron beam with an irradiation dose of 6 kGy for sewage sludge pretreatment, and the HRT for AD was decreased from 20 days to 10 days. Toreci et al.7 applied microwave (175 °C) for sewage sludge pretreatment in mesophilic anaerobic digesters, indicating a reduction of the HRT from 20 days to 10 days. A combined method of ultrasonication–ozonation (9 kJ g−1 TS and 0.012 g O3 per g TS) for sewage sludge pretreatment was also investigated, and the HRT was shortened from 20 days to 10 days.8 Furthermore, a combination of high-pressure homogenization and alkaline conditions (pH 10 and 12![[thin space (1/6-em)]](https://www.rsc.org/images/entities/char_2009.gif) 000 psi pressure) minimized the HRT from 18 days to 13 days and was successfully applied in the WWTPs of Chilliwack, Canada and in the WWTP of Los Angeles County, California.9 The HRT has been successfully shortened to approximately 10 days by the pretreatments.
000 psi pressure) minimized the HRT from 18 days to 13 days and was successfully applied in the WWTPs of Chilliwack, Canada and in the WWTP of Los Angeles County, California.9 The HRT has been successfully shortened to approximately 10 days by the pretreatments.
However, these pretreatment methods become ineffective for the AD of low-organic sludge (with a ratio of volatile solids/total solids (VS/TS) below 50% that differs from the typical sludge in a range of 60–80%), owing to the fact that the release of organic matters from low organic sludge is more difficult than that with high organic content.4,10,11 For example, Feng et al.12 pretreated the low-organic sludge at pH 10 for 4 h, and the HRT for AD was only reduced from 20 days to 15 days. Thermal pretreatment (50–120 °C) of low-organic sludge produced a similar result.10 It can be seen that pretreatment alone is not enough to cope with the long HRT for AD of the low-organic sludge, as indicated by the HRT of much more than 10 days.11 Unfortunately, more and more low-organic sludge is being produced in recent years due to the increasing application of biological nutrient removal process in WWTPs.10,13 At present, the average ratio of VS/TS of sewage sludge in China is only about 40%.14 Hence, there is an urgent requirement to improve the pretreatment of the low-organic sludge.
It is noteworthy that a large degree of organic substances can be released from the sewage sludge by strong alkaline hydrolysis (pH > 11, as a significant factor; the higher, the better), achieving a SCOD/TCOD ratio of up to 75% depending on the powerful ionization and hydrolysis reactions.15,16 In this case, we have assumed that AD only needs to be conducted with the supernatant of the low-organic sludge after sufficient alkaline hydrolysis so that most of the methane potential can be reclaimed. More importantly, the HRT can be greatly shortened because the supernatant practically has no rate-limiting step as that of hydrolysis by excluding the undissolved organic matters through centrifugation. To our knowledge, no researchers have proposed this idea, let alone its realization.
However, the problem of strong alkaline hydrolysis is the correspondingly high pH value of the supernatant beyond the pH limit for AD; thus, acid neutralization is usually needed before AD,17 causing additional operation processes and chemical consumption. In our previous study, we have designed a two-stage alkaline hydrolysis system (TSAHS) to solve this problem. In TSAHS, pH of the effluent supernatant can be controlled below 10.0, even when the pH during alkaline hydrolysis is as high as 13.0.18 And we also found that the effluent supernatant with pH < 10.0 is suitable for AD. On the basis of this study, a new process of alkaline hydrolysis-anaerobic digestion is proposed to manage the low-organic sludge. Firstly, organic matter in the sludge, such as the proteinaceous matter with high methane potential, are maximally released into the supernatant by strong alkaline hydrolysis; secondly, only the supernatant that obtained most of the methane potential of the sludge is subjected to AD. The operational conditions of the process have been optimized and the process mechanism is also discussed. Based on the results, feasibility of the new process for shortening the AD time of the low-organic sewage sludge was confirmed.
2 Materials and methods
2.1 Sludge samples
Low-organic sewage sludge was obtained from the secondary sedimentation tank of Lijiao WWTP located in Guangzhou city, China. The sludge was sieved (mesh size 1.0 mm) to remove sand and waste materials, gravitationally concentrated, and stored at 4 °C. The concentrated sludge was diluted with distilled water to obtain a sludge sample of 20 g L−1. The sludge sample had VS/TS ratio of 48% ± 2%, TCOD of 11![[thin space (1/6-em)]](https://www.rsc.org/images/entities/char_2009.gif) 600 ± 4300 mg L−1, SCOD of 29 ± 10 mg L−1, TP of 225 ± 25 mg L−1, TN of 850 ± 80 mg L−1, water content of 98.2% ± 0.2%, and a pH value of 6.6 ± 0.2.
600 ± 4300 mg L−1, SCOD of 29 ± 10 mg L−1, TP of 225 ± 25 mg L−1, TN of 850 ± 80 mg L−1, water content of 98.2% ± 0.2%, and a pH value of 6.6 ± 0.2.
Anaerobic granular sludge (AGS) as seed sludge was obtained from an EGSB reactor at a distillery WWTP in Foshan city, China. The TS, VS, and pH values of the AGS were 29.3 g L−1, 22.0 g L−1, and 7.0 g L−1, respectively. The AGS was stored at 4 °C and resuscitated in a biochemical incubator (35 °C) for 7 days before inoculation. This inoculum was active and adaptable for AD.
2.2 Alkaline hydrolysis
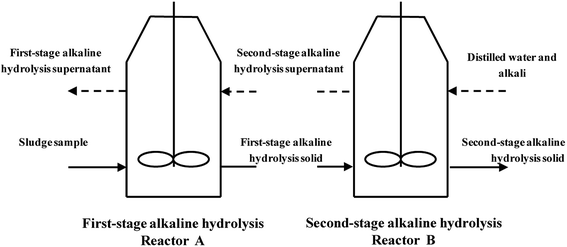
Alkaline hydrolysis was carried out in a TSAHS, as reported in our previous study.18 The lab scale TSAHS is shown in Fig. 1. For a start-up, X3 mL of the sludge sample was injected into reactor A and NaOH solution (10 mol L−1) was added to attain an initial pH of 10 under continuous stirring at 150 rpm, in which the optimized hydrolysis time is 1 h as reported in our previous studies.18,19 After 1 h, the mixture was centrifuged at 4000 rpm for 10 min, and the first-stage alkaline hydrolysis supernatant was discharged. The residual solid from reactor A was injected into reactor B, and X2 mL of distilled water was injected. NaOH solution was then added to achieve an initial pH value of X1 under constant stirring at 150 rpm. After 1 h, the mixture was centrifuged at the same conditions and the second-stage alkaline hydrolysis supernatant was injected into reactor A, while the residual solid was discharged from reactor B. For the running phase, no NaOH was needed in reactor A to adjust the pH, and the other operating procedures were the same as those of the start-up. Each sludge sample injection was referred to as one batch, and the supernatant discharged from reactor A (called effluent supernatant) was collected for methane production. The effluent supernatant was analyzed for COD, SCOD, BOD5, TP, TN, NH4+–N and pH. The VS of the discharged solid from reactor B was also analyzed to assess the methane production using the new process.In TSAHS, efficiency of the alkaline hydrolysis (EAH) indicates the dissolution degree of organic matter from the sewage sludge. The EAH and effluent supernatant pH were determined mainly by three factors: alkaline hydrolysis pH (X1), distilled water volume (X2), and sludge sample volume (X3). Based on response surface method (RSM), an experiment with the three factors at three levels was conducted to determine the suitable operational conditions for TSAHS. The independent variables were X1, X2, and X3, which were coded with −1, 0, and +1 representing low, middle, and high levels, respectively. The response values were Y1 (EAH) and Y2 (effluent supernatant pH). The data were analyzed by Design-Expert software to discover the interaction among these factors and predict the range of operational conditions that can achieve both high EAH and effluent supernatant pH of 9.0–10.0. The design of factors and levels is shown in Table 1. Each set of conditions for TSAHS was operated in three batches. The calculated mode of EAH is
| EAH = (SCODeffluent − SCOD0)/(TCOD − SCOD0) | (1) |
| Run | X1 | X2 (mL) | X3 (mL) | Y1 (%) | Y2 |
|---|---|---|---|---|---|
| 1 | 13.00 | 10.00 | 25.00 | 8.84 | 9.09 |
| 2 | 12.25 | 20.00 | 25.00 | 8.53 | 8.93 |
| 3 | 12.25 | 20.00 | 25.00 | 8.12 | 8.83 |
| 4 | 13.00 | 20.00 | 35.00 | 17.43 | 9.72 |
| 5 | 13.00 | 30.00 | 25.00 | 30.09 | 11.68 |
| 6 | 13.00 | 20.00 | 15.00 | 32.87 | 12.44 |
| 7 | 12.25 | 10.00 | 15.00 | 7.98 | 8.99 |
| 8 | 11.50 | 10.00 | 25.00 | 5.82 | 8.00 |
| 9 | 11.50 | 30.00 | 25.00 | 9.53 | 7.83 |
| 10 | 12.25 | 30.00 | 15.00 | 11.42 | 8.95 |
| 11 | 12.25 | 20.00 | 25.00 | 11.55 | 8.49 |
| 12 | 11.50 | 20.00 | 35.00 | 6.93 | 7.57 |
| 13 | 12.25 | 20.00 | 25.00 | 11.13 | 8.41 |
| 14 | 12.25 | 30.00 | 35.00 | 9.02 | 8.31 |
| 15 | 11.50 | 20.00 | 15.00 | 9.93 | 7.99 |
| 16 | 12.25 | 10.00 | 35.00 | 8.03 | 7.89 |
| 17 | 12.25 | 20.00 | 25.00 | 9.60 | 8.48 |
2.3 Anaerobic digestion
The suitable operational conditions for AD were explored by biological methane potential test. The effects of the effluent supernatant pH value (7.0, 7.5, 8.0, 9.0, and 9.9 adjusted by HCl) and inoculum ratio (10%, 20%, 30%, 40%, and 50% in volume) on methane production were examined. Each treatment had three repetitions.A 250 mL flask was filled with the effluent supernatant and seed sludge, flushed with N2 gas for approximately 2 min, and immediately sealed with a rubber stopper. The control test (a fermentation flask filled with only the inoculum) was conducted to discount the methane production from the remaining organic matter in the inoculum. The flasks were incubated in a biochemical incubator at 35 °C with manual shaking twice a day. The biogas production was measured by water displacement method, where the water was a NaCl saturated solution with 2 mol L−1 NaOH, and the methane content in the biogas was detected by gas chromatography method.20 Each day, a sample of 2 mL was taken from the flask using sterile disposable syringe and centrifuged at 4000 rpm. The centrifuged supernatant was analyzed for COD, volatile fatty acids (VFA), and pH. Methane yield was reported as the amount of methane generated per gram of COD added (mL CH4 per g COD) and as the amount of methane generated per kilogram of VS reduction (m3 CH4 per kg VS) for convenient comparison with traditional AD.
2.4 Analytical methods
A PHS-3C was used for pH detection. The COD, BOD5, TP, TN, and NH4+–N were determined according to standard methods.21 VS and VFA were tested by classic gravimetric method and titrimetric method, respectively.22 All the experiments were conducted at least in duplicate, and the average value is reported for all data. Additionally, statistical analyses were carried out using the Design-Expert software (version 7.1.6, Stat-Ease, Inc., Minneapolis, MN).3 Results and discussion
3.1 Alkaline hydrolysis of sewage sludge
(1) Establishment of the prediction model. Results from the Design-Expert software analysis suggested that a quadratic model was suitable for Y1 and Y2, with equations of
| Y1 = 1544.69 − 258.83X1 − 6.03X2 + 4.10X3 + 0.58X1X2 − 0.41X1X3 + 10.90X12 − 0.02X22 + 0.02X32 | (2) |
| Y2 = 174.38 − 28.86X1 − 1.05X2 + 0.81X3 + 0.09X1X2 − 0.08X1X3 + 1.26X12 | (3) |
The results of the variance analysis are shown in Table S1.† F values of the two models (6.81 and 15.29) and the extremely low p values (0.0096 and 0.0008) implied that the models fitted significantly. The determination coefficients R2 of 0.8975 and 0.9516 indicated that less than 11% and 5% of the changes could not be explained, respectively, which also implied significant models. Therefore, the models could predict the experimental results.
(2) Effect of parameters. The perturbation plots manifest the effect of each parameter on the response values. A flatter curve suggests an insignificant effect, while a steeper curve suggests a significant effect. As seen in Fig. S1,† X1 had a significant effect on Y1 and Y2, X2 did not have a significant effect on Y1 or Y2, and X3 did not have a significant effect on Y1 but had a significant effect on Y2. X1 at a high level (+1) was excellent for organic matter dissolution, and thus X1 with a high level was better. An increase of X3 could decrease Y2 but could not create a clear decrease for Y1; thus, X3 with a high level was better. Additionally, X2 at a mid-level could obtain balanced Y1 and Y2.
The three-dimensional surface response plot (Fig. S2†) presents the effects of X1 and X3 on the response values when X2 was maintained at a mid-level. It was evident that an increase of X1 could significantly increase Y1 as well as Y2. Hence, aiming at achieving both high EAH and an appropriate effluent supernatant pH of 9.0–10.0, an optimal region would be necessary.
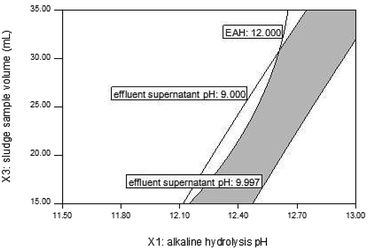
(3) Determination and confirmation of optimum parameters. A cross-section was attained from the overlap of the contour plots by setting values from multiple responses. This cross-section was the optimal region that met the set values of the multiple responses and was shown by shadow graph, in which the range of optimal conditions could be directly observed. Fig. 2 shows the range of optimal conditions that met the set values of EAH > 12% and an effluent supernatant pH of 9–10, where X2 was set at mid-level.
An additional experiment applying the optimum conditions (X1 = 12.87, X2 = 30.00 mL, X3 = 35.00 mL) was conducted to confirm the effectiveness of these models. Experimental values of 19.03% and 9.9 were obtained for Y1 and Y2, which were close to the model values of 19.62% and 10.00, respectively, with standard deviations below 5.0%. These results demonstrated that the experiment designed by RSM was reliable and that the models possessed a high predictive ability.
![[thin space (1/6-em)]](https://www.rsc.org/images/entities/char_2009.gif) :
:![[thin space (1/6-em)]](https://www.rsc.org/images/entities/char_2009.gif) TN
TN![[thin space (1/6-em)]](https://www.rsc.org/images/entities/char_2009.gif) :
:![[thin space (1/6-em)]](https://www.rsc.org/images/entities/char_2009.gif) TP value of 16.6
TP value of 16.6![[thin space (1/6-em)]](https://www.rsc.org/images/entities/char_2009.gif) :
:![[thin space (1/6-em)]](https://www.rsc.org/images/entities/char_2009.gif) 2.6
2.6![[thin space (1/6-em)]](https://www.rsc.org/images/entities/char_2009.gif) :
:![[thin space (1/6-em)]](https://www.rsc.org/images/entities/char_2009.gif) 1 suggested the presence of adequate nutrition in the effluent supernatant for AD.
1 suggested the presence of adequate nutrition in the effluent supernatant for AD.
| Effluent supernatant | Discharged solid | ||
|---|---|---|---|
| COD | 2649 mg L−1 | VS reduction | 43.5% |
| SCOD | 2213 mg L−1 | Water content | 86.8% |
| BOD5 | 1245 mg L−1 | pH | 12.5 |
| TP | 70 mg L−1 | ||
| TN | 195 mg L−1 | ||
| NH4+–N | 49.5 mg L−1 | ||
| pH | 9.9 | ||
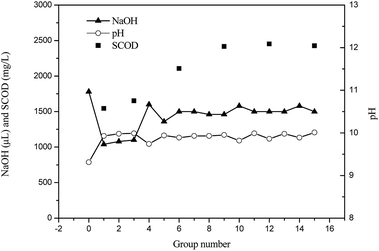
The discharged solid from the TSAHS after 16 batches had a VS reduction from 40.7% to 44.3%, increase in water content from 85.8% to 89.6%, and an increase in pH value from 12.3 to 12.5. Their average values are shown in Table 2. The discharged solid (mainly recalcitrant fiber and mineral salt with less odour) is preferable for the usage in compost24 and biochar.25
3.2 Anaerobic digestion of the effluent supernatant for methane production
(1) Effect of effluent supernatant pH on methane production. Fig. 4a shows a statistical analysis (Kruskall–Wallis test) carried out using the Statistical Package for Social Sciences software (SPSS 17.0, Inc., Chicago, IL, USA). The results (K–W = 36.75, p > 0.05) indicate that there were no significant differences among the five test groups for methane production, and the effluent supernatant pH had no significant effect on the methane production. A high methane production value of 331 ± 5 mL g−1 COD was attained after a pH adjustment to 8.0 from the initial pH of 7.5 in the flask. In the batch AD of alkali-pretreated sludge, Li et al.17 also observed that an initial pH of 7.6 was more suitable for methane production. It is well known that alkalescency (pH 7.0–7.6) benefits AD because of the metabolic balance between acid-producing bacteria and methanogens. There was methane production in the beginning of AD even at a high effluent supernatant pH of 9.9, indicating that methane production was not delayed. One reason for this result is that the initial pH of the flask was still low (pH = 7.8 ± 0.2), which can be attributed to the dilution effect and acid–base neutralization capacity of the AGS.17 Another reason is that the effluent supernatant was easily biodegraded (with 30.9% COD removal within 24 h), leading to a quick pH decrease from 7.8 ± 0.2 to 6.9 ± 0.1. Notably, methane production under the tested pH conditions approached its peak values at 72 h, which revealed the high rate of methane production.
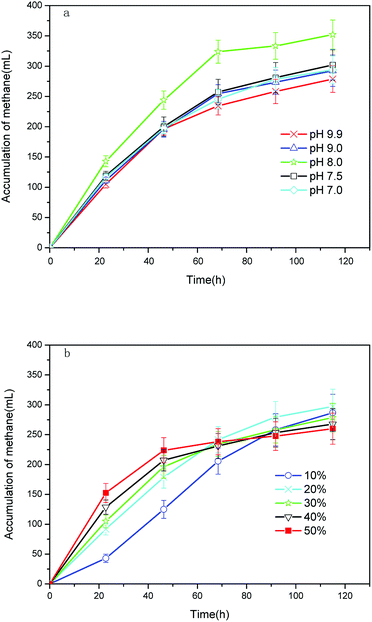 | ||
| Fig. 4 Cumulative methane yield with different (a) effluent supernatant pH values and (b) inoculum ratios. | ||
(2) Effect of inoculum ratio on methane production. The cumulative methane production decreased from 295 ± 18 mL to 268 ± 16 mL with increase in the inoculum ratio (Fig. 4b). This was ascribed to the minimization of organic matter in the effluent supernatant. Additionally, remarkably high methane production rates were obtained at higher inoculum ratios in the first 48 h. It is believed that a lower food/microorganism ratio (identical to a higher inoculum ratio) is less toxic.26 A total of 85% of the methane was produced in the first 24 h at an inoculum ratio of 50%, indicating a much shorter HRT under higher inoculum ratios.
Other researchers reported that methane yields were 0.30, 0.40 and 0.52 m3 CH4 per kg VS for ultrasound, alkaline, and thermal + alkaline pretreatment methods with HRTs of 20, 9 and 21 days, respectively.28–30 Their methane yields (VS/TS = 79%) are much higher than those obtained in our study, which can be ascribed to a low methane conversion in the sludge sample with low organic content used in our study (VS/TS = 48%). Feng et al.12 and Yan et al.10 also had methane yields below 0.15 m3 CH4 per kg VS for this type of sewage sludge (VS/TS = 38%). However, the HRT in our study was only 12 h, which is much shorter than the above HRTs. Therefore, the objective of designing the new process has been achieved.
3.3 Discovery of the process mechanism
A regression equation was built from multiple regression analysis, and both the quadratic and cubic curves fit the experimental data well. The quadratic equation was chosen because of considerations regarding model conciseness. The quadratic equation is
| y = 7.832 + 0.006x − 1.573 × 10−6x2, R2 = 0.970. | (4) |
Here, y is the pH and x (mmol NaOH per kg dry sludge) is the alkaline dose. The alkaline neutralization capacity for sewage sludges at various pH values could be predicted by this model. As an example, x was 425.506 when y = 10.0. In other words, each kilogram of dry sludge can neutralize 425.506 mmol NaOH when pH of the sludge sample is adjusted to 10.0. Thus, the sludge sample possessed considerable alkaline neutralization capacity, which is beneficial for pH adjustment.
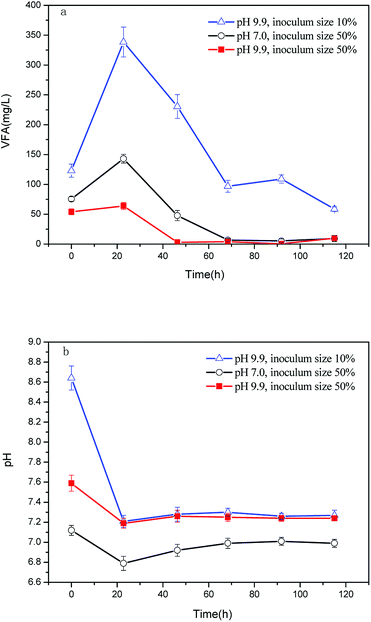
As seen in Fig. 5a, the VFA production was fast and achieved a relatively high level within 20 h, demonstrating the super biodegradability of the effluent supernatant. However, VFA degraded rapidly after it was produced, without accumulating in the effluent supernatant with pH 9.9 and inoculum ratio of 50%. Meanwhile, the VFA accumulation was distinct for an effluent supernatant pH of 9.9 and an inoculum ratio of 10%, achieving a high concentration of 338 mg L−1. The accumulation was reflected by the fast decrease of pH from 8.64 to 7.41 (Fig. 5b). All the VFA concentrations were within the range of normal values (200–800 mg L−1, indexed by acetic acid) for AD,34 suggesting a well-run AD. A slight VFA accumulation also occurred at the effluent supernatant pH of 7.0 and inoculum ratio of 50%, resulting in a change of the neutral pH to slightly acidic that inhibited the activity of methanogens and delayed VFA degradation. Therefore, an effluent supernatant pH of 9.9 was preferred for methane production as it eliminated VFA accumulation and maintained the flask pH at approximately 7.2. This constant pH benefited the methanogens that were sensitive to environmental changes. Hence, there was high rate of methane production at an effluent supernatant pH of 9.9 and an inoculum ratio of 50%.
4 Conclusions
(1) The optimum operational conditions for TSAHS were alkaline hydrolysis pH = 12.87, distilled water volume = 30.00 mL, and sludge sample volume = 35.00 mL. Over 19% of the organic matter in the low-organic sludge was released into the supernatant under these conditions.(2) The optimum operational conditions for AD were those in which the supernatant could directly be used for AD (without pH adjustment) i.e. an inoculum size of 60% with HRT of 12 h. And these conditions achieved a methane production of 392 mL CH4 per g COD.
(3) The process achieved a methane production of 0.26 m3 CH4 per kg VS that accounted for most of the methane potential in the low-organic sludge and a VS reduction of 43.5%, while the HRT was only 12 h. Therefore, the objective of designing a new process was achieved.
(4) The process mechanism discovered that the sewage sludge possessed considerable alkaline neutralization capacity to maintain a pH of 9–10 in the effluent supernatant. This alkalinity eliminated VFA accumulation during AD and maintained the reactor at approximately pH 7.2, which benefited methane production. It confirmed the feasibility of dissolution of organic matter in the low-organic sludge by strong alkaline hydrolysis for a short digestion time.
Conflicts of interest
There are no conflicts of interest to declare.Acknowledgements
This research was supported by the Major Science and Technology Project of Guangdong Province of China [2016B020240005] and the Natural Science Foundation of Guangdong Province of China [2016A030310317]. The authors are grateful to Dr Weimin Wu (Stanford University) for proof reading of this article.References
- X. Guo, Y. Yin, C. Yang and Z. Dang, Ecotoxicol. Environ. Saf., 2018, 152, 16 CrossRef CAS PubMed.
- H. G. Guo, L. Z. Du, J. F. Liang, Z. J. Yang, G. H. Cui and K. Q. Zhang, BioResources, 2017, 12, 195–210 CAS.
- N. D. Park, S. S. Helle and R. W. Thring, Biomass Bioenergy, 2012, 46, 750–756 CrossRef CAS.
- B. Jin, J. Niu, J. Dai, N. Li, P. Zhou, J. Niu, J. Zhang, H. Tao, Z. Ma and Z. Zhang, Bioresour. Technol., 2018, 8–16 CrossRef CAS PubMed.
- A. Cesaro and V. Belgiorno, Chem. Eng. J., 2014, 240, 24–37 CrossRef CAS.
- K. S. Shin and H. Kang, Appl. Biochem. Biotechnol., 2003, 109, 227–239 CrossRef CAS PubMed.
- I. Toreci, K. J. Kennedy and R. L. Droste, Water Res., 2009, 43, 1273–1284 CrossRef CAS PubMed.
- X. Tian, A. P. Trzcinski, L. L. Lin and W. J. Ng, J. Environ. Sci., 2015, 33, 29–38 CrossRef PubMed.
- V. K. Tyagi and S.-L. Lo, Rev. Environ. Sci. Bio/Technol., 2011, 10, 215–242 CrossRef CAS.
- Y. Yan, H. Chen, W. Xu, Q. He and Q. Zhou, Biochem. Eng. J., 2013, 70, 127–134 CrossRef CAS.
- X. Wang, X. Duan, J. Chen, K. Fang, L. Feng, Y. Yan and Q. Zhou, Environ. Technol., 2016, 37, 1520–1529 CrossRef CAS PubMed.
- L. Y. Feng, L. Q. Yang, L. X. Zhang, H. L. Chen and J. Chen, Water Sci. Technol., 2013, 68, 1591–1598 CrossRef CAS PubMed.
- D. Bolzonella, P. Pavan, P. Battistoni and F. Cecchi, Process Biochem., 2005, 40, 1453–1460 CrossRef CAS.
- J. Hong and X. Li, Waste Manage., 2011, 31, 1364–1371 CrossRef CAS PubMed.
- F. Y. G. Becerra, E. J. Acosta and D. G. Allen, Bioresour. Technol., 2010, 101, 6972–6980 CrossRef PubMed.
- J. Kim, Y. Yu and C. Lee, Bioresour. Technol., 2013, 144, 194–201 CrossRef CAS PubMed.
- H. Li, C. Li, W. Liu and S. Zou, Bioresour. Technol., 2012, 123, 189–194 CrossRef CAS PubMed.
- W. Bi, Y. Li and Y. Hu, Bioresour. Technol., 2014, 166, 1–8 CrossRef CAS PubMed.
- Y. Li, Y. Hu, G. Wang, W. Lan, J. Lin, Q. Bi, H. Shen and S. Liang, Chem. Eng. J., 2014, 255, 365–371 CrossRef CAS.
- Z. Lu, X. Zhou and J. Wu, Chin. J. Environ. Eng., 2011, 5, 1115–1118 CAS.
- F. S. Wei, Standard methods for the examination of water and wastewater, Ministry of Environmental Protection, Beijing, China, 2002 Search PubMed.
- Y. L. He, Anaerobic wastewater treatment, Chinese Light Industry Press, Beijing, China, 1998 Search PubMed.
- H. Zhu, W. Parker, R. Basnar, A. Proracki, P. Falletta, M. Beland and P. Seto, Int. J. Hydrogen Energy, 2008, 33, 3651–3659 CrossRef CAS.
- S. Karnchanawong, T. Mongkontep and K. Praphunsri, J. Cleaner Prod., 2017, 146, 14–19 CrossRef CAS.
- B. Xiao, Q. Dai, X. Yu, P. Yu, S. Zhai, R. Liu, X. Guo, J. Liu and H. Chen, J. Hazard. Mater., 2018, 343, 347–355 CrossRef CAS PubMed.
- E. Alkaya and G. N. Demirer, Renewable Energy, 2011, 36, 971–975 CrossRef CAS.
- D. Zhang, Y. Chen, Y. Zhao and Z. Ye, Environ. Sci. Technol., 2011, 45, 803–808 CrossRef CAS PubMed.
- C. Park, C. Lee, S. Kim, Y. Chen and H. A. Chase, J. Biosci. Bioeng., 2005, 100, 164–167 CrossRef CAS PubMed.
- A. Tiehm, K. Nickel, M. Zellhorn and U. Neis, Water Res., 2001, 35, 2003–2009 CrossRef CAS PubMed.
- D. Zhang, Y. Chen, Y. Zhao and X. Zhu, Environ. Sci. Technol., 2010, 44, 4802–4808 CrossRef CAS PubMed.
- J. M. Fernandez, N. Senesi, C. Plaza, G. Brunetti and A. Polo, Pedosphere, 2009, 19, 281–291 CrossRef.
- R. Gebauer and B. Eikebrokk, Bioresour. Technol., 2006, 97, 2389–2401 CrossRef CAS PubMed.
- S. A. Mirbagheri, M. K. Poshtegal and M. S. Parisai, Desalination, 2010, 256, 70–76 CrossRef CAS.
- J. Q. Zou, Industrial wastewater treatment technology, Chemical Industry Press, Beijing, China, 2003 Search PubMed.
Footnote |
| † Electronic supplementary information (ESI) available. See DOI: 10.1039/c8ra06726k |
| This journal is © The Royal Society of Chemistry 2018 |

