 Open Access Article
Study on the blockage mechanism of carbon dioxide hydrate slurry and its microscopic particle characteristics
Xiaofang Lv *a,
Wenqing Lib,
Bohui Shi
 c and
Shidong Zhoua
aJiangsu Key Laboratory of Oil and Gas Storage & Transportation Technology, School of Petroleum Engineering, Changzhou University, Changzhou, Jiangsu 213016, China. E-mail: lvxiaofang5@cczu.edu.cn; lvxiaofang5@126.com; Tel: +86-0519-8329-0280
bChina Petroleum Technology & Development Corporation, African Branch Corporation, Beijing 100028, China
cTechnology National Engineering Laboratory for Pipeline Safety, China University of Petroleum, Beijing 102249, China
First published on 1st November 2018
Abstract
In order to better understand the process of carbon dioxide hydrate formation and blockage, a series of experiments were performed in a high pressure hydrate experimental loop which has been constructed. The impacts of varying flow rate, pressure, and restarting of the pump on the plugging have been studied in this paper. The particle chord length distribution in the process of hydrate formation and blockage was monitored in real time by using the advanced device, Focused Beam Reflectance Measurement (FBRM). The results showed that the time taken for hydrate blockage to occur would significantly decrease at higher pressure, which meant higher pressure promoted the occurrence of hydrate blockage. At the same time, the time needed for carbon dioxide hydrate blockage increased with the flow rate. That is, the time for hydrate blockage increased when the flow rate changed from 754 kg h−1 to 1657 kg h−1. And once the pipeline has been blocked, restarting the pump may make the problem more serious. In addition, particle agglomeration led to a significant change in the particle chord length distribution during the process of hydrate formation and blockage, and the hydrate particle coalescence was the key cause of the hydrate plugging.
1. Introduction
Clathrate hydrates are crystalline solids resulting from the arrangement of water molecules related by hydrogen bonds constituting cages around stabilizing gas molecules.1 Over the past decade, gas hydrates have been the focus of attention in various fields.2 For example, hydrate-based technology is a promising method for CO2 capture and storage3–9 (CCS), which is a novel concept that uses CO2 hydrate to trap CO2 molecules in a lattice of water molecules. CO2 hydrate can form under high pressure and low temperature with the presence of water. It is also a potential technology10–15 for CO2 capture from CO2-containing gas streaming (CO2/N2 or CO2/H2) or CO2 storage as a hydrate form in ocean and marine sediments.16,17 Nowadays, there are some remarkable achievements in this CO2 capture and storage and gas separation field.1At the same time, CO2 hydrate technology is also used in the refrigeration field.18 Due to the uncertainty surrounding the cost and availability of new refrigerants, secondary refrigeration could be considered as an alternative solution. This technology is effectively based on the use of an environmentally-friendly secondary fluid whose role is to transport cold energy from the place of production (engine room) to places of use.19 Thus, secondary refrigeration makes it possible to limit the amount of primary refrigerant used and to confine it. In slurry systems, such as CO2 hydrate slurry,20 energy is stored during the phase change of the storage material dispersed in a carrier liquid (continuous phase). Phase change material (PCM) slurry has a higher energy density than single-phase secondary refrigerants due to both the sensible and latent heat capacities. One of the advantages of CO2 hydrate slurry is that mechanical processes such as scraped- or brushed-surface heat exchangers are not required to produce it, unlike ice slurry. It also forms at temperatures higher than 273 K, which makes it suitable for air-conditioning applications.21,22 But whatever the type of secondary refrigeration application, slurry flow properties are of paramount importance to assess the overall feasibility of the process. Previous studies performed have shown that CO2 hydrate slurry in the aqueous phase can agglomerate in a dynamic loop,23–25 and even form plugs as in pipelines26 at a high hydrate fraction of 20 vol% (with a stirred tank reactor) or from a small hydrate fraction of 5–10 vol%.
In addition, hydrate formation and blockage in pipelines has been a trouble for onshore and offshore petroleum production for a long time.27 Especially as offshore oil and gas production moves towards the deep water, the risk of plugging due to gas hydrate formation remains one of the most common flow-assurance problems in deep-water subsea oil and gas operations.28 Due to the potentially severe economic impact of forming a gas hydrate plug, it is critical to understand gas hydrate formation and accumulation mechanisms in flowlines. Many researches have been published about the plug and blocking of natural gas hydrates in different flow system.29–34 However, few researches have been reported about the flow stability of CO2 hydrate slurry. Meanwhile, the flow characteristics of CO2 hydrates slurry are critical for being as a secondary two-phase refrigerant in refrigeration process to ensure a continuous cooling conveying, especially the rheological property.23–25 If blocking happens in the CO2 hydrate slurry, restart the system immediately would be a general solution for recovering the flow ability of the system. But in fact, what would occur after restart the blocking system is not known clearly. Moreover, the study about the influence factor of the CO2 hydrate blockage time is only on the stage of qualitative without quantitative realizations. For example: how much the blockage time will be reduced by the improvement of the pressure? How much the blockage time will be increased by the increase of the flow rate? Therefore, according to the above situation, this paper performed a series of experiments on hydrate blockage time in a water–CO2 system, studied the quantitative influence of the factor such as pressure, flow rate on the hydrate plugging time and represented the change of the particle size due to the particle aggregation in the process of blockage. Here, the CO2–water system was used mainly based on the safety consideration, and it was also to compare with the natural gas hydrate blockage research to considerate the influence of the hydrate structure on the blockage experiment.
2. Experimental apparatus and materials
2.1 High pressure hydrate experimental loop
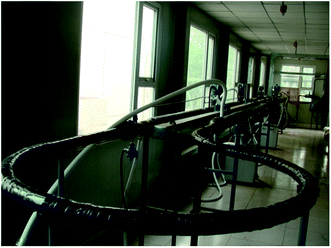
Experimental tests have been performed with the high pressure hydrate experimental loop devoted to Flow Assurance studies (Fig. 1). The loop, in which gas and liquid are separately injected by a plunger compressor and a custom-made magnetic centrifugal pump, is constituted of a test section. Two sight glasses are set in the test sections. The gas injection point is considered as the inlet of the test section. At the outlet of the test section, gas and liquid are collected in an insulated separator and re-directed to the test section towards the compressor and the pump. Several gas tanks allow maintenance of loop and/or separator pressure as hydrate is forming.The test section is a stainless steel pipe, the internal diameter of which is 2.54 cm (1 inch) and the length 30 m. Geometrically it is constituted of two rectilinear and horizontal parts, connectedly a circular one with a low curvature. It is connected to a separator. The test section is surrounded by a 5.08 cm (2 inches) diameter jacket in which a calorific water/glycol blend circulates in counter-current. Process temperature can be controlled from −20 to 80 °C.
This experimental flow loop is equipped with several sensors. Thermocouples are regularly set along the pipe, inside the separator, inside the water/glycol system and on the different gas utilities. A Coriolis flowmeter measures the density of the liquid mixture and the flow rate. The mean density of the multiphase fluid can also be measured using two FM1000 gamma ray densitometers. Differential pressure sensors are located along the loop to follow the evolution of the linear pressure drop along the loop. A rapid data acquisition is used and permits to detect rapid phenomena.
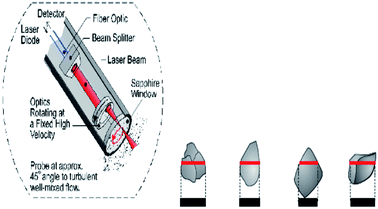
The evolution of objects (droplets, bubbles and solid particles) carried inside the flow can be followed thanks to a FBRM (Focused Beam Reflectance Measurements, Mettler-Toledo Lasentec® Product, Group-Lasentec® D600) probe which was recently installed on the loop. This apparatus comprises a low intensity rotating LASER beam (Fig. 2) which is reflected when intercepting a particle. From the reflection time a chord length is deduced. After every measurement duration which was chosen equal to 10 s, a Chord Length Distribution (CLD) and a mean chord length are given. This CLD gives an idea of the Particle Size Distribution (PSD) of the objects carried by the flow. The lower and upper limits of the FBRM CLD are 0.5 and 1000 μm, respectively. The probe window of probe cuts the flow streamlines at an angle of 45° and reaches the centre of the pipe. The RBRM probe was used to estimate the initial water droplet (Dp) size inside the fluid and to follow the hydrate particles agglomeration with the time. The mean square-weighted chord length can give more weight to the longer chord length and it is particularly well adapted to agglomeration phenomena. The mathematical expressions of the square-weighted mean chord lengths are given below:
 | (1) |
With Mi the center of the ith interval and yi the probability of measuring a chord included in the ith interval.
2.2 Fluids
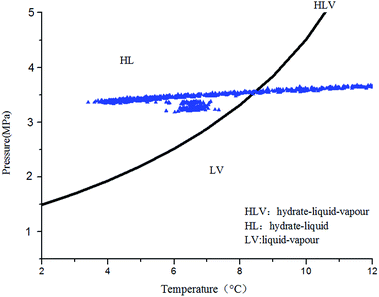
To better simulate the practical situation, tap water and CO2 (purity 99%)—which are known as the formation materials of the structure I hydrate—were adopted as the test fluids in the experiments. Preliminary Chen-Guo model9 permitted to determine the curve of hydrate formation (Fig. 3) of the defined natural gas composition.2.3 Procedure of the experiments
(1) The entire experimental loop is vacuumed until the vacuum degree reaches 0.09 MPa.(2) Load the tap water of 85 L into the separator, and turn on the magnetic pump to circulate the tap water fluid at constant flow rate (such as: 754 kg h−1, 1041 kg h−1, 1375 kg h−1, 1657 kg h−1).
(3) Open the temperature control device, and set the experimental initial temperature (T0) of the water bath system as around 20 °C.
(4) When the loop temperature reaches to T0, and start the data acquisition system. At the same time, turn on the Focused Beam Reflectance Measurements to monitor the chord length distribution in fluid until the average chord length of fluid fluctuates in ±0.2 μm.
(5) Through pressure reducing valve, gas is injected into the separator until the pressure reaches the setting experimental pressure P (2.8 and 3.8 MPa in this paper). The setting value of the temperature control device is lowered to the experimental final target temperature Tc (for example: 2 °C), so that to cool down the loop as well as the fluids.
(6) When a set of the experiment of hydrate formation is finished, the setting value of the temperature control device is turned up again, from Tc to T0. Repeat steps (1–4) for the next set after hydrate dissociation. Each group experiment lasts about 3–6 hours.
3. Results and discussion
3.1 The blockage mechanism of CO2 hydrate plugging and effect of restarting
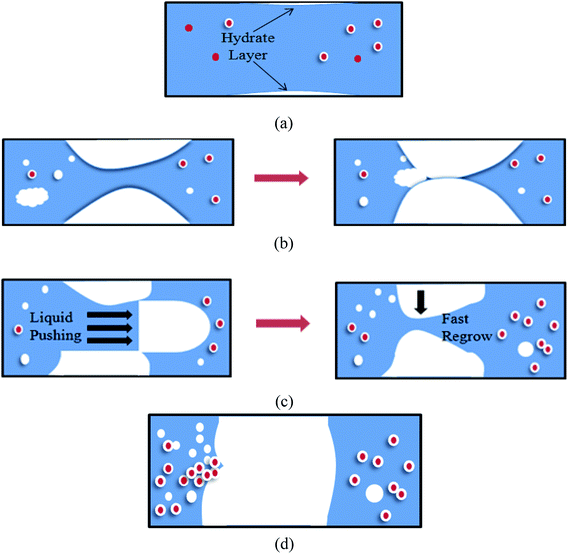
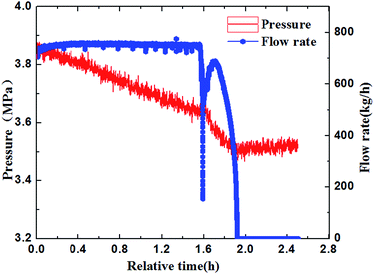
Through the experimental observation from the sight glass in our loop, the block process of water + CO2 system could be divided into four periods, as shown in Fig. 4a–d. (a) Water in the pipe wall section reacted with CO2 firstly and generated a thin layer of hydrate. (b) The water near the hydrate layer continued to react with the dissolved CO2 and the hydrate continuously adhered to the hydrate layer. The hydrate layer was getting thicker gradually and finally blocked the pipe.30 (c) When the pump restarted, the fluid could wash away the hydrate stemming. Some hydrates were washed away, while some might accumulate at the back of the blockage and increase the contact area. (d) Hydrate formed near the increscent contact area and adhered on it continuously, and finally blocked the pipe again. After restarting of the pump made the flow rate resume again, the recovery of flow rate would continue to drop down to zero, and a second blockage happened. Furthermore, it can no longer make the fluid flow again after the second hydrate blockage by raising the pump frequency. That means that the secondary restarting of the pump can lead to a serious hydrate blockage accident.283.2 The influence of the flow rate on the blockage of hydrate
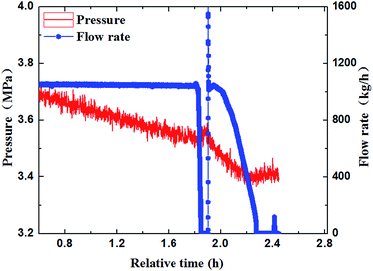
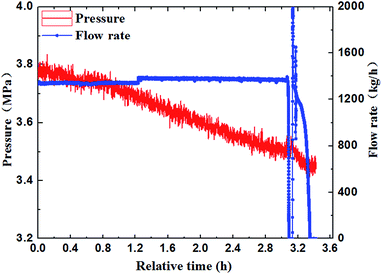
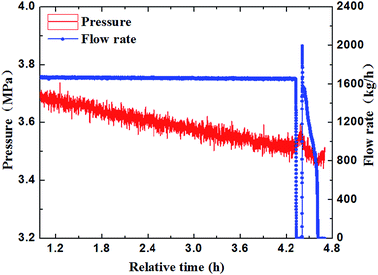
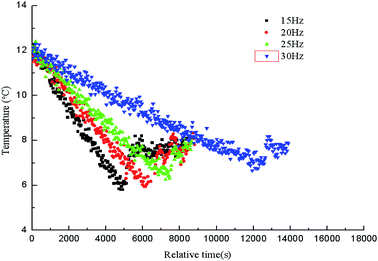
The paper changed the initial flow rate of the system (15 Hz/754 kg h−1, 20 Hz/1041 kg h−1, 25 Hz/1375 kg h−1, 30 Hz/1657 kg h−1) to study its effects on the formation, blockage temperature and blockage time of carbon dioxide hydrate under the same conditions,as shown in Fig. 5–8. According to the above four graphs, the system with different flow rates began to plug at 3.5 MPa, and the corresponding CO2 hydrate formation temperature was about 8.4 °C (Fig. 3) under this pressure. It was found that the flow rate nearly remained unchanged before the formation of hydrate, but quickly dropped to zero when hydrate begins to form in large quantities, then plugged the flow loop. At the same time, the temperature at which hydrate begins to form in large quantities keeps increased with the increased flow rate, which was shown in Fig. 9. Due to the shortage of heat transfer time for flowing medium under large flow rate condition, cooling efficiency was weakened, the subcooling degree decreased, which further resulted in decreasing in the driving force hydrate formation rate, ultimately caused an increase in the plugging time. On the other hand, the larger flow rate increased the gas–liquid contacting area and the number of nucleation sites, enhancing mass transfer between liquid and gas, which helped the formation of hydrate. However, the stronger shear action could delay or inhibit the formation rate of nucleation sites on gas–liquid contacting surface, made it difficult to meet the critical dimensions for hydrate formation, thus extended the induction period. At the same time, the larger flow rate had stronger entrainment and shear ability, reduced the coalescence and deposition of hydrate particles, made it difficult to block the loop, which caused an increase of the plugging time.It could be concluded from Fig. 5–8 that under certain pressure and relatively low flow rate (15 Hz/20 Hz), the time from the beginning of hydrate formation in large quantities to the blockage of the pipeline was nearly the same (approximately 0.25 h), and the plugging time was short, while this time was longer under high flow rate (about 1.17 h). Therefore, it might exist a critical flow rate in the process of hydrate blockage, below which the plugging time was relatively short.35 The curve of the temperature when hydrate begins to form in large quantities and plugging time with the variation of flow rate was shown in Fig. 10. It could be concluded that the temperature mentioned above and the plugging time increased with the increase of flow rate. Besides, the plugging time increased remarkably when the flow rate increased. So, a proper high flow rate could extend the plugging time, reduce the possibility of the occurrence of plugging in pipeline operation.32
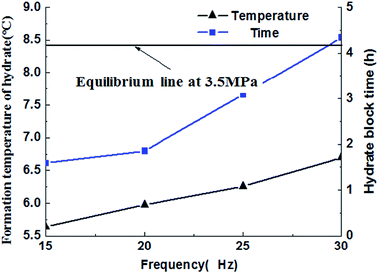 | ||
| Fig. 10 Hydrate formation temperature and blockage time as the functions of relative time with different initial frequencies. | ||
3.3 The influence of pressure on the blockage of hydrate
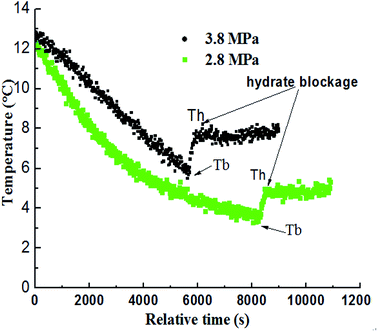
In order to further study the experiments of CO2 hydrate blockage under different pressure, a series of hydrate plugging experiments were carried out with 2.8 MPa and 3.8 MPa. Fig. 10 showed that the temperature of the system went up due to the large amount of heat released by hydrate particles crystallization. So the temperature when hydrate began to form in large quantities was defined as Tb, and the time that the hydrate blocked the pipe was defined as Th. As shown in Fig. 11, the Tb under high pressure was higher than the low pressure; the Th under high pressure was about 1.7 hours, while it was about 2.4 hours under the low pressure. Obviously, the blockage time under high pressure was less than the low pressure, and the supercooling degree needed for the hydrate formation was also lower under high pressure.27 The value of Tb and Th under different pressure was shown in Table 1. It could be concluded that the needed supercooling degree decreased with the pressure increased under the same flow rate, so the hydrate was easier to form, and there was a relatively short hydrate blockage time. Therefore, the factor of pressure had a remarkable influence on the hydrate formation and the blockage of the pipe.28,31–34| Pressure (MPa) | Time of blockage | Subcooling degree | The temperature of the begin hydrate formation |
|---|---|---|---|
| 3.8 | 1.7 h | 3.0 °C | 6.0 °C |
| 2.8 | 2.4 h | 3.7 °C | 3.3 °C |
3.4 The micro characteristic during the CO2 hydrate formation
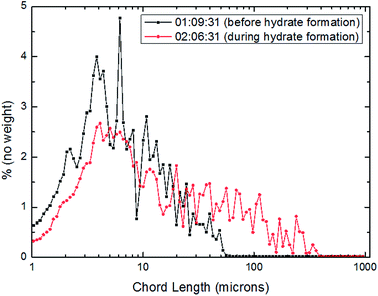
 | ||
| Fig. 12 Distribution of particles/droplets chord length before and after CO2 hydrate formation (10 Hz/450 kg h−1). | ||
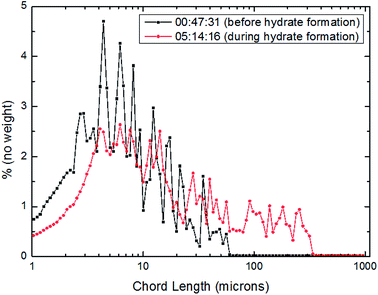
 | ||
| Fig. 13 Distribution of particles/droplets chord length before and after CO2 hydrate formation (15 Hz/754 kg h−1). | ||
 | ||
| Fig. 14 Distribution of particles/droplets chord length before and after CO2 hydrate formation (20 Hz/1041 kg h−1). | ||
For the further explanation of the phenomenon that under the different flow rates, the number of large particles in the system increased after hydrate formation, a method of square weighted particle chord length was introduced here in order to significantly characterize the changing trend of large particle chord length after hydrate formation.36 The details were shown as Fig. 15–17.
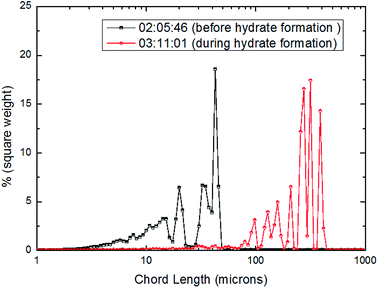 | ||
| Fig. 15 Distribution of square weighted particles/droplets chord length before and after CO2 hydrate formation (10 Hz/450 kg h−1). | ||
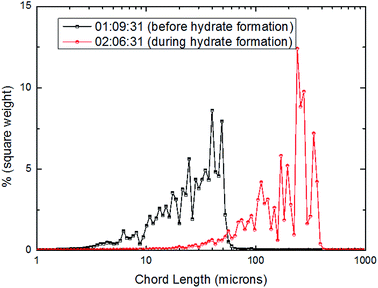 | ||
| Fig. 16 Distribution of square weighted particles/droplets chord length before and after CO2 hydrate formation (15 Hz/754 kg h−1). | ||
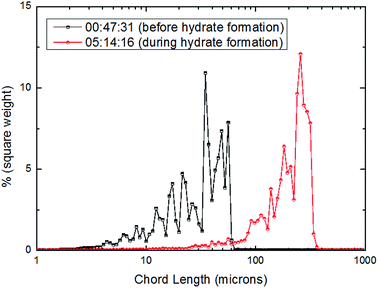 | ||
| Fig. 17 Distribution of square weighted particles/droplets chord length before and after CO2 hydrate formation (20 Hz/1041 kg h−1). | ||
From Fig. 15–17, it could be seen that the distribution of large particle chord length have changed significantly after CO2 hydrate formation. The distribution of large particle chord length concentrated in the range from 10 to100 microns before CO2 hydrate formation, while it was mainly in the range from 100 to 400 microns after CO2 hydrate formation. That is, the distribution of large particle chord length moved to the right side obviously after CO2 hydrate formation. This trend has been confirmed by some researchers.23,29,31–36
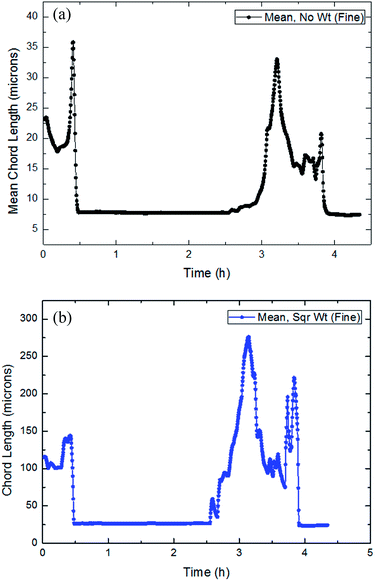 | ||
| Fig. 18 The trend of the average and square weighted particles/droplets chord length distribution with time in flow rate (10 Hz/450 kg h−1: a and b). | ||
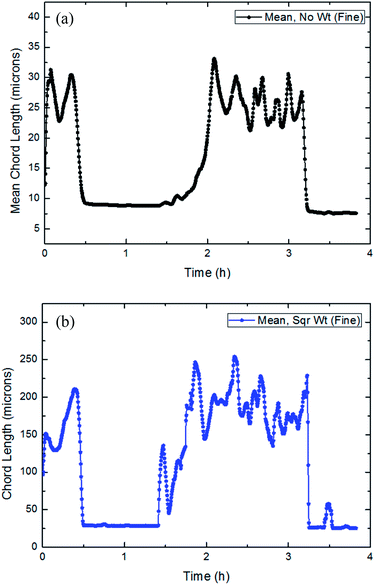 | ||
| Fig. 19 The trend of the average and square weighted particles/droplets chord length distribution with time in flow rate (15 Hz/754 kg h−1: a and b). | ||
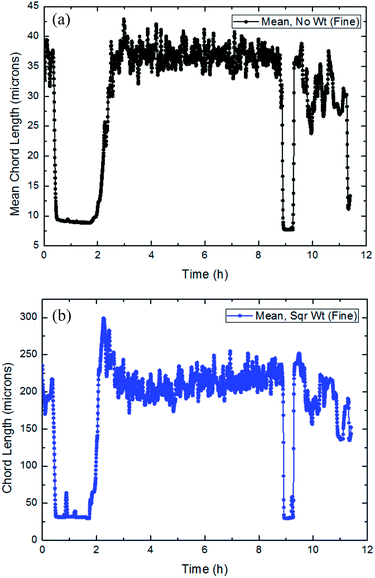 | ||
| Fig. 20 The trend of the average and square weighted particles/droplets chord length distribution with time in flow rate (20 Hz/1041 kg h−1: a and b). | ||
It could be concluded from Fig. 18–20 that throughout the entire process of CO2 formation, both the average particle chord length and square weighted particle chord length have experienced a vibrated period with initial dissolved gas, a stable stage before formation and a fluctuated period with large particles' breakage after the formation.
Average particle chord length of this system remained essentially between 9–10 microns in the stable stage before hydrate formation, when square weighted particle chord length was basically between 25–35 microns. While after the CO2 formation, average particle chord length vibrated between 15–40 microns, when square weighted particle chord length changed between 150–300 microns.
During the CO2 hydrate formation, both average particle chord length and square weighted particle chord length changed significantly, which powerfully proved the existence of the phenomena that the particles collided and coalesced at the same time.30 And according to the variations of the average particle chord length and square weighted particle chord length, it was possible to predict the strength of the particle collision and coalescence, then to quantify the risk of pipeline hydrate plug.35 At the same time, it also could be seen that the square weighted particle chord length had earlier as well as greater changes than the average particle chord length. It proved that square weighted particle chord length was more sensitive to the collision and coalescence of particles.33,36
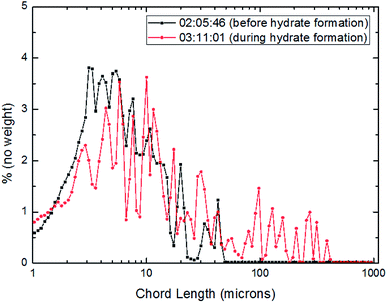
The fluctuated period after hydrate formation reflected that the large particles experienced breakage and coalescence at the same time under the shear effect, which was a dynamic equilibrium process, as shown in Fig. 21.
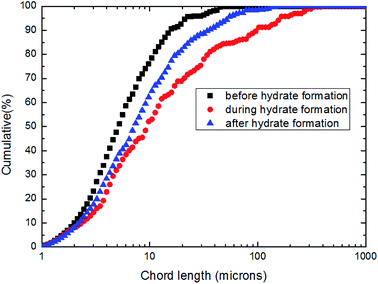 | ||
| Fig. 21 The cumulative particles/droplets chord length distribution before and during CO2 hydrate formation (10 Hz/450 kg h−1). | ||
Fig. 21 showed that the share of large particles increased notably at the beginning of hydrate formation period, indicating the coalescence of hydrate particles. When it arrived at stable phase, the accumulated percentage curve of particle chord length moved left, implying reduced number of large particles. This was due to the larger particles were broken under the shear effect. Despite of less large particles, the accumulated percentage curve of particle chord length was still on the right side of the curve which was produced before hydrate formation.
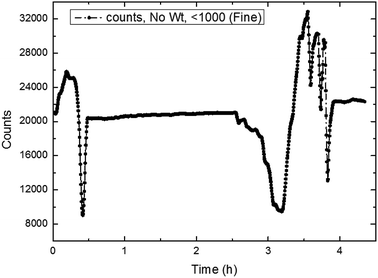 | ||
| Fig. 22 The trend of total number of particles/droplets during the process of CO2 hydrate formation (10 Hz/450 kg h−1). | ||
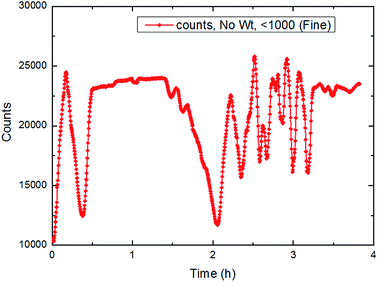 | ||
| Fig. 23 The trend of total number of particles/droplets during the process of CO2 hydrate formation (15 Hz/754 kg h−1). | ||
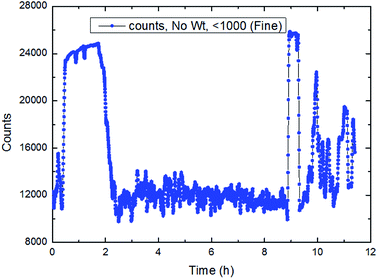 | ||
| Fig. 24 The trend of total number of particles/droplets during the process of CO2 hydrate formation (20 Hz/1041 kg h−1). | ||
It could be seen in Fig. 22–24 that the number of particles/droplets in the system was roughly between 21![[thin space (1/6-em)]](https://www.rsc.org/images/entities/char_2009.gif) 000–24
000–24![[thin space (1/6-em)]](https://www.rsc.org/images/entities/char_2009.gif) 000 in the stable stage before hydrate formation; while it reduced significantly in the process of hydrate formation to about 10
000 in the stable stage before hydrate formation; while it reduced significantly in the process of hydrate formation to about 10![[thin space (1/6-em)]](https://www.rsc.org/images/entities/char_2009.gif) 000–12
000–12![[thin space (1/6-em)]](https://www.rsc.org/images/entities/char_2009.gif) 000. Moreover the number of particles/droplets in the system vibrated markedly after the hydrate formation due to large particles was broken under the shear effect. Therefore, we could monitor the total number of particles at all times during the experiments so as to predict and characterize the hydrate formation process.
000. Moreover the number of particles/droplets in the system vibrated markedly after the hydrate formation due to large particles was broken under the shear effect. Therefore, we could monitor the total number of particles at all times during the experiments so as to predict and characterize the hydrate formation process.
4. Conclusions
(1) The CO2 hydrates might generate somewhere at the pipe wall and then they gather together and finally block the pipe. Once a blockage happened, restarting of the pump was not only of no sense, but also might make this problem more serious.(2) Under the same pressure condition, faster flow rate could weaken the driving force of hydrate formation, increase the starting temperature of blockage and lengthen the duration of the first plugging. Increasing velocity could promote the shear of fluid to the pipe wall, but this effect was not very obvious during the plugging and gathering process. With the increase of the flow rate, the inducing time of hydrate formation would prolong, and the influence of shear on nucleation would be more obvious.
(3) Also, the dimensions of particles in the fluid have been changing throughout the hydrate formation process. It might be inferred that the occurrence of hydrate blockage was time dependent, and its relative time was affected by pressure as well as flow rate in the system.
Conflicts of interest
There are no conflicts to be declare.Acknowledgements
This work was supported by the National Science Foundation for Young Scientists of China (Grant No. 51804046), PetroChina Innovation Foundation (Grant No. 2018D-5007-0602) and Natural Science Research Project of Jiangsu Colleges and Universities (Grant No. 18KJB440001).References
- Z. W. Ma, P. Zhang, H. S. Bao and S. Deng, Review of fundamental properties of CO2 hydrates and CO2 capture and separation using hydration method, Renewable Sustainable Energy Rev., 2016, 53, 1273–1302 CrossRef CAS.
- J. Oignet, A. Delahaye and J. Torre, et al., Rheological study of CO2 hydrate slurry in the presence of Sodium Dodecyl Sulfate in a secondary refrigeration loop, Chem. Eng. Sci., 2017, 158, 294–303 CrossRef CAS.
- M. Bai, Z. Zhang and X. Fu, A review on well integrity issues for CO2 geological storage and enhanced gas recovery, Renewable Sustainable Energy Rev., 2016, 59, 920–926 CrossRef CAS.
- L. Li, N. Zhao and W. Wei, et al., A review of research progress on CO2 capture, storage, and utilization in Chinese Academy of Sciences, Fuel, 2013, 108, 112–130 CrossRef CAS.
- D. Zhong, Z. Li and Y. Lu, et al., Investigation of CO2 Capture from a CO2 + CH4 Gas Mixture by Gas Hydrate Formation in the Fixed Bed of a Molecular Sieve, Ind. Eng. Chem. Res., 2016, 55(29), 7973–7980 CrossRef CAS.
- P. Babu, R. Kumar and P. Linga, Pre-combustion capture of carbon dioxide in a fixed bed reactor using the clathrate hydrate process, Energy, 2013, 50, 364–373 CrossRef CAS.
- H. Dashti, L. Zhehao and X. Lou, Recent advances in gas hydrate-based CO2 capture, J. Nat. Gas Sci. Eng., 2015, 23, 195–207 CrossRef CAS.
- B. Castellani, M. Filipponi and A. Nicolini, et al., Carbon Dioxide Capture Using Gas Hydrate Technology, J. Energy Power Eng., 2013, 7, 883–890 CAS.
- N. H. Duc, F. Chauvy and J. M. Herri, CO2 capture by hydrate crystallization-A potential solution for gas emission of steelmaking industry, Energy Convers. Manage., 2007, 48, 1313–1322 CrossRef CAS.
- S. Tomita, S. Akatsu and R. Ohmura, Experiments and thermodynamic simulations for continuous separation of CO2 from CH4 + CO2 gas mixture utilizing hydrate formation, Appl. Energy, 2015, 146, 104–110 CrossRef CAS.
- A. Eslamimanesh, A. H. Mohammadi and D. Richon, et al., Application of gas hydrate formation in separation processes: A review of experimental studies, The Journal of Chemical Thermodynamics, 2012, 46, 62–71 CrossRef CAS.
- P. Babu, P. Linga and R. Kumar, et al., A review of the hydrate based gas separation (HBGS) process for carbon dioxide pre-combustion capture, Energy, 2015, 85, 261–279 CrossRef CAS.
- C. Xu, Z. Y. Chen and J. Cai, et al., Study on Pilot-Scale CO2 Separation from Flue Gas by the Hydrate Method, Energy Fuels, 2014, 28, 1242–1248 CrossRef CAS.
- X. S. Li, Z. M. Xia and Z. Y. Chen, et al., Gas Hydrate Formation Process for Capture of Carbon Dioxide from Fuel Gas Mixture, Ind. Eng. Chem. Res., 2010, 49, 11614–11619 CrossRef CAS.
- Z. M. Xia, X. S. Li and Z. Y. Chen, et al., Hydrate-based Capture CO2 and Purification CH4 from Simulated Landfill Gas with Synergic Additives Based on Gas Solvent, Energy Procedia, 2014, 61, 450–454 CrossRef CAS.
- F. Qanbari, M. Pooladi-Darvish and S. H. Tabatabaie, CO2 disposal as hydrate in ocean sediments, J. Nat. Gas Sci. Eng., 2012, 8(8), 139–149 CrossRef CAS.
- A. C. Chow, E. E. Adams and P. H. Israelsson, et al., Carbon dioxide hydrate particles for ocean carbon sequestration, Energy Procedia, 2009, 1, 4937–4944 CrossRef CAS.
- S. Jerbi, A. Delahaye and J. Oignet, et al., Rheological properties of CO2 hydrate slurry produced in a stirred tank reactor and a secondary refrigeration loop, Int. J. Refrig., 2013, 36, 1294–1301 CrossRef CAS.
- J. Guilpart, E. Stamatiou and A. Delahaye, et al., Comparison of the performance of different ice slurry types depending on the application temperature, Int. J. Refrig., 2006, 29, 781–788 CrossRef CAS.
- L. Fournaison, A. Delahaye and I. Chatti, et al., CO2 hydrates in refrigeration processes, Ind. Eng. Chem. Res., 2004, 43, 6521–6526 CrossRef CAS.
- P. Zhang and Z. W Ma, An overview of fundamental studies and applications of phase change material slurries to secondary loop refrigeration and air conditioning systems, Renewable Sustainable Energy Rev., 2012, 16, 5021–5058 CrossRef CAS.
- Z. Youssef, A. Delahaye and L. Huang, et al., State of the art on phase change material slurries, Energy Convers. Manage., 2013, 65, 120–132 CrossRef CAS.
- A. Delahaye, L. Fournaison and S. Marinhas, et al., Rheological study of CO2 hydrate slurry in a dynamic loop applied to secondary refrigeration, Chem. Eng. Sci., 2008, 63, 3551–3559 CrossRef CAS.
- A. Delahaye, L. Fournaison and S. Jerbi, et al., Rheological properties of CO2 hydrate slurry flow in the presence of additives, Ind. Eng. Chem. Res., 2011, 50, 8344–8353 CrossRef CAS.
- S. Jerbi, A. Delahaye and J. Oignet, et al., Rheological properties of CO2 hydrate slurry produced in a stirred tank reactor and a secondary refrigeration loop, Int. J. Refrig., 2013, 36, 1294–1301 CrossRef CAS.
- A. K. Sum, D. T. Wu and K. Yasuoka, Energy science of clathrate hydrates: simulation based advances, MRS Bull., 2011, 36, 205–210 CrossRef CAS.
- E. D. Sloan and C. A. Koh, Clathrate hydrates of natural gases, 3rd edn, CRC Press, New York, 2008 Search PubMed.
- E. D. Sloan, C. A. Koh and A. K. Sum, et al., Natural Gas Hydrates in Flow Assurance, Elsevier, Amsterdam, Boston, Heidelberg, London, New York, Oxford, Paris, San Diego, San Francisco, Singapore, Sydney, Tokyo, 2010 Search PubMed.
- J. Chen, K. L. Yan and G. J Chen, et al., Insights into the formation mechanism of hydrate plugging in pipelines, Chem. Eng. Sci., 2015, 122, 284–290 CrossRef CAS.
- J. W. Nicholas, L. E. Dieker and E. D. Sloan, et al., Assessing the feasibility of hydrate deposition on pipeline walls-Adhesion force measurements of clathrate hydrate particles on carbon steel, J. Colloid Interface Sci., 2009, 331(2), 322–328 CrossRef CAS PubMed.
- J. W. Lachance, L. D. Talley and D. P. Shatto, et al., Formation of Hydrate Slurries in a Once-Through Operation, Energy Fuels, 2012, 26(7), 4059–4066 CrossRef CAS.
- Y. H. Sohn, J. Kim and K. Shin, et al., Hydrate plug formation risk with varying watercut and inhibitor concentrations, Chem. Eng. Sci., 2015, 126, 711–718 CrossRef CAS.
- X. Lv, B. Shi and Y. Wang, et al., Study on Gas Hydrate Formation and Hydrate Slurry Flow in a Multiphase Transportation System, Energy Fuels, 2013, 27(12), 7294–7302 CrossRef CAS.
- L. Ding, B. Shi and X. Lv, et al., Investigation of natural gas hydrate slurry flow properties and flow patterns using a high pressure flow loop, Chem. Eng. Sci., 2016, 146, 199–206 CrossRef CAS.
- W. Li, J. Gong and X. Lü, et al., A study of hydrate plug formation in a subsea natural gas pipeline using a novel high-pressure flow loop, Pet. Sci., 2013, 10, 97–105 CrossRef CAS.
- B. Shi, L. Ding and W. Li, et al., Investigation on hydrates blockage and restart process mechanisms of CO2 hydrate slurry flow, Asia-Pac. J. Chem. Eng., 2018, 13, e2193 CrossRef.
| This journal is © The Royal Society of Chemistry 2018 |

