 Open Access Article
Experimental study on hydrate anti-agglomeration in the presence of rhamnolipid
Guodong Houab,
Deqing Liang *b and
Xiaosen Lib
aDepartment of Thermal Science and Energy Engineering, University of Science and Technology of China, Hefei 230027, China
bKey Laboratory of Gas Hydrate, Guangzhou Institute of Energy Conversion, Chinese Academy of Sciences, Guangzhou 510640, People's Republic of China. E-mail: liangdq@ms.giec.ac.cn
First published on 27th November 2018
Abstract
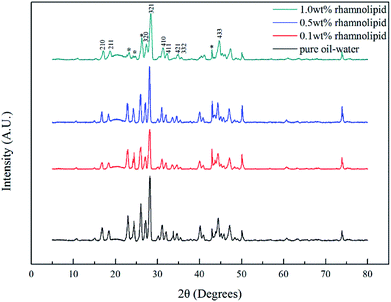
Gas hydrates might cause a potential safety hazard in subsea flow assurance. Anti-agglomeration is a promising approach to keep subsea oil and gas pipelines free from hydrate risks. Effective anti-agglomerants could prevent hydrate agglomeration of small crystallites by lowering the capillary force between hydrate particles. Biosurfactants are widely known for their eco-friendly nature. In this work, n-octane, water and methane were used as hydrate-forming ingredients to examine the effectiveness of rhamnolipid. Our investigation was carried out at constant high pressure (10 MPa) with different water cuts, subcooling degrees and rhamnolipid mass fractions. Three agglomeration states of hydrate were observed in a high-pressure visual autoclave apparatus. Torque measurements showed that rhamnolipid could effectively prevent hydrate agglomeration with a concentration of 0.5 wt%. In addition, the structural characteristics and morphology of hydrate were observed by use of powder X-ray diffraction, Raman spectroscopy and cryo-scanning electron microscopy. We noticed that the introduction of rhamnolipid had no effect on hydrate structure, but it could increase the large and small cavity ratio value and hydration number. Through the microscopic images, we inferred that rhamnolipid could make the surface of hydrate smooth, which resulted in a more ordered surface.
1. Introduction
Gas hydrates are crystalline inclusion compounds that are formed when light hydrocarbon molecules get trapped in hydrogen bonded cages formed by water molecules.1 In the past few decades, hydrate flow assurance issues have been a menace for the offshore oil and gas exploration and production industry because gas hydrates can easily form at high pressure and low temperature in subsea flowlines.2Traditional strategies of hydrate prevention include thermal insulation and electrical heating, and also thermodynamic inhibition by methanol and other thermodynamic hydrate inhibitors (THIs).3,4 The addition of THIs can shift the hydrate equilibrium conditions to higher pressure and lower temperature.3 Taking into account the high cost and serious environmental impacts of thermodynamic inhibition, low-dosage hydrate inhibitors (LDHIs) have been widely developed and applied.5 As an alternative to THIs, LDHIs do not change hydrate thermodynamic equilibrium but rather the formation kinetics or agglomeration states. LDHIs are generally subdivided into kinetic inhibitors (KHIs) and anti-agglomerants (AAs), and their effective concentration is relatively low (0.1–1.0 wt%).6 KHIs are water-soluble polymers that work by delaying hydrate formation (nucleation) as well as slowing the growth of hydrate crystals; AAs are generally surfactants that work by preventing hydrate particle agglomeration rather than preventing hydrate formation.7,8
In the 1990s, Shell calculated by standard nucleation theory that one cannot stop hydrates nucleating at subcoolings above 10 °C, so it was realized that KHIs cannot produce satisfactory results in deepwater projects. Thus, they turned their attention to developing useful AAs. They focused on alkylarylsulfonates, alkylglucosides and quaternary ammonium surfactants; the performance of the first two classes of AAs was mediocre, and Shell reasoned that quaternary ammonium surfactants would be ideal AAs.6 Some commercially available surfactants can keep hydrate particles suspended in oil emulsions. Huo et al. tested hydrate plug prevention by some commercial surfactants (Span20, Span40, Span60, Span80) and their synthesized chemical dodecyl-2-(2-caprolactamyl)ethanamide (CDDA). They point out that both commercial surfactants and synthesized ones have merits and demerits. Span chemicals are cheap but their effective concentrations have to be as high as 3 wt%. However, CDDA is effective at 0.75 wt%, but the cost of CDDA is much higher.9 Due to the low price of Span, Peng et al. adopted a new kind of AA, CAA, a mixture of Span20 and ester polymer with a mixing ratio of 4![[thin space (1/6-em)]](https://www.rsc.org/images/entities/char_2009.gif) :
:![[thin space (1/6-em)]](https://www.rsc.org/images/entities/char_2009.gif) 1. They investigated the flow characteristics, shut down/restart behavior, and morphology of hydrate slurries at different water cuts by using a flow loop device, and the results indicated a favorable effect of CAA on inhibiting hydrates.10 Lv et al. noticed that hydrates often form from water-in-oil emulsion and the measurement of slurry viscosity constitutes the basis for the application of hydrate slurry flow technology. They used a novel high-pressure viscometer to measure the viscosity of hydrate slurry produced by different combined sorbitan monolaurate AAs. Their study implies that AAs can notably affect the sensitivity of hydrate slurry viscosity to volume of hydrates and temperature.11 As time goes by, many researchers have concentrated on developing new AAs and combined AAs. A kind of AA extracted from a saponins plant developed by the Chemical Engineering Department of China University of Petroleum-Beijing12 was used by Shi et al. to prevent hydrate plugging.13 Kelland et al. have developed two new classes of AAs based on zwitterionic surfactants and alkylamide surfactants, the results indicating positive performance for some products but not as good as that of commercial quaternary ammonium-based surfactant AAs.14,15 Gas hydrate AA performance of a series of n-alkyltri(n-butyl)ammonium bromides has been studied. An optimum alkyl tail chain length for the anti-agglomerating efficacy of this surfactant class is found, and an increase salinity can improve their performance.16 The effects of commercial additives in water + oil systems have been evaluated. AEO-3 combined with some commercial additives exhibited good anti-agglomeration performance.17 Recently, Sun et al. and their research group have reported a new AA synthesized by Lubrizol Corporation and carried out a series of researches based on the new AA.18–21
1. They investigated the flow characteristics, shut down/restart behavior, and morphology of hydrate slurries at different water cuts by using a flow loop device, and the results indicated a favorable effect of CAA on inhibiting hydrates.10 Lv et al. noticed that hydrates often form from water-in-oil emulsion and the measurement of slurry viscosity constitutes the basis for the application of hydrate slurry flow technology. They used a novel high-pressure viscometer to measure the viscosity of hydrate slurry produced by different combined sorbitan monolaurate AAs. Their study implies that AAs can notably affect the sensitivity of hydrate slurry viscosity to volume of hydrates and temperature.11 As time goes by, many researchers have concentrated on developing new AAs and combined AAs. A kind of AA extracted from a saponins plant developed by the Chemical Engineering Department of China University of Petroleum-Beijing12 was used by Shi et al. to prevent hydrate plugging.13 Kelland et al. have developed two new classes of AAs based on zwitterionic surfactants and alkylamide surfactants, the results indicating positive performance for some products but not as good as that of commercial quaternary ammonium-based surfactant AAs.14,15 Gas hydrate AA performance of a series of n-alkyltri(n-butyl)ammonium bromides has been studied. An optimum alkyl tail chain length for the anti-agglomerating efficacy of this surfactant class is found, and an increase salinity can improve their performance.16 The effects of commercial additives in water + oil systems have been evaluated. AEO-3 combined with some commercial additives exhibited good anti-agglomeration performance.17 Recently, Sun et al. and their research group have reported a new AA synthesized by Lubrizol Corporation and carried out a series of researches based on the new AA.18–21
Quaternary ammonium salts (QAS) are claimed to be the most effective AAs at high subcooling, but their toxicity and low biodegradability limit their utilization.22 Because many AAs are toxic and have low biodegradability, the use of environmentally friendly AAs is required to be on the agenda. Biosurfactants are essentially green surfactants with biological origin. They not only have low toxicity and good compatibility with the environment, but also have good emulsification, dispersion, solubilization and other properties of common surfactants. Biosurfactants have promising development value in oil drilling, hydrate plug prevention and other fields and have been applied in the oil industry.23 York et al. are aware of the potential of rhamnolipids and notice that rhamnolipids will be studied further in the future. They examined the effectiveness of a QAS and a rhamnolipid biosurfactant, the visual observation measurements showing that a small concentration of QAS can prevent tetrahydrofuran (THF) hydrate agglomeration and 0.05 wt% can be regarded as an effective concentration for rhamnolipid.24 Rhamnolipid biosurfactant in cyclopentane hydrates is similar to THF hydrates, and as a co-surfactant, MeOH can improve the performance of rhamnolipid.25 Surfactants can generally promote the formation of hydrates, and the effects of the biosurfactant surfactin on methane hydrate formation kinetics have been investigated by Bhattacharjee et al.26 Jadav et al. investigated the influence of biosurfactants obtained during the cultivation of microorganisms on the formation kinetics of methane gas hydrate, results showing that biosurfactants are more efficient than sodium dodecylsulfate.27 Purified biosurfactant rhamnolipids can reduce the surface tension of water, and Arora et al. observed that 1000 ppm of rhamnolipid solution in C-type silica gel bed system increased the methane hydrate formation rate by 42.97%, reduced the induction time of hydrate formation by 22.63% and shifted methane hydrate formation temperature to higher values relative to water saturated system.28
The purpose of this work was to investigate hydrate anti-agglomeration in the presence of biosurfactant rhamnolipid. Macroscopic experiments were conducted under high pressure by a high-pressure visual autoclave. The influencing factors of water cut, subcooling and mass concentration of rhamnolipid were considered in our study. To further understand the hydrate microstructure and anti-agglomeration mechanism, powder X-ray diffraction (PXRD), Raman spectroscopy and cryo-scanning electron microscopy (cryo-SEM) were employed to determine the hydrate crystal structure and morphology.
2. Experimental methods
2.1. Experimental materials
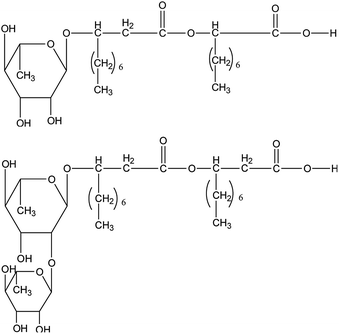
The biosurfactant rhamnolipid studied in this work was purchased from Xi'an Boliante Chemical Co. Ltd with a purity of 0.96 mass fraction. The rhamnolipid was a mixture of two forms and the chemical structures are shown in Fig. 1. The concentrations of rhamnolipid used were 0.1, 0.5 and 1.0 wt%. In all test mixtures, deionized water and n-octane were used as aqueous and oil phases, respectively. Deionized water with a resistivity of 18.25 mΩ cm−1 was produced by an ultrapure water system in our laboratory and n-octane was purchased from Shanghai Baishun Biological Technology Co. Ltd. CH4 gas with a stated purity of 99.9% was supplied by Shiyuan Gas Co. Ltd. Materials were weighed on an electronic analytical balance with an uncertainty of ±0.001 g and used without any further purification.2.2. Experimental apparatus
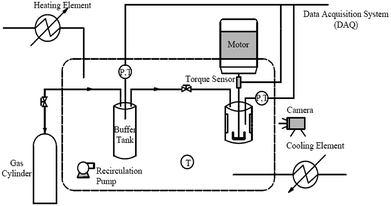
The experiments were carried out using a new fabricated high-pressure visual autoclave apparatus, a schematic diagram of which is shown in Fig. 2. A hydrate formation reactor was the core of the apparatus, it consisted of a cylindrical vessel made of 316 stainless steel and two transparent quartz windows (15 × 90 mm each). A total of 100 mL of solution was loaded into the reactor, which had a maximum effective volume of 328 mL. The reactor was designed to operate at pressures up to 20 MPa. A direct-current (DC) motor acting as a stirrer driver was positioned at the top of the reactor to provide sufficient agitation for hydrate formation. A torque sensor was connected below the stirrer driver to measure the torque changes of the hydrate slurry during the experiment. The miniature torque sensor (CYB-806s) was purchased from Beijing Westzh M&E Technology Ltd, with a range of 0–100 N cm and an uncertainty of 0.5%. To mix the liquid phase more effectively, a U-shaped impeller was located on the base of the solid shaft, and the stirring rate was maintained at 500 rpm for all experiments. The reactor was immersed in a glycol–water bath, containing an external heating and cooling system to maintain the temperature at a plateau. A platinum resistance thermometer with an uncertainty of ±0.1 K and a pressure transducer with an uncertainty of ±0.01 MPa were applied to monitor the temperature and pressure of the system. Temperature, pressure, torque data and process images were recorded throughout each experiment using a data acquisition system (DAQ).2.3. Experimental procedures
(1) The reactor was rinsed three times with distilled water. The reactor was loaded with 100 mL of aqueous solution and n-octane at the desired volumetric ratio after the reactor was dried completely.
(2) In all experiments, the reactor was cooled to the set point temperature over 60 min.
(3) The reactor was purged with methane gas and evacuated by a vacuum pump three times to fully exhaust the air.
(4) The reactor was then pressurized to the desired pressure (10 MPa). Once the temperature and pressure changes caused by the introduced gas phase were eliminated, the stirrer was engaged at 500 rpm.
(5) The end of the formation of hydrate could be verified by the occurrence of stabilized temperature and pressure.
(6) The pressure, temperature and torque were continuously recorded at 10 seconds intervals over the entire experiment.
PXRD was used to determine the structural characteristics of the hydrate samples with an X'pert Highscore Plus (PANalytical) diffractometer. The measurements were carried out in the θ/2θ step scan mode with a step width of 0.017° over a 2θ ranges of 5–80° using Cu Kα radiation (λ = 1.5406 Å) and parallel beam optics at 203.15 K at atmospheric pressure. After the hydrate samples were taken out and ground into fine powder, about 100 mg of powder sample was loaded into the sample holder. The temperature was maintained by a liquid nitrogen flow during the experiment. Raman spectra were taken with a confocal Raman spectrometer (LabRAM HR, Horiba) equipped with a multichannel air-cooled charge-coupled device detector. An Ar+ laser (532 nm) was used as the excitation source with a maximum power of 50 mW. The powder samples used for Raman analysis were slightly thicker than those used for PXRD analysis. About 50 mg of power sample was loaded into a removable sapphire sample holder and the laser beam was allowed to focus on the hydrate surface. The sapphire sample holder was fixed in a temperature-controlled stage (203.15 K), which was also cooled by a liquid nitrogen flow. The structure type and relative cage occupancy of hydrate samples could be determined from Raman spectrum analysis. Cryo-SEM (S-4800, Hitachi) was used to observe the microscopic morphology of the hydrate samples. A small bulk sample (about 50 mg) wrapped in foil was loaded into a copper sample holder. The foil was used to wrap the sample and prevent the sample from falling. Then, the sample was opened from the foil and fed into the observation stage. The whole observation was obtained at 100 K in a vacuum environment.
3. Results and discussion
3.1 Macroscopic experiments
In this study, the results of hydrate formation kinetics were obtained with isovolumetric experiments at constant temperature. Based on torque change during the experiments and visual observations, the effectiveness of biosurfactant rhamnolipid at various testing conditions could be judged. Since each experiment involved a large subcooling and maintained a vigorous agitation (500 rpm), the hydrate was rapidly formed after the start of the agitation. Pressure and temperature profile with a sharp pressure drop and temperature rise indicated hydrate formation. Through the transparent windows, the formation and plug of hydrate could be observed by the naked eye in real time. Fig. 3 presents the torque, pressure and temperature as a function of time for the experiment at 273.15 K. The rhamnolipid concentration and water-cut in this experiment were 0.1 wt% and 30%. The data presented in this work were obtained after the start of the agitation. As shown in Fig. 3, with the start of agitation, the pressure inside the reactor decreased rapidly which indicated the formation of hydrate.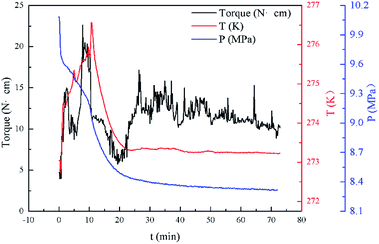 | ||
| Fig. 3 Example data observed during hydrate formation in the reactor for a 30% water-cut system at 273.15 K. | ||
As is well known, some commercial surfactants such as Span80 and Span40 can prevent hydrate agglomeration. In order to verify the performance of the biosurfactant rhamnolipid, we performed comparative experiments at 273.15 K and 10 MPa. Fig. 4 presents the torque profiles of rhamnolipid, Span80 and Span40 with a concentration of 0.5 wt% in 20% water-cut system. The rhamnolipid used in this experiment was more soluble in water than Span80 and Span40. Before the start of experiment, we prepared an aqueous solution of rhamnolipid and water according to the experimental requirements in advance, and then the aqueous solution and n-octane were added to the reactor; the added solution showed a clear oil–water interface. Since the stirring in our experiment was sufficient, the experiment was started when the temperature and pressure reached the specified conditions. In 2001, Huo et al. used the DC motor current as a criterion to test hydrate plug prevention by some commercial surfactants and their synthesized chemical (CDDA).9 Their change of motor current was similar to the change of torque in our experiment. But because the mixing speed in their experiment was 300 rpm and the experiment device was different, the time of their experiment was longer than that of ours. As shown in Fig. 4, when Span80 and Span40 acted as AAs, the maximum torque was significantly greater than for rhamnolipid. It could be clearly found that the anti-agglomeration effect of rhamnolipid was better than that of Span80 and Span40.
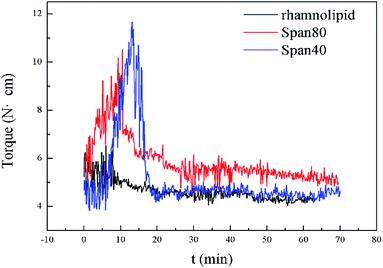 | ||
| Fig. 4 Torque profiles of rhamnolipid, Span80 and Span40 with a concentration of 0.5 wt% in 20% water-cut system. | ||
Three factors might affect the torque value in the experiment: viscosity change produced by hydrate formation, hydrate dispersion and dispersion or plug formation. In Fig. 3, at the beginning of the experiment, the hydrate formed quickly and the torque rose to a torque peak. This process is similar to the dangerous restart process of oil and gas pipelines, so the torque variation during this period could be used to evaluate the effectiveness of AA. The initial torque value at 10 MPa and 293.15 K was kept at around 4 N cm; once the hydrate formed, the impeller was required to overcome greater friction, resulting in an increased torque. There was a drop after the torque spiked as high as 20 N cm, and due to the continued mixing, the large amount of hydrate formed was dispersed to the edge of the reactor which resulted in insufficient resistance around the impeller. Through our observation via the quartz windows, it was found that this part of the hydrate climbed up and collapsed. Therefore, after the torque dropped, there was another rise, and it then became stable. After we opened the reactor, most of the hydrate was firmly attached to the impeller which caused a serious blockage. This phenomenon and torque variation implied that the rhamnolipid with a concentration of 0.1 wt% could not achieve an anti-agglomeration effect in oil–water system with 30% water cut. When the experimental pressure and temperature were relatively stable, which could be considered as the end of the experiment, the fluctuation of the torque curve was not as much as before and the plug was already formed. However, after the dispersion or plug was formed, the torque variation could not completely reflect the state of hydrate agglomeration in the reactor. It might be unpersuasive to use the torque variation at the end of the experiment as a description of anti-agglomeration effect, so the average torque of the first 15 minutes  and the maximum torque (Torquemax) were used to evaluate the performance of the rhamnolipid.
Tables 1–3 present the experimental groupings and results in detail. Three different final hydrate agglomeration states were observed throughout all experiments, which were blockage (blocking at the impeller), wall accumulation (gathering along the wall) and well dispersed. A detailed discussion and explanation are presented below.
 and agglomeration status for different systems
| Exp. | Water cut (%) | AA (wt%) | Torquemax (N cm) | (N cm) | Agglomeration status |
|---|---|---|---|---|---|
| 1 | 10 | 0 | 6.6 | 5.3 | Wall accumulation |
| 2 | 20 | 0 | 29.5 | 10.3 | Blockage |
| 3 | 30 | 0 | 22.9 | 7.4 | Blockage |
| 4 | 10 | 0.1 | 10.1 | 6.5 | Wall accumulation |
| 5 | 20 | 0.1 | 9.1 | 6.6 | Wall accumulation |
| 6 | 30 | 0.1 | 22.6 | 12.5 | Wall accumulation |
| 7 | 10 | 0.5 | 6.7 | 5.2 | Well dispersed |
| 8 | 20 | 0.5 | 6.5 | 5.2 | Well dispersed |
| 9 | 30 | 0.5 | 6.3 | 4.9 | Well dispersed |
| 10 | 10 | 1.0 | 6.8 | 5.4 | Well dispersed |
| 11 | 20 | 1.0 | 6.5 | 4.8 | Well dispersed |
| 12 | 30 | 1.0 | 7.5 | 5.7 | Well dispersed |
 and agglomeration status for different systems
| Exp. | Water cut (%) | AA (wt%) | Torquemax (N cm) | (N cm) | Agglomeration status |
|---|---|---|---|---|---|
| 13 | 10 | 0 | 7.0 | 5.4 | Wall accumulation |
| 14 | 20 | 0 | 20.8 | 8.1 | Blockage |
| 15 | 30 | 0 | 15.9 | 7.2 | Blockage |
| 16 | 10 | 0.1 | 7.8 | 5.7 | Wall accumulation |
| 17 | 20 | 0.1 | 10.8 | 6.5 | Wall accumulation |
| 18 | 30 | 0.1 | 26.6 | 9.2 | Wall accumulation |
| 19 | 10 | 0.5 | 7.4 | 5.9 | Well dispersed |
| 20 | 20 | 0.5 | 9.5 | 5.9 | Well dispersed |
| 21 | 30 | 0.5 | 8.2 | 5.9 | Well dispersed |
| 22 | 10 | 1.0 | 7.8 | 5.8 | Well dispersed |
| 23 | 20 | 1.0 | 7.0 | 5.3 | Well dispersed |
| 24 | 30 | 1.0 | 6.8 | 4.9 | Well dispersed |
 and agglomeration status for different systems
| Exp. | Water cut (%) | AA (wt%) | Torquemax (N cm) | (N cm) | Agglomeration status |
|---|---|---|---|---|---|
| 25 | 10 | 0 | 13.1 | 6.5 | Wall accumulation |
| 26 | 20 | 0 | 14.9 | 7.0 | Blockage |
| 27 | 30 | 0 | 12.5 | 5.4 | Blockage |
| 28 | 10 | 0.1 | 8.5 | 5.7 | Wall accumulation |
| 29 | 20 | 0.1 | 9.4 | 6.7 | Wall accumulation |
| 30 | 30 | 0.1 | 25.4 | 10.0 | Wall accumulation |
| 31 | 10 | 0.5 | 7.8 | 5.9 | Well dispersed |
| 32 | 20 | 0.5 | 7.7 | 6.0 | Well dispersed |
| 33 | 30 | 0.5 | 7.5 | 5.8 | Well dispersed |
| 34 | 10 | 1.0 | 6.9 | 4.7 | Well dispersed |
| 35 | 20 | 1.0 | 7.2 | 5.4 | Well dispersed |
| 36 | 30 | 1.0 | 7.6 | 5.9 | Well dispersed |
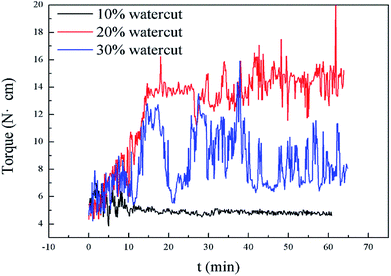
Interestingly, as shown in Fig. 5, our measurements of Torquemax and  in 20% water cut system were higher than those in 30% water cut system. In Tables 1 and 3, similar results are presented for systems without the addition of rhamnolipid. A bulk hydrate phase was found to be wrapped on the impeller after opening the reactor. A solid hydrate plug was found stuck firmly around the impeller by Huo et al.9 A likely explanation for the result was that the higher the water cut of the system, the smaller the volume of the remaining hydrocarbon phase, since the water phase was completely converted to the hydrate phase. In 20% water cut system, the remaining n-octane provided greater friction, which resulted in higher torque value than in 30% water cut system. This phenomenon disappeared in systems with higher water-cut. We measured torque changes of 40% and 50% water-cut systems, and due to the high water cut, there was a large amount of hydrate formation which caused a serious blockage and the motor stopped rotating.
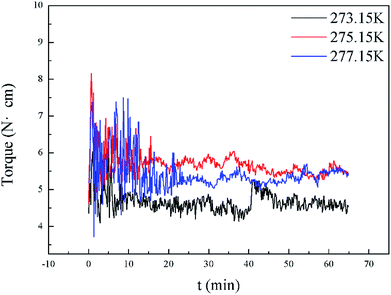
 presented in Tables 1–3, it was easy to find that subcooling could affect these two values in pure oil–water system. The greater the subcooling, the faster the formation of hydrate, which accelerated hydrate blockage. When rhamnolipid was loaded into the aqueous phase, the hydrate agglomeration states were changed. We speculated that once the concentration was sufficient, the effect of subcooling could be ignored. On the other hand, it was also proved that rhamnolipid could tolerate a high subcooling.
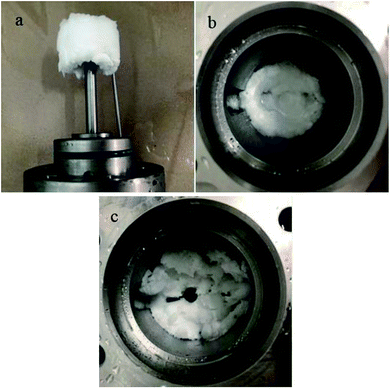 | ||
| Fig. 7 Images of three final hydrate agglomeration states in this study: (a) blockage; (b) wall accumulation; (c) well dispersed. | ||
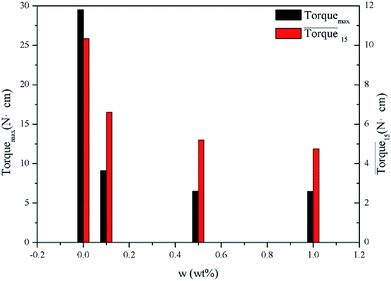
Fig. 8 presents a comparison of Torquemax and  in systems with the same subcooling (13.7 K) and the same water cut (20%) but different rhamnolipid concentrations. The black column and the red column represent Torquemax and
  respectively. As we can see, the height of columns decreased as the concentration increased. In this work, we considered Torquemax to be less than 10 N cm and
  to be no more than 6 N cm as a criterion, and it was used to evaluate the effectiveness of rhamnolipid in 20% and 30% water-cut systems. When the concentration of rhamnolipid reached 0.5 wt%, both Torquemax and
  were relatively low. Moreover, when the concentration of rhamnolipid increased, the difference of Torquemax and the variation of
  could be negligible. Meanwhile, as shown in Tables 1–3, the same phenomenon could be observed in other tests. Therefore, in low water cut system, we supposed that 0.5 wt% might be a suitable concentration of hydrate AA. In the natural rhamnolipid biosynthesis process, the hydrophilic groups and hydrophobic groups might be linked to each other and form some homologues with similar chemical structures. In other words, the rhamnolipid used in our experiments was a mixture composed of many homologues. Due to the characteristics of the components of rhamnolipid, as a kind of AA, the rhamnolipid might have a mild synergy effect. In a certain system, the superficial area of the loaded water was constant, and mixed AAs would provide a larger adsorption area than a single AA. A further discussion of the anti-agglomeration effect with rhamnolipid and other AAs is necessary in the future.
3.2 Microscopic experiments
![[thin space (1/6-em)]](https://www.rsc.org/images/entities/char_2009.gif) :
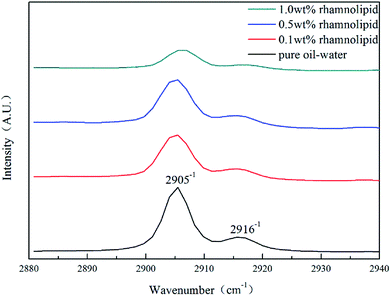
:![[thin space (1/6-em)]](https://www.rsc.org/images/entities/char_2009.gif) 3.31,32 As shown in Fig. 10, the peak positions in our study were located at 2905 cm−1 and 2916 cm−1, indicating that the addition of rhamnolipid might barely have contributed to peak positions. In pure oil–water system, the ratio of large to small cavities was 3.03, which was very close to the theoretical value of sI hydrate. The large and small cavity ratio values of 0.1, 0.5 and 1.0 wt% rhamnolipid were 3.35, 3.45 and 3.46. In 2005, Lu et al. proposed that the Raman method could be applied quantitatively to estimate the hydration number of pure methane hydrate.33 In our study, we calculated the hydrate number by this method, and the hydration number was 5.98, 6.03, 6.05, and 6.06 with the rhamnolipid concentration changing from 0 to 1.0 wt%. This implied that the introduction of rhamnolipid could increase the large and small cavity ratio and hydration number.
3.31,32 As shown in Fig. 10, the peak positions in our study were located at 2905 cm−1 and 2916 cm−1, indicating that the addition of rhamnolipid might barely have contributed to peak positions. In pure oil–water system, the ratio of large to small cavities was 3.03, which was very close to the theoretical value of sI hydrate. The large and small cavity ratio values of 0.1, 0.5 and 1.0 wt% rhamnolipid were 3.35, 3.45 and 3.46. In 2005, Lu et al. proposed that the Raman method could be applied quantitatively to estimate the hydration number of pure methane hydrate.33 In our study, we calculated the hydrate number by this method, and the hydration number was 5.98, 6.03, 6.05, and 6.06 with the rhamnolipid concentration changing from 0 to 1.0 wt%. This implied that the introduction of rhamnolipid could increase the large and small cavity ratio and hydration number.
4. Conclusion
In this study, we investigated the effectiveness of rhamnolipid through macroscopic and microscopic experiments. The average torque of the first 15 minutes, severe local maximum torque and visual observation were adopted to evaluate the performance of rhamnolipid. The following conclusions could be drawn from our work.The experiments of hydrate anti-agglomeration were successfully performed with a high-pressure visual autoclave apparatus equipped with a torque sensor. Torquemax to be less than 10 N cm and the  to be no more than 6 N cm were established as a criterion for hydrate anti-agglomeration. In pure oil–water system, since the remaining hydrocarbon phase provided greater resistance, the values of Torquemax and
  were higher in 20% water-cut system than in system with 30% water cut. Three different agglomeration states were observed, especially for hydrate powders. The addition of rhamnolipid made the phenomenon of hydrate blockage disappear. 0.5 wt% could be regarded as an effective concentration of rhamnolipid to prevent hydrate agglomeration. Rhamnolipid could tolerate high subcooling. In the range of subcooling from 9.7 K to 13.7 K, when rhamnolipid was introduced, the effect of subcooling could be ignored. The PXRD patterns and Raman spectra revealed that rhamnolipid had no impact on hydrate structure, but it could increase the large and small cavity ratio value and hydration number. Rhamnolipid not only affected the macroscopic agglomeration states of hydrate, but also had a significant effect on hydrate surface. Rhamnolipid made the hydrate surface smoother so that it could avoid a severe cluster-like surface.
Conflicts of interest
There are no conflicts to declare.Acknowledgements
This work was supported by NSFC (no. 41473063)References
- E. D. Sloan Jr and C. A. Koh, Clathrate Hydrates of Natural Gases, Crc Press, 2007 Search PubMed.
- D. Sloan, C. Koh, A. K. Sum, A. L. Ballard, J. Creek, M. Eaton, J. Lachance, N. Mcmullen, T. Palermo and G. Shoup, Natural Gas Hydrates in Flow Assurance, 2011 Search PubMed.
- P. D. Dholabhai, J. S. Parent and P. R. Bishnoi, Fluid Phase Equilib., 1997, 141, 235–246 CrossRef CAS.
- M. Cha, K. Shin, J. Kim, D. Chang, Y. Seo, H. Lee and S.-P. Kang, Chem. Eng. Sci., 2013, 99, 184–190 CrossRef CAS.
- A. Perrin, O. M. Musa and J. W. Steed, Chem. Soc. Rev., 2013, 42, 1996–2015 RSC.
- M. A. Kelland, Energy Fuels, 2006, 20, 825–847 CrossRef CAS.
- S.-P. Kang, J.-Y. Shin, J.-S. Lim and S. Lee, Chem. Eng. Sci., 2014, 116, 817–823 CrossRef CAS.
- J. L. Creek, Energy Fuels, 2012, 26, 4112–4116 CrossRef CAS.
- Z. Huo, E. Freer, M. Lamar, B. Sannigrahi, D. M. Knauss and E. D. Sloan Jr, Chem. Eng. Sci., 2001, 56, 4979–4991 CrossRef CAS.
- B.-Z. Peng, J. Chen, C.-Y. Sun, A. Dandekar, S.-H. Guo, B. Liu, L. Mu, L.-Y. Yang, W.-Z. Li and G.-J. Chen, Chem. Eng. Sci., 2012, 84, 333–344 CrossRef CAS.
- Y. Lv, Y. Guan, S. Guo, Q. Ma, J. Gong, G. Chen, C. Sun, K. Guo, L. Yang, B. Shi, W. Qin and Y. Qiao, Energies, 2017, 10, 1105 CrossRef.
- J. Chen, Y.-F. Wang, C.-Y. Sun, F.-G. Li, N. Ren, M.-L. Jia, K.-L. Yan, Y.-N. Lv, B. Liu and G.-J. Chen, Energy Fuels, 2014, 29, 122–129 CrossRef CAS.
- B. Shi, L. Ding, Y. Liu, J. Yang, S. Song, H. Wu, W. Wang and J. Gong, RSC Adv., 2018, 8, 11436–11445 RSC.
- M. A. Kelland, T. M. Svartaas, J. Øvsthus, T. Tomita and J.-I. Chosa, Chem. Eng. Sci., 2006, 61, 4048–4059 CrossRef CAS.
- M. A. Kelland, T. M. Svartaas, J. Øvsthus, T. Tomita and K. Mizuta, Chem. Eng. Sci., 2006, 61, 4290–4298 CrossRef CAS.
- P. C. Chua and M. A. Kelland, Energy Fuels, 2013, 27, 1285–1292 CrossRef CAS.
- J. Chen, C.-Y. Sun, B.-Z. Peng, B. Liu, S. Si, M.-L. Jia, L. Mu, K.-L. Yan and G.-J. Chen, Energy Fuels, 2013, 27, 2488–2496 CrossRef CAS.
- H. Zhao, M. Sun and A. Firoozabadi, Fuel, 2016, 180, 187–193 CrossRef CAS.
- M. Sun and A. Firoozabadi, J. Colloid Interface Sci., 2013, 402, 312–319 CrossRef CAS PubMed.
- S. Dong, M. Li and A. Firoozabadi, Fuel, 2017, 210, 713–720 CrossRef CAS.
- S. Dong and A. Firoozabadi, J. Chem. Thermodyn., 2018, 117, 214–222 CrossRef CAS.
- M. Sun, Y. Wang and A. Firoozabadi, Energy Fuels, 2012, 26, 5626–5632 CrossRef CAS.
- I. M. Banat, Bioresour. Technol., 1995, 51, 1–12 CrossRef CAS.
- J. D. York and A. Firoozabadi, J. Phys. Chem. B, 2008, 112, 845 CrossRef CAS PubMed.
- X. Li, L. Negadi and A. Firoozabadi, Energy Fuels, 2010, 24, 4937–4943 CrossRef CAS.
- G. Bhattacharjee, V. Barmecha, D. Pradhan, R. Naik, K. Zare, R. B. Mawlankar, S. G. Dastager, O. S. Kushwaha and R. Kumar, Energy Procedia, 2017, 105, 5011–5017 CrossRef CAS.
- S. Jadav, N. Sakthipriya, M. Doble and J. S. Sangwai, J. Nat. Gas Sci. Eng., 2017, 43, 156–166 CrossRef CAS.
- A. Arora, S. S. Cameotra, R. Kumar, C. Balomajumder, A. K. Singh, B. Santhakumari, P. Kumar and S. Laik, Sci. Rep., 2016, 6, 20893 CrossRef CAS PubMed.
- Y. H. Sohn, J. Kim, K. Shin, D. Chang, Y. Seo, Z. M. Aman and E. F. May, Chem. Eng. Sci., 2015, 126, 711–718 CrossRef CAS.
- M. Sun and A. Firoozabadi, Fuel, 2015, 146, 1–5 CrossRef CAS.
- A. K. Sum, R. C. Burruss and E. D. Sloan Jr, J. Phys. Chem. B, 1997, 101, 7371–7377 CrossRef CAS.
- S. Y. Hong, J. I. Lim, J. H. Kim and J. D. Lee, Energy Fuels, 2012, 26, 7045–7050 CrossRef CAS.
- H. Lu, I. Moudrakovski, M. Riedel, G. Spence, R. Dutrisac, J. Ripmeester, F. Wright and S. Dallimore, J. Geophys. Res., 2005, 110, 1–9 CrossRef.
- Q. Zhang, X. Shen, X. Zhou and D. Liang, Energy Fuels, 2016, 31, 839–846 CrossRef.
- L. Shi, X. Shen, J. Ding and D. Liang, Energy Fuels, 2017, 31, 8540–8547 CrossRef CAS.
| This journal is © The Royal Society of Chemistry 2018 |

