 Open Access Article
Development of a portable electrochemical loop mediated isothermal amplification (LAMP) device for detection of hepatitis B virus†
Nileththi Yasendra Jayanatha,
Loc Thai Nguyen *b,
Thu Thi Vucd and
Lam Dai Tranef
aDepartment of Food Science & Technology, Faculty of Agriculture, University of Peradeniya, Sri Lanka
bFood Engineering and Bioprocess Technology, School of Environment, Resources and Development (SERD), Asian Institute of Technology, PO Box 4, Klong Luang 12120, Pathumthani, Bangkok, Thailand. E-mail: locnguyen@ait.ac.th
cUniversity of Science and Technology of Hanoi (USTH), Vietnam Academy of Science and Technology (VAST), 18 Hoang Quoc Viet, Cau Giay, Hanoi, Vietnam
dCenter for High Technology Development (HTD), Vietnam Academy of Science and Technology (VAST), 18 Hoang Quoc Viet, Cau Giay, Hanoi, Vietnam
eInstitute for Tropical Technology (ITT), Vietnam Academy of Science and Technology (VAST), 18 Hoang Quoc Viet, Cau Giay, Hanoi, Vietnam
fGraduate University of Science and Technology (GUST), Vietnam Academy of Science and Technology (VAST), 18 Hoang Quoc Viet, Cau Giay, Hanoi, Vietnam
First published on 12th October 2018
Abstract
The objective of this study was to develop a simple, inexpensive prototype device for rapid detection of hepatitis B virus (HBV). The device was able to simultaneously amplify, detect and quantify the target HBV DNA. The system was fabricated from a custom-made electrochemical set-up of which the temperature was thermostatically controlled by a water bath. Real-time monitoring of HBV DNA was accomplished by measuring the response of redox indicator in the reaction mixture. Concentration of HBV DNA in the samples was determined from the peak high ratio (PHR) and threshold time relationship. The signal was processed by sigmoidal model fitting to enhance the accuracy of the results. Key parameters including concentrations of redox indicator and reaction temperatures were optimized. Sensitivity and specificity of the method toward HBV DNA were evaluated. The prototype was capable of real-time amplification and detection of HBV DNA with concentration as low as 6.18 fg μl−1. The test showed high specificity against HBV DNA. The system was also able to detect HBV positive serum directly with simple thermal pretreatment instead of tedious DNA extraction. The electrochemical set-up was compatible with microfluidic platforms and can be readily adapted for efficient and high throughput point-of-care (POC) diagnosis of HBV.
Introduction
The infection of HBV has become a major public health concern despite the availability of vaccination and antiviral therapy.1,2 The disease affects more than 240 million people and its complications such as cirrhosis or liver cancer can lead to significant morbidity and mortality.3 Generally, HBV can be detected by either serological or DNA-based methods. However, serological testing was found to be unreliable as negative blood donors still transferred the disease, especially in its initial or later stage.4 Real-time polymerase chain reaction (PCR) is a sensitive and specific approach for detection and quantitation of HBV.5 However, the disadvantages of this DNA-based method include complicated detection of the amplified DNA, the need of thermal cycling steps, expensive optical monitoring systems and requirement of trained personnel.6–8 Unlike PCR, loop-mediated isothermal amplification (LAMP) can amplify DNA at constant temperature, even with a simple heating block or water bath.6,9 The method is highly selective as the target sequences are recognized by four different primers. LAMP can amplify DNA in the presence of substances that commonly inhibit PCR reactions.10 LAMP has been successfully applied in several areas including medicine, agriculture, aquaculture and food safety.6 The method was also used to detect HBV DNA with combination of gel electrophoresis.11 In prevention and treatment of HBV, early diagnosis of the disease is of significant importance. An effective POC screening method for the virus is highly desirable.2 Recently, there have been increasing interests in developing portable POC devices using LAMP technique for rapid detection of various pathogenic microorganisms. Nagatani et al. developed a semi-real time electrochemical monitoring method for influenza virus using a USB powered portable potentiostat.6 Mao et al. used a multiplex microfluidic LAMP array for detection of malaria.12 Chen et al. detected koi herpesvirus using an integrated microfluidic LAMP platform.13 A centrifugal LAMP microdevice was reported by Seo et al. for detection of foodborne pathogenic bacteria.14 On the other hand, the real time monitoring of DNA amplification in LAMP technique can be realized using optical, electrical, electrochemical, and pH-sensing mechanisms. However, electrochemical methods do not require complex instrumentation, high-power supply, calibration and optimization.15 Therefore, the combined LAMP and electrochemical monitoring is an ideal alternative for the development of POC devices.In this study, we developed a portable, inexpensive electrochemical LAMP device, which could perform simultaneous real-time amplification, detection and quantification of the HBV DNA. The device was developed from an electrochemical flow cell, which is compatible with microfluidic platforms. The prototype can be further upgraded for automatic, high throughput diagnosis of HBV. Key operating parameters were optimized and performances of the system including selectivity, sensitivity were evaluated. The electrochemical signal was processed by sigmoidal model fitting to enhance the accuracy of the results. Direct detection of the HBV-positive serum sample using simple thermal pretreatment instead of complicated DNA extraction was also reported.
Experimental
Chemicals
Reaction mixtures including Tris–HCl, KCl, MgSO4, (NH4)SO4, Tween20, Betaline, dNTPs and BST DNA polymerase for LAMP and fluorescent detection reagent were purchased from Eiken Co. Ltd. (Tokyo, Japan). Methylene blue was provided by Daejung Chemicals & Metals Co. Ltd. (Siheung, Korea). LAMP primers in aqueous form were purchased from Sigma Aldrich Pte Ltd. (Singapore). Deionized water was purchased from RCI Labscan Ltd. (Pathumwan, Thailand). The universal set of LAMP primers (Sigma Aldrich, Singapore) which was able to detect all available genotypes (A to F),11 was used in the present study (Table 1).| Name | Primer sequence (5′–3′) | Length |
|---|---|---|
| F3 | TCCTCACAATACCGCAGAGT | 20 bp |
| B3 | GCAGCAGGATGAAGAGGAAT | 20 bp |
| FIP | GTTGGGGACTGCGAATTTTGGCTTTTTAGACTCGTGGTGGACTTCT | 46 bp |
| BIP | TCACTCACCAACCTCCTGTCCTTTTTAAAACGCCGCAGACACAT | 44 bp |
| LF | GGTGATCCCCCTAGAAAATTGAG | 23 bp |
| LB | AATTTGTCCTGGTTATCGCTGG | 22 bp |
Hepatitis B virus and DNA extraction
Anonymous HBV-positive serum samples were kindly provided by the Centre of Excellence in Clinical Virology, Chulalongkorn University, Bangkok, Thailand. The DNA was extracted using the QIAmp DNA blood mini kit (QIA-GEN GmbH, Germany) and was then dissolved in DNAse-free water. The original concentration of DNA was determined by NanoDrop 2000 spectrophotometer (Thermo Scientific, DE, USA). DNA sample was stored at −20 °C prior to testing. Similarly, DNA extracted from anonymous HBV-negative serum was used as the negative control.Experimental set-up
A custom-made portable prototype device was developed for real-time measurement of LAMP reaction using electrochemical method. Generally, the system consisted of a drop cell connector (DC0058, Micrux Technologies, Spain) inserted in a heat sink made from an aluminum block (5 cm × 10 cm × 15 cm) (Fig. S1†). The heat sink was heated in a water bath at the preset temperature. The drop cell had a thin film platinum electrode (Micrux Technologies, Spain) which was connected to a portable potentiostat (DY2100B, Digi-Ivy Inc, USA). The reaction chamber was fabricated from an Eppendorf tube of which the base was removed and mounted on the top of the microelectrode surface using a custom-made fixture and gasket (Fig. S2†). The reaction chamber was covered during LAMP reaction to prevent the evaporation of the solutions. Temperature of the liquid inside the reaction chamber is shown in Fig. S3.† After a short come-up time of about 1.5 min, the reaction liquid reached the target temperature with a standard deviation of ±0.5 °C.Real-time electrochemical measurement of LAMP reaction
Electrochemical measurement
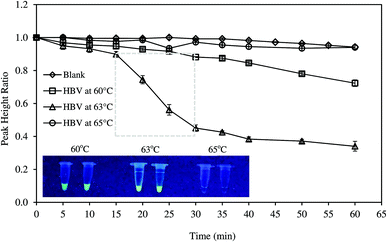
The amplification of DNA was monitored by square wave voltammetry (SWV) using MB as the redox indicator. MB was proven to be more efficient for electrochemical measurement than other dyes.16 In addition, MB did not affect amplification process in PCR or LAMP.6,17–19 SWV was conducted with frequency of 5 Hz, amplitude of 5 mV, step potential of 5 mV, and potential range from −0.56 to −0.26 V. Typical voltammogram of MB in reaction mixture is presented in Fig. S4.† The LAMP reagents were not found to interfere with the current signal. During LAMP reaction, MB was intercalated in the double stranded DNA.17,20 The amplification of DNA reduced the concentration of freely available MB; thus, the peak current recorded decreased with reaction time. The original quantity of MB added to the reaction mixture might affect the measurement sensitivity. Therefore, various MB concentrations (4–50 μM) were investigated to determine the suitable amount of the redox indicator. Usually, LAMP reaction was conducted from 60–65 °C at the optimum temperatures of bst DNA polymerase.21 However, the exact temperature depended on the nature of the reaction mixture and the set of primers used in LAMP reaction.22,23 Hence, in this study, reaction temperatures were optimized in the range of 60–65 °C. LAMP reaction was conducted for 60 min and electrochemical measurement was recorded at 5 min intervals. The amplification of DNA was further confirmed by a parallel fluorescent test. Briefly, LAMP reaction was terminated by heating the reaction mixture at 95 °C for 2 min. Then, the florescence was observed under UV lamp from 350–370 nm.System performance and specificity
The ability of the system to detect and quantify HBV DNA was validated by using four DNA samples with known concentrations (8.8, 77.2, 882.1 and 3087.5 pg μl−1). Performance of the system was evaluated based on correlation between experimental and expected concentration values. Specificity of the method was determined using DNA extracted from the HBV-negative serum.Direct detection of HBV
HBV-positive serum having a viral load of 6.81 log![[thin space (1/6-em)]](https://www.rsc.org/images/entities/char_2009.gif) IU ml−1 was used for the test. Prior to the assay, two different pretreatment methods were attempted. The first one was adapted from Nyan et al., in which the samples were diluted two folds and were consecutively heated at 95 and 100 °C for 5 min each.11 The samples were then cooled on ice for 5 min and centrifuged at 12
IU ml−1 was used for the test. Prior to the assay, two different pretreatment methods were attempted. The first one was adapted from Nyan et al., in which the samples were diluted two folds and were consecutively heated at 95 and 100 °C for 5 min each.11 The samples were then cooled on ice for 5 min and centrifuged at 12![[thin space (1/6-em)]](https://www.rsc.org/images/entities/char_2009.gif) 000 rpm for 3 min. Two microliters of the as-prepared solution was used for LAMP reaction. The second method followed protocols of Ching et al. with modifications.26 Twenty microliters of serum sample was heated at 123 ± 2 °C in an oil bath for 10 min. Then, the sample was cooled on ice for 5 min. Two microliters of the solution prepared from the sample by 2-fold dilution was tested. Both electrochemical measurement and fluorescent test were conducted to validate the amplification and detection of HBV DNA in the samples.
000 rpm for 3 min. Two microliters of the as-prepared solution was used for LAMP reaction. The second method followed protocols of Ching et al. with modifications.26 Twenty microliters of serum sample was heated at 123 ± 2 °C in an oil bath for 10 min. Then, the sample was cooled on ice for 5 min. Two microliters of the solution prepared from the sample by 2-fold dilution was tested. Both electrochemical measurement and fluorescent test were conducted to validate the amplification and detection of HBV DNA in the samples.
Data processing and analysis
The real-time DNA amplification curve was constructed by plotting peak high ratio (PHR) against LAMP reaction time. PHR was calculated by dividing peak current value at a given time to that at the beginning. The relationship between PHR and reaction time was described by a sigmoidal equation as below:
 | (1) |
Results and discussion
The effects of MB concentration
The responses of peak current to MB concentrations in the reaction mixture are provided in Fig. 1. Linear increase in peak current was observed when MB concentration increased from 4 to 30 μM (R2 = 0.988). The current intensity did not change as much with higher concentration range (40–50 μM). Therefore, the measurement sensitivity would be greater if MB concentration was less than 30 μM. The real-time monitoring of LAMP reaction relied on the net changes of electroactive MB in the reaction mixture. As the amplification proceeded, MB in the solution was gradually intercalated in double-stranded DNAs and became inactive.17,20Preliminary tests further showed that the optimal MB concentration for measuring DNA amplification via PHR was 25 μM. Different MB concentrations were reported when MB was used as a electrochemical mediator molecule for DNA amplification, ranging from 10–20 μM.6,17,19,27 The discrepancy may be due to specific experimental conditions and the type of electrodes used.
Real-time electrochemical measurement of LAMP reaction
Data processing and calibration
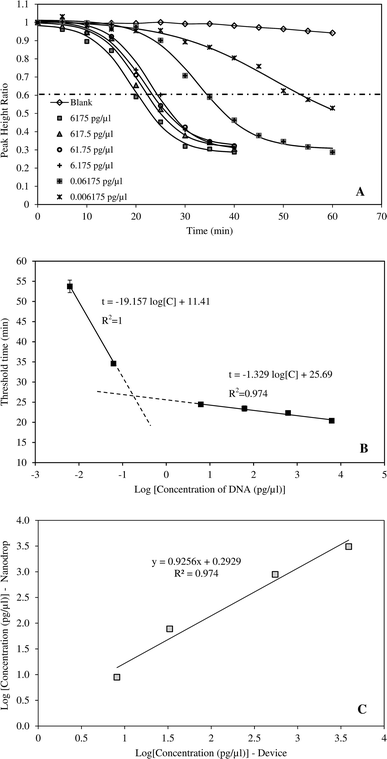
The amplification curves performed using six different initial HBV DNA concentrations (6175, 617.50, 61.75, 6.175, 0.06175 and 0.006175 pg μl−1) are presented in Fig. 3A. The relationship between PHR and reaction time was described by respective sigmoidal equations of which the coefficients are given in Table 2. The coefficients of determination ranged from 0.988 to 0.997 indicating excellent fitting of the data. Earlier studies have demonstrated that sigmoidal function can fit PCR amplification curves accurately and reliably.29 In PCR method, fluorescent intensities increased with reaction time.29–33 However, in this study, the inverse sigmoidal curve was applied since measured current signals declined with increasing time. The amplification curves also showed that, the exponential phase occurred between 15–30 min at DNA concentrations greater than 6.175 pg μl−1. At higher dilution, time taken to amplify the amplicons was significantly longer, up to 50–60 min. Correlation between threshold time and HBV DNA concentration is provided in Fig. 3B. When the concentration was from 6.175–6175 pg μl−1, the threshold time linearly correlated with DNA concentration and R2 = 0.974. The device was also tested with highly diluted samples and it was able to amplify and detect DNA concentration as low as 6.18 fg μl−1. LAMP technique is widely known for its sensitivity. Moslemi et al. used LAMP to detect down to four particles of HBV DNA with both gel electrophoresis and fluorescent methods.28 Nyan et al. reported that HBV DNA was detected by LAMP from 25 to 104 IU per reaction at 100% rate.11 Notomi et al. was able to amplify and detect six copies of HBV DNA templates in less than one hour.21| DNA concentration (pg μl−1) | A | B | t0.5 | k | R2 |
|---|---|---|---|---|---|
| 6175 | 0.708 | 0.282 | 19.55 | −4.195 | 0.995 |
| 617.5 | 0.691 | 0.311 | 20.97 | −4.130 | 0.994 |
| 61.75 | 0.696 | 0.317 | 21.78 | −4.441 | 0.996 |
| 6.175 | 0.716 | 0.298 | 23.11 | −4.231 | 0.994 |
| 0.06175 | 0.709 | 0.304 | 32.75 | −5.445 | 0.997 |
| 0.006175 | 0.656 | 0.356 | 48.08 | −10.85 | 0.988 |
Performance of the developed system
The application of the system for rapid detection of HBV would be practical only if the analysis time is reasonably short. Therefore, DNA concentrations greater than 6.175 pg μl−1 were more suitable for the device. The ability of the system to detect HBV DNA was validated by an independent set of samples with concentrations of 8.8, 77.2, 882.1 and 3087.5 pg μl−1 (Fig. 3C). DNA concentrations determined by the system were compared against those measured by nanodrop method. The results indicated that the system can accurately determine the HBV DNA with coefficient of determination of 0.975.Specificity of the method
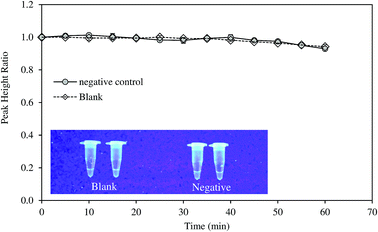
Specificity of the method was tested with DNA samples extracted from HBV-negative serum. The amplification was not observed as suggested by the electrochemical measurement and fluorescence test (Fig. 4). LAMP reaction is very specific due to the binding of six primers to six or eight distinct regions of the target gene.21 Notomi et al. showed that presence of 100 ng of human genomic DNA in the reaction mixture containing six copies of target HBV DNA had no significant effect on the amplification of the latter.21 In the present study, the primers were designed to identify the conserved sequences of the S gene and overlapping polymerase regions which was homologous to all the available genotypes of HBV. The specificity of the LAMP primers on the targeted sequence was also proven in other studies on HBV.11Direct diagnosis of the HBV positive serum using the developed approach
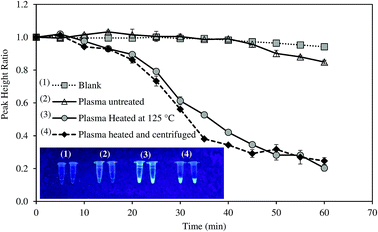
Most of studies on HBV required tedious protocols to extract DNA prior to LAMP reaction. To make the system more suitable for POC diagnosis, we attempted to detect HBV positive serum without DNA extraction step. The samples were only thermally pretreated, with and without centrifugation, and were then directly analyzed by the system. Amplification curves of untreated and pretreated samples are illustrated in Fig. 5.For untreated sample, HBV present in the samples could not be detected as PHR remained unchanged. On the other hand, the system successfully recognized HBV DNA in the pretreated samples. The heat pretreatment at 95 and 100 °C for 5 min each followed by centrifugation was more effective than heating at 120–125 °C for 10 min as DNA amplification rate was faster. Increased fluorescent intensity of the centrifuged sample concurred with the electrochemical measurement. HBV DNA was surrounded by HBcAg the hepatitis B viral protein.34 Thus, the protein layer must be denatured to release the viral DNA components. Both the heat treatments could denature HBcAg. Nevertheless, the application of centrifugation precipitated the proteins and produced DNA with higher purity.35 LAMP was previously reported to detect target DNA in the specimens without the need of sample extraction.36,37 However, in this study, real-time amplification and detection of HBV from positive serum without DNA extraction was tested for the first time.
Conclusions
A simple, low-cost device based on LAMP and electrochemical method was successfully developed for detection of HBV. The target DNA was amplified at isothermal condition with the help of a general-purpose water bath. Real-time monitoring and quantification of DNA were implemented via electrochemical measurement. The performance of the method was tested with satisfactory sensitivity and specificity. When the serum samples were subjected to thermal pretreatment, the device can detect HBV directly without the need for DNA extraction. The features of the developed device were quite suitable for POC diagnosis of HBV in the resource-limited settings. The device could be further improved and extended its applications for detection of pathogens and concerned microorganisms in food, environmental and medical areas.Conflicts of interest
There are no conflicts to declare.Acknowledgements
Nileththi Yasendra Jayanath and Loc Thai Nguyen are grateful to the support from PDF fund (AIT). Thu Thi Vu and Lam Dai Tran acknowledge financial support from National Foundation of Science and Technology Development project, code: NAFOSTED 104.04-2014.36 (T.D.L).References
- T. Cai, G. Lou, J. Yang, D. Xu and Z. Meng, J. Clin. Virol., 2008, 41, 270 CrossRef CAS PubMed.
- N. Chotun, W. Preiser, C. J. van Rensburg, P. Fernandez, G. B. Theron, D. Glebe and M. I. Andersson, PLoS One, 2017, 12, e0181267 CrossRef PubMed.
- S. Chevaliez, C. Dauvillier, F. Dubernet, J. D. Poveda, S. Laperche, C. Hézode and J. M. Pawlotsky, J. Clin. Microbiol., 2017, 55, 1211 CrossRef CAS PubMed.
- C. J. Liu, D. S. Chen and P. J. Chen, J. Clin. Virol., 2006, 36, S33 CrossRef PubMed.
- R. W. Chen, H. Piiparinen, M. Seppänen, P. Koskela, S. Sarna and M. Lappalainen, J. Med. Virol., 2001, 65, 250 CrossRef CAS PubMed.
- N. Nagatani, K. Yamanaka, M. Saito, R. Koketsu, T. Sasaki, K. Ikuta, T. Miyahara and E. Tamiya, Analyst, 2011, 136, 5143 RSC.
- K. Hashimoto, M. Inada and K. Ito, Anal. Biochem., 2017, 539, 113 CrossRef CAS PubMed.
- J. W. F. Law, N. S. A. Mutalib, K. G. Chan and L. H. Lee, Front. Microbiol., 2015, 5, 770 Search PubMed.
- H. Soliman, M. Saleh and M. El-Matbouli, in Veterinary Infection Biology: Molecular Diagnostics and High-Throughput Strategies, ed. M.V. Cunha and J. Inácio, Humana Press, New York, 2015, pp. 163–173 Search PubMed.
- M. Safavieh, M. K. Kanakasabapathy, F. Tarlan, M. U. Ahmed, M. Zourob, W. Asghar and H. Shafiee, ACS Biomater. Sci. Eng., 2016, 2, 278 CrossRef CAS PubMed.
- D. Nyan, L. E. Ulitzky, N. Cehan, P. Williamson, V. Winkelman, M. Rios and D. R. Taylor, Clin. Infect. Dis., 2014, 59, 16 CrossRef CAS PubMed.
- R. Mao, G. Ge, Z. Wang, R. Hao, G. Zhang, Z. Yang, B. Lin, Y. Ma, H. Liu and Y. Du, Acta Trop., 2018, 178, 86 CrossRef CAS PubMed.
- S. C. Chen, C. C. Liu, Y. N. Wang, L. M. Fu and S. H. Shih, Chem. Eng. J., 2018, 334, 1828 CrossRef CAS.
- J. H. Seo, B. H. Park, S. J. Oh, G. Choi, E. Y. Lee and T. S. Seo, Sens. Actuators, B, 2017, 246, 146 CrossRef CAS.
- M. U. Ahmed, S. Nahar, M. Safavieh and M. Zourob, Analyst, 2013, 138, 907 RSC.
- D. Jiang, G. Xiang, C. Liu, J. Yu, L. Liu and X. Pu, Int. J. Electrochem. Sci., 2012, 7, 10607 CAS.
- K. Wang, Y. P. Chen, Y. Lei, G. X. Zhong, A. L. Liu, Y. J. Zheng and Y. Z. Chen, Microchim. Acta, 2013, 180, 871 CrossRef CAS.
- K. Yamanaka, M. Saito, K. Kondoh, M. M. Hossain, R. Koketsu, T. Sasaki and E. Tamiya, Analyst, 2011, 136, 2064 RSC.
- A. Martin, K. B. Grant, F. Stressmann, J. M. Ghigo, D. Marchal and B. Limoges, ACS Sens., 2016, 1, 904 CrossRef CAS.
- A. Erdem, K. Kerman, B. Meric, U. S. Akarca and M. Ozsoz, Anal. Chim. Acta, 2000, 422, 139 CrossRef CAS.
- T. Notomi, H. Okayama, H. Masubuchi, T. Yonekawa, K. Watanabe, N. Amino and T. Hase, Nucleic Acids Res., 2000, 28, E63 CrossRef CAS PubMed.
- T. Iwamoto, T. Sonobe and K. Hayashi, J. Clin. Microbiol., 2003, 41, 2616 CrossRef CAS PubMed.
- M. Parida, G. Posadas, S. Inoue, F. Hasebe and K. Morita, J. Clin. Microbiol., 2004, 42, 257 CrossRef CAS PubMed.
- S. Santiago-Felipe, L. Tortajada-Genaro, J. Carrascosa, R. Puchades and Á. Maquieira, Biosens. Bioelectron., 2016, 79, 300–306 CrossRef CAS PubMed.
- T. Wang, S. Kim and J. H. An, J. Microbiol. Methods, 2017, 133, 1 CrossRef CAS PubMed.
- W. M. Ching, C. C. Chao, and H. W. Chen, US Pat., 13/370,283, 2012.
- J. Luo, X. Fang, D. Ye, H. Li, H. Chen, S. Zhang and J. Kong, Biosens. Bioelectron., 2014, 60, 84 CrossRef CAS PubMed.
- E. Moslemi, M. H. Shahhosseiny, G. Javadi, K. Praivar, T. Sattari and H. K. Amini, Afr. J. Microbiol. Res., 2009, 3, 439 CAS.
- W. Liu and D. A. Saint, Biochem. Biophys. Res. Commun., 2002, 294, 347 CrossRef CAS PubMed.
- R. G. Rutledge, Nucleic Acids Res., 2004, 32, e178 CrossRef CAS PubMed.
- A. C. Carr and S. D. Moore, PLoS One, 2012, 7, e37640 CrossRef CAS PubMed.
- A. Spiess, C. Deutschmann, M. Burdukiewicz, R. Himmelreich, K. Klat, P. Schierack and S. Rödiger, Clin. Chem., 2015, 61, 379 CrossRef CAS PubMed.
- A. Priye, S. Wong, Y. Bi, M. Carpio, J. Chang, M. Coen and R. Lim, Anal. Chem., 2016, 88, 4651 CrossRef CAS PubMed.
- T. J. Liang, Hepatology, 2009, 49, S13 CrossRef CAS PubMed.
- I. M. Rosenberg, Protein analysis and purification, Birkhäuser, Boston, 1996 Search PubMed.
- M. Ihira, S. Akimoto, F. Miyake, A. Fujita, K. Sugata, S. Suga and T. Yoshikawa, J. Clin. Virol., 2007, 39, 22 CrossRef CAS PubMed.
- S. Jayawardena, C. Y. Cheung, I. Barr, K. H. Chan, H. Chen, Y. Guan and L. L. M. Poon, Emerging Infect. Dis., 2007, 13, 899 CrossRef CAS PubMed.
Footnote |
| † Electronic supplementary information (ESI) available. See DOI: 10.1039/c8ra07235c |
| This journal is © The Royal Society of Chemistry 2018 |


