 Open Access Article
Defect mediated mechanism in undoped, Cu and Zn-doped TiO2 nanocrystals for tailoring the band gap and magnetic properties†
V. R. Akshayab,
B. Arunab,
Shubhra Dashc,
Ajit K. Patrac,
Guruprasad Mandald,
Geeta R. Mutta e,
Anupama Chanda
 *f and
M. Vasundhara*ab
aMaterials Science and Technology Division, CSIR-National Institute for Interdisciplinary Science and Technology, Trivandrum-695 019, India. E-mail: mvas@niist.res.in; anupamamatsc@gmail.com
bAcademy of Scientific and Innovative Research (AcSIR), CSIR, Trivandrum, India
cDepartment of Physics, Central University of Rajasthan, India
dCentre for Rural and Cryogenic Technologies, Jadavpur University, Kolkata-700032, India
eNano-Materials Laboratory, School of Engineering and Physical Sciences, Heriot Watt University, Edinburgh EH14 4AS, UK
fDepartment of Physics, Dr Hari Singh Gour Central University, Sagar, Madhya Pradesh, India
First published on 17th December 2018
Abstract
Oxide based dilute magnetic semiconductor materials have been of great interest over the years due to their potential use in spintronic devices. However, the variations in the magnetic behavior of the materials have raised concerns regarding the origin of ferromagnetic properties which still needs to be explored. Manipulation of magnetic behavior in oxide based dilute magnetic semiconductors has become a challenge due to the interplay of intrinsic defects present in the material. TiO2 nanocrystals have been studied largely due to their challenging optical and magnetic properties. The present investigation studies in detail the structural, morphological, optical and magnetic behavior of non-magnetic element (Cu and Zn) doped TiO2, synthesized via a simple sol–gel technique. X-ray diffraction patterns and Raman spectra confirm the anatase phase and high resolution transmission electron microscopic results clearly indicate the formation of highly crystalline nanocrystals in all the samples with particle size ranging from 5–15 nm. Energy dispersive X-ray fluorescence spectroscopic studies reveal the compositional homogeneity of all the investigated samples. The presence of functional groups and molecular interactions were identified by Fourier transform infrared spectroscopy. Optical properties were studied through UV-visible and photoluminescence spectroscopy from which a significant reduction in band gap in Cu-doped TiO2 nanocrystals was found. X-ray photoelectron spectra confirm the presence of Ti3+, Cu2+, Cu+ and Zn2+ in Cu and Zn-doped TiO2 samples. The concept of bound magnetic polarons associated with the vacancy defects at both Ti, Cu, Zn and oxygen sites is used to explain the induced weak ferromagnetic behavior in undoped, Cu and Zn-doped TiO2 at room temperature. The overlapping of bound magnetic polarons could be the source of ferromagnetism irrespective of the non-magnetic nature of the dopant ion. The concentration of bound magnetic polarons is estimated using a Langevin fit and a detailed understanding of the variation of defect mediated magnetic properties is established with the help of PL analysis. A significant reduction in bandgap along with enhanced magnetization observed in the Cu-doped TiO2 material makes it suitable as a potential candidate for spintronics and magneto-optics applications. Room temperature magnetic properties of the Zn doped sample show a diamagnetic tail which is explained based on the defect centers and oxidation states of dopant ions present in the sample which is further verified with the help of XPS results.
Introduction
TiO2 is a wide-band-gap semiconductor, the nanocrystals of which find a large number of practical applications such as in dilute magnetic semiconductors (DMS),1 photo-catalysts,2 lithium-ion batteries3 and photo-electrochemical solar energy conversion.4–6 In the past decade, much attention has been focused on TiO2 specifically due to its interesting optical and electronic properties, non-toxicity, low cost, and high stability. The synthesis conditions, modification of nanostructured TiO2 and tailoring of the band gap have long been the core area of research which has drawn great attention. TiO2 can be treated as a multifunctional material but due to its wide band gap it can absorb only UV radiation and the total solar spectrum cannot be useful for practical purposes. Hence, the optoelectronics application requires tailoring of its energy band gap which can be obtained by suitable doping with appropriate dopants.Transition metal (TM) elements can successfully induce changes in the band gap and reports suggest that substitutional doping can alter the optical and magnetic properties of TiO2 nanocrystals.7–13 In general, nanosized semiconductor materials like TiO2 usually contain a large number of surface oxygen vacancies because of both surface and size effects. The oxygen vacancies strongly affect the electronic states, which modify the optical and magnetic properties.14–17 Therefore, the impact of oxygen vacancies on the material properties is considered to be a crucial factor for various applications. Further, depending on the type of TM ion dopant, TiO2 nanocrystals exhibit different optical and magnetic properties, which can be ferromagnetic (FM), paramagnetic (PM), superparamagnetic (SPM) or diamagnetic. It is expected that due to self purification mechanism, successful doping of nanocrystals will be a tedious job and distribution of dopant ions will be more near the surface than the core of the nanocrystals.18–20 It is well reported that doping with magnetic transition elements such as Fe, Co and Ni can induce ferromagnetism in TiO2.
TiO2 has also been studied largely as a DMS material for spintronics and magneto-optic devices21–23 due to its good optical transmission in UV-visible as well as in the near-infrared region. Our recent report well explains the magnetic properties of Co doped TiO2 in which it is suggested that Co doped TiO2 could be a potential candidate for DMS applications.24 The concept of DMS lies with the introduction of magnetic impurities to replace a small fraction of cations in the semiconductor host lattice. For practical applications of DMS based spintronics devices room temperature ferromagnetism (RTFM) is essential and the ferromagnetism should be intrinsic. The discovery of RTFM in Co-doped anatase TiO2 and ZnO23–26 invited world-wide attention on oxide-based DMS for spintronics devices. In particular, TiO2 has been given much importance due to its multifunctional applications, as an excellent photocatalyst as well as magneto-optic devices. Even though a good amount of work has been reported on TiO2 based DMS, the origin of RTFM in TiO2 is still under controversy. These controversies are due to the existence of intrinsic defects like oxygen vacancies or Ti interstitials or extrinsic contributions arising from magnetic clusters due to TM doping.24,27–35 It is interesting to note that RTFM has been even reported in un-doped and non-magnetic impurities doped TiO2 and other oxides36,37 which suggests the importance of defects in creating ferromagnetic ordering.
The structural and optical properties of TiO2 nanocrystals doped with different TM elements like Fe, Co, Ni, Cu, Mn, etc. and their influence on the magnetic properties and interaction of these doped ions with defects such as oxygen vacancies present in the TiO2 lattice have been reported.1,24,38–42 Recently, few reports have suggested that successful incorporation of metal ions into the host lattice can induce a red shift in the band gap of TiO2 material and create oxygen vacancies which contribute towards FM.43 Our recent report suggests that Co doping in TiO2 can induce FM, which could be due to the combined effect of inherent magnetism present in the doped element and oxygen vacancies present in doped TiO2.24 Very few studies have reported about the origin of magnetic behavior of non magnetic transition element doped TiO2 and the formation of both TM ion site vacancies and oxygen site vacancies. In the present study, we have investigated in detail the structural, morphological, optical and magnetic properties of undoped, Cu and Zn doped TiO2 nanocrystals synthesized by a simple and cost effective sol–gel technique. A significant reduction in bandgap in Cu-doped TiO2 as well as a narrowing of bandgap in Zn-doped TiO2 is obtained. The magnetic behavior of undoped, Cu and Zn doped TiO2 material has been explained based on bound magnetic polaron (BMP) model. The present work is focused on the study of the formation of Cu and Zn-doped TiO2 nanocrystals with defects associated with Ti and O site which ultimately decides the optical and magnetic behavior of these materials.
Experimental
Undoped, Cu (3%) and Zn (3%) doped TiO2 nanocrystals were synthesized by a simple sol–gel technique where titanium butoxide and corresponding metal nitrates were used as the Ti and metal ion precursors respectively. The synthesis approach enables the formation of stable anatase phase of all the studied samples and hence after named as T-P, T-Cu and T-Zn for undoped, Cu-doped and Zn-doped samples respectively. The resultant sol–gel materials were calcined at 400 °C for 3.5 h in a muffle furnace under ambient air atmosphere. Their structure and phase purity were studied by X-ray diffraction (XRD) at room temperature using PANalytical X'Pert Pro diffractometer with Cu-Kα radiation. The crystal structure of anatase TiO2 was generated using Vesta software. Micro-Raman spectroscopy was performed using Horiba Jobin Yvon LabRAM HR 800 micro-Raman spectrometer using 1800 grooves mm−1 grating, with the spectral resolution of 2 cm−1. All the experiments were performed using the excitation wavelength of 405 nm. The particle size and morphology were studied using High Resolution-Transmission Electron Microscopy (HR-TEM, FEI Tecnai F20, operated at 300 kV). Again, to confirm the elemental composition, an energy dispersive X-ray Fluorescence Spectrometry (ED-XRFS) study was carried out using PANalytical Epsilon 3 and further confirmed by Inductive Coupled Plasma – Mass Spectroscopy (ICP-MS, Thermofisher Scientific, Model iCAP-RQ-ICPMS). Functional group identification of the prepared nanocrystals was investigated by Fourier Transform-Infrared (FT-IR) spectra using a Bruker FT-IR spectrometer. The UV-visible spectra of the samples were recorded by a Shimadzu UV 2401 PC spectrophotometer and the emission spectra were obtained from a spectrofluorometer (Cary Eclipse, Varian). The X-ray photoelectron spectroscopy (XPS) study was carried out on powder samples at room temperature using a PHY 5000 Versa Probe II, ULVAC-PHI, Inc instrument. Al Kα was used as the X-ray source and pressure in the XPS chamber during the measurements was 5 × 10⁻¹⁰ mbar. The binding energies were corrected by taking C 1s as reference energy (C 1s = 284.60 eV). A wide scan was collected to ensure that no foreign material was present on the sample surface. The high-resolution scans of Ti 2p, Cu 2p and Zn 2p regions were collected. Curve fitting to the XPS spectrum was done using MultiPak Spectrum:ESCA. Background subtraction was done using the Shirley method. Room temperature magnetic studies were performed using vibrating sample magnetometer (VSM) attached to the physical property measurement system, Quantum Design Inc., (USA).Results and discussion
Fig. 1 shows the Rietveld refinement patterns of the T-P, T-Cu and T-Zn nanocrystals. All the samples were found to crystallize in the tetragonal anatase phase of TiO2 and match well with the JCPDS card no: 89-4921.44,45 Fig. S1 (given in ESI†) shows the indexed XRD patterns along with peak shift associated with each sample. No diffraction peaks related to Cu and Zn can be seen in the XRD pattern of T-Cu and T-Zn. The shifting of the highest intense (101) peak as well as change in full width at half maximum (FWHM) in T-Cu and T-Zn XRD patterns indicate the incorporation of Cu and Zn in the host lattice. The crystallite size calculated from XRD analysis for T-P, T-Cu and T-Zn are 12.10 nm, 13.31 nm and 11.27 nm respectively. Rietveld refinement was carried out by varying 16 parameters such as background parameters, unit cell, shape and isotropic thermal parameters, and oxygen occupancy using the Fullprof-98 program. The refined parameters of T-P, T-Cu and T-Zn are depicted in Table 1.| Compound | T-P | T-Cu | T-Zn |
|---|---|---|---|
| Phase | Anatase | ||
| Crystal structure | Tetragonal | ||
| Space group | I41/amd | ||
![[thin space (1/6-em)]](https://www.rsc.org/images/entities/char_2009.gif) |
|||
| Lattice parameters | |||
| a (Å) | 3.7901 | 3.7932 | 3.7940 |
| c (Å) | 9.4923 | 9.5016 | 9.5162 |
| Volume (Å)3 | 136.35 | 136.71 | 136.98 |
![[thin space (1/6-em)]](https://www.rsc.org/images/entities/char_2009.gif) |
|||
| Residual parameters | |||
| Rp | 4.56 | 3.98 | 3.38 |
| Rwp | 5.77 | 5.33 | 4.55 |
| χ2 | 1.89 | 1.94 | 1.83 |
The Rietveld refinement indicates the incorporation of Cu and Zn ions in the sol–gel derived TiO2 matrix. As a representative of the series, the anatase crystal structure of TiO2 derived using Vesta software is depicted in Fig. S2.† To further confirm the phase and crystallinity of T-P, T-Cu and T-Zn nanocrystals, Raman spectra were taken and are shown in Fig. 2. Raman spectrum of T-P nanocrystals exhibits peaks which are located at around 144, 196, 398, 520 and 640 cm−1. These peaks correspond to the lattice vibration of Eg (1), Eg (2), B1g (1), A1g + B1g (2), and Eg (3) modes of anatase TiO2 respectively.46–48 Raman spectra of T-Cu and T-Zn show typical spectra of anatase TiO2. Furthermore, there is no Cu or Zn related Raman peaks in doped TiO2 samples. The absence of the characteristic Cu and Zn vibration modes in the Raman spectra reveals that there is no segregation of Cu or Zn in TiO2 nanocrystals. These results clearly suggest the solid solution formation in T-P, T-Cu and T-Zn samples, which is consistent with the XRD analysis.
The absence of any other mode related to Cu, Zn, CuO, ZnO, Cu–Ti or Zn–Ti species within the detection limit of Raman spectra of doped samples indicates that the doped elements might have gone to the substitutional site replacing Ti in TiO2. The ionic size of Cu2+ (0.73 Å) is larger than that of Ti4+ (0.64 Å) and hence substitution of Cu on Ti site will distort the lattice structure. Also due to the charge difference between Ti4+ and Cu2+, substitution of Cu will generate oxygen vacancies in the lattice to maintain charge neutrality. It is very clear that the phonon confinement and non-stoichiometry due to defects associated with the system could induce disorders in the lattice leading to the shifting and broadening of Raman lines.48 Hence, it is believed that defects like oxygen vacancy in the material strongly affect the Raman modes. In our study, the most intense Eg (1) Raman mode at 144 cm−1 shows blue shifting and slight broadening with doping (Fig. 2(b)). XRD and TEM (discussed later) results show the crystallite size in the nanoscale range. So, both the phonon confinement and disorder in the host lattice induced due to the incorporation of Cu, Zn atoms/ions creating defects like oxygen vacancies in TiO2 have caused the shifting and broadening of the Raman peaks.49–51
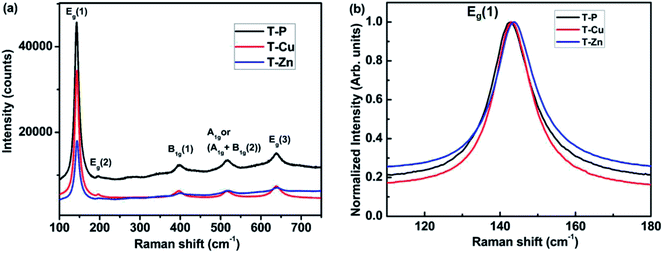 | ||
| Fig. 2 Raman spectra of (a) T-P, T-Cu and T-Zn samples (b) Raman peak shift of Eg (1) mode associated with T-P, T-Cu and T-Zn samples. | ||
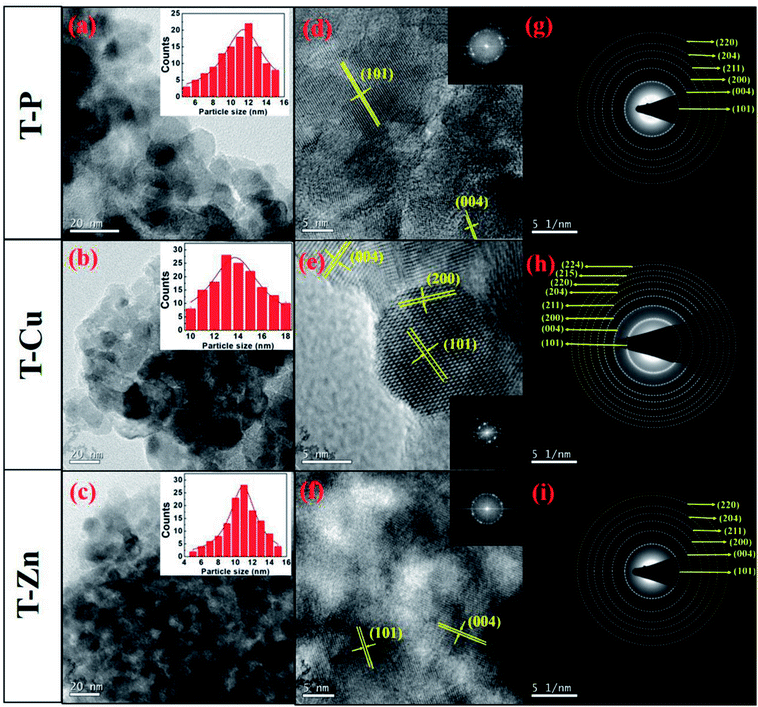
Detailed TEM micrographs showing the morphology of all the samples are given in Fig. 3. Interestingly, the morphology is highly dependent on synthesis conditions, which assisted the formation of nanocrystals with an average particle size of about 12 nm in T-P which further agrees well with the crystallite size estimated from the XRD results. It is reported that sol–gel route facilitates the formation of nanostructures.52,53 Cu substitution into the Ti site could result in lattice expansion due to larger ionic size of Cu and hence an increase in particle size is also expected as mentioned in the crystallite size calculation from XRD analysis. TEM results of T-Cu indicate the formation of nanocrystals having higher particle size (13 nm) than T-P sample (12 nm). Interestingly, T-Zn sample shows a decrease in particle size (11 nm) which also agrees well with the crystallite size calculated from XRD results. Previous reports suggest the reduction in particle size of TiO2 upon Zn doping.54 The T-P sample shows an average particle size of 12 nm and T-Zn samples show an average size of 11 nm suggesting that Zn doping has significantly decreased the size distribution of nanocrystals. Fig. 3(d–f) demonstrate the high resolution TEM images of T-P, T-Cu and T-Zn samples respectively. The high resolution TEM images show clear lattice fringes without any distortion in TiO2 and (Cu, Zn) nanocrystals indicating the high crystallinity of the nanocrystals. The estimated interplanar spacing of adjacent lattice fringes of T-P corresponds to the (101) and (004) planes of anatase TiO2 which are shown in Fig. 3(d). Similarly, (101), (004) and (200) planes of T-Cu are represented in Fig. 3(e) and high resolution TEM images and FFT suggest the crystalline nature and quality of the prepared samples. Further Fig. 3(f) demonstrates the (101) and (004) planes of T-Zn sample and the interplanar spacing obtained in each case are in accordance with the XRD patterns (Fig. 1). Fig. 3(g–i) represent the selected area diffraction patterns (SAED) of the T-P, T-Cu and T-Zn samples respectively which suggest the polycrystalline nature of all the samples and T-Cu shows an enhanced crystallinity among the three samples, which again corroborates with high resolution TEM images and lattice fringes as discussed earlier.
To investigate on the elemental compositions, an ED-XRF analysis was carried out on all the samples. The stoichiometries of all the studied compounds were found by ED-XRF analysis. Chemical compositions of T-P, T-Cu and T-Zn are given in Table 2. The undoped TiO2 is dominated with 99.97% TiO2 which clearly shows the presence of TiO2 alone and the slight mismatch could be covered within the limit of experimental error. It is evident that the ratios of Ti![[thin space (1/6-em)]](https://www.rsc.org/images/entities/char_2009.gif) :
:![[thin space (1/6-em)]](https://www.rsc.org/images/entities/char_2009.gif) Cu and Ti
Cu and Ti![[thin space (1/6-em)]](https://www.rsc.org/images/entities/char_2009.gif) :
:![[thin space (1/6-em)]](https://www.rsc.org/images/entities/char_2009.gif) Zn are very much close to the nominal compositions for T-Cu and T-Zn respectively. It is worthwhile to note that the ratio of Ti
Zn are very much close to the nominal compositions for T-Cu and T-Zn respectively. It is worthwhile to note that the ratio of Ti![[thin space (1/6-em)]](https://www.rsc.org/images/entities/char_2009.gif) :
:![[thin space (1/6-em)]](https://www.rsc.org/images/entities/char_2009.gif) (Cu, Zn) were also found to be the same as that of the expected single phase composition within the limits of experimental error. Further, the elemental composition and accuracy are verified using ICP-MS analysis and the results are shown in Table 3.
(Cu, Zn) were also found to be the same as that of the expected single phase composition within the limits of experimental error. Further, the elemental composition and accuracy are verified using ICP-MS analysis and the results are shown in Table 3.
| Compound | Percentage of elemental oxide |
|---|---|
| T-P | 99.97% TiO2 |
| T-Cu | 97.10% TiO2 + 2.90% CuO |
| T-Zn | 97.03% TiO2 + 2.97% ZnO |
| Material | Molar ratio of TM/Ti (TM = Cu, Zn) | Actual composition |
|---|---|---|
| T-P | 0 | TiO2 |
| T-Cu | 0.032 | Ti0.97Cu0.03O2 |
| T-Zn | 0.034 | Ti0.97Cu0.03O2 |
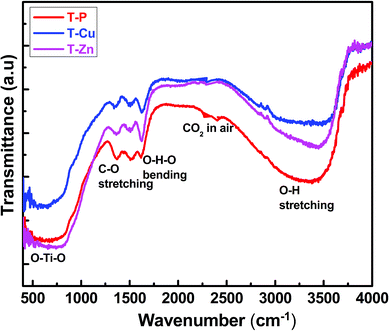
FT-IR spectroscopy technique gives information about the functional groups, inter and intra-molecular interactions and the molecular geometry of the compound. FT-IR spectra of all the samples were taken at room temperature to identify the various functional groups and vibrational bands present in the samples which are shown in Fig. 4. Different bands observed in FT-IR spectra of T-P, T-Cu and T-Zn nanocrystals are summarized in Table S1.† Among the different bands that appear in the spectra, the broad band around 3500 cm−1 corresponds to the stretching vibration of OH groups and could be due to the OH group associated with the Ti atoms, i.e., Ti–OH. The narrow band around 1650 cm−1 is well known for the characteristic bending vibrations of H–O–H. However, the peak close to 1400 cm−1 has been ascribed to C–O stretching bond present in the precursor material as discussed earlier. This peak might have arisen as a result of the organic radical from Ti-butoxide which is adsorbed in the nanocrystals. The presence of organic components in studied samples are clearly observed from TEM images shown in Fig. 5, in which the amorphous regions have been shown which suggest the existence of organic residues along with crystalline TiO2 nanocrystals. The FFT corresponding to different regions are also clearly demonstrated in Fig. 5. The band centered at nearly 550 cm−1 are due to bonding among metal and oxygen, i.e., metal–oxygen bonds of (Ti–O) in undoped, (Ti–O, Cu–O) and (Ti–O, Zn–O) in Cu and Zn doped TiO2 nanocrystals.55,56 Furthermore, no peak corresponding to any other oxide phases of doped elements appeared in the spectra. It reveals that doped metal ions are introduced into the Ti framework. This result corroborates with the results of XRD, TEM and ED-XRFS as mentioned earlier.
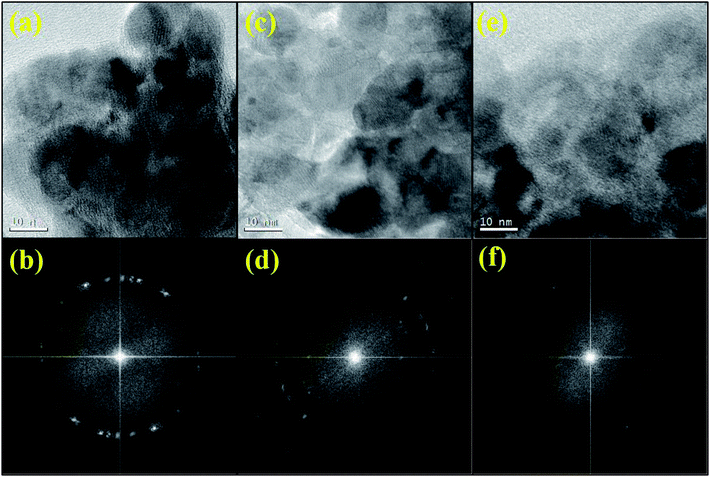 | ||
| Fig. 5 TEM images and corresponding FFT patterns of T-P (a and b) T-Cu (c and d) and T-Zn (e and f) showing the coexistence of both amorphous and crystalline regions. | ||
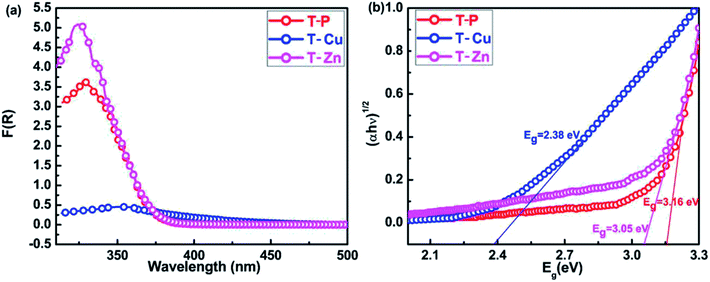
Fig. 6(a) shows the UV-visible absorption spectra of all the samples. The optical absorption of all the samples was obtained from the diffuse reflectance spectra using Kubelka–Munk equation. The Cu and Zn doped TiO2 nanocrystals show a regular shift of the absorption edge towards longer wavelengths due to incorporation of Cu and Zn in TiO2. The undoped TiO2 sample shows an optical absorption near 375 nm, which is ascribed due to the electronic transition between valence and conduction band. A slight shift in optical absorption edge is observed for T-Zn which is around 385 nm whereas a clear red shift is observed for T-Cu towards longer wavelength. It is clear from XRD and TEM analysis that particle size is decreased with Zn doping and previous reports suggest that the red shift of the absorption edge cannot be due to quantum confinement effect.57 New energy bands are created within the band gap of TiO2 due to these metal ion doping. The transition from valence band to intra-band energy levels or from these intermediate levels to the conduction band can cause the red shift of the absorption edge of TiO2. This red shift can be taken as an evidence for the incorporation of doped metal ions into the TiO2 lattice. The band gap (obtained from Tauc's plot) observed for T-P, T-Cu and T-Zn are 3.16 eV, 2.38 eV and 3.05 eV respectively which are illustrated in Fig. 6(b). The decrease in band gap for T-Cu and T-Zn is due to the incorporation of metal ions into host crystal lattice. The red shift in bandgap due to Cu and Zn doping can be due to sp–d exchange interactions between the band electrons and the localized d-electrons of Cu2+ and Zn2+ ions substituting Ti4+ ions. The s–d and p–d exchange interactions give rise to downward shifting of conduction band edge and upward shifting of valence band edge resulting in narrowing of bandgap. The interaction of these metal ions with the conduction band electrons could have shifted the valence band by lowering the conduction band which results in the reduction of band gap for the doped TiO2 nanocrystals.
PL spectra provides information regarding structural matters, defects in the crystal lattice and trap states of the material which decides the electronic structure of materials. Thus PL spectra recorded for all the samples are shown in Fig. 7(a). The deconvoluted PL spectra of T-P, T-Cu and T-Zn are represented in Fig. 7(b), (c) and (d) respectively, from which strong emission peaks are observed in the range 370–600 nm. The emission peak observed around 390 nm is due to the near band edge emission of host TiO2. The emission peaks located in between 400–450 nm have arisen as a result of self-trapped excitons (STE), oxygen vacancies, surface defects, etc.58–61 The STE arises when a trapped electron captures a hole in TiO2, more clearly, the recombination occurs through oxygen vacancies present in the system. Since oxygen vacancies are intrinsic defects in TiO2 and Cu/Zn doping also creates oxygen vacancies due to the substitution of Cu+/Cu2+/Zn2+ on Ti4+, the emissions around 400–450 nm are probably due to STE.58–61 The emission peak at 490 nm appears as a result of charge transition from Ti3+ to TiO62− linked with oxygen vacancies62 and the peak at nearly 520 nm may have appeared due to the F+-center formation.63,64 The hydroxyl (OH) species as observed in the FTIR spectra as well as confirmed from XPS analysis (which are discussed in the coming sections), can create an acceptor level just above the valence band and contributes for the observed emission near 600 nm.14 It is expected that the presence of oxygen deficiency in small amounts cannot be ruled out in the air annealing process and hence the multiple oxidation states of Ti is expected in the system which is discussed in detail in the later sections.
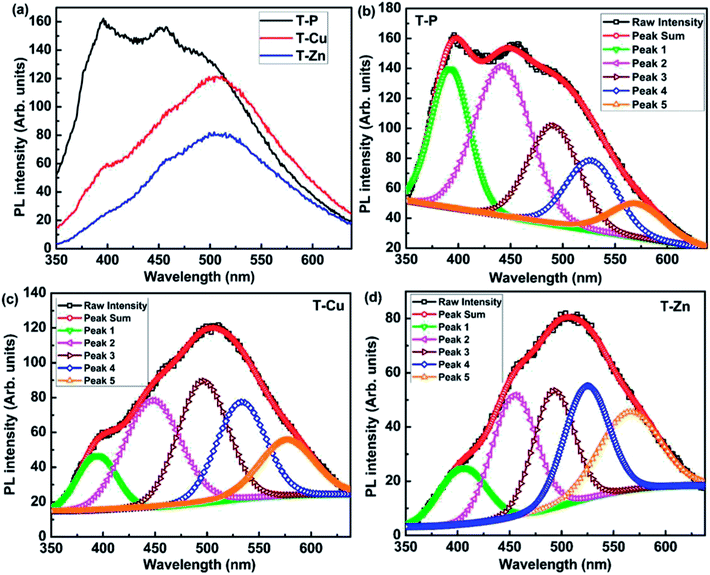 | ||
| Fig. 7 PL spectra of (a) T-P, T-Cu and T-Zn samples (b) deconvoluted PL spectra of T-P, (c) T-Cu and (d) T-Zn. | ||
The magnetic properties of undoped, Cu-doped and Zn-doped TiO2 nanocrystals were studied by VSM. The M–H measurements on all the samples were performed by varying the magnetic field from −90 kOe to +90kOe at room temperature. The M–H curves obtained for all the samples are shown in Fig. 8(a) from which a PM behavior is observed for T-P and T-Cu whereas a diamagnetic tail is noticed for T-Zn. However, it is interesting to note that the M–H loops show weak FM in T-P and T-Cu sample (Fig. 8(b) and (c)) at lower fields. There is a slight increase in the magnetic moment in T-Cu sample. The inset in Fig. 8(b) shows the M–H plot (zoomed) at lower field of T-P sample at 300 K which gives coercivity (Hc) of 305 Oe. There is a similar observation for T-Cu sample as shown in inset of Fig. 8(c) from which Hc of 120 Oe is noticed. It can be interpreted that different oxidation states of both Ti and Cu might have induced weak FM in the case of T-Cu sample. Hence, the electronic contribution from Cu+ and Cu2+ could have played crucial role in determining the magnetism of the T-Cu material. The contribution from either Ti3+/Cu2+ cannot be disregarded in T-P and T-Cu samples, due to which weak FM might have observed at lower fields. RTFM is generally observed when magnetic impurities are introduced into the host lattice due to the FM behavior of the magnetic impurities. Interestingly, very few reports have suggested the observation of PM and FM behavior due to the presence of non-magnetic impurities which could be mainly due to the charge carriers trapped by oxygen vacancies.27–35 Some reports65 have demonstrated the suppression of FM in TiO2 even in the presence of magnetic impurities resulting in PM or antiferromagnetic (AFM) behavior due to the presence of secondary phases associated with the reported samples. In the present study, XRD and Raman analysis eliminate the presence of any other secondary phases like Cu or Cu related oxides in the case of T-Cu sample. It is interesting to note that undoped TiO2 exhibits weak RTFM which may have arisen due to intrinsic defects such as Ti site vacancies, oxygen vacancies, Ti3+ ions or Ti interstitials.
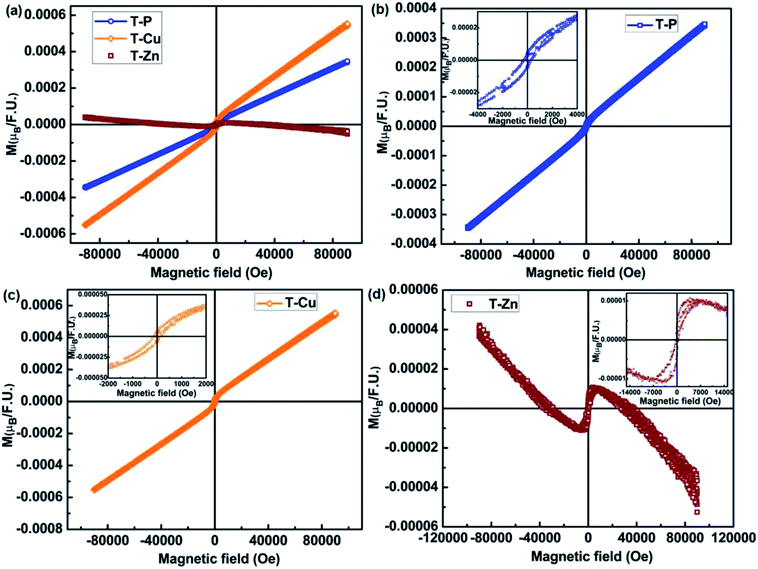 | ||
| Fig. 8 Room temperature M–H curves of (a) T-P, T-Cu and T-Zn nanocrystals, (b) T-P, (c) T-Cu and (d) diamagnetic behavior of T-Zn, insets in (b)–(d) show the M–H plots (zoomed) at lower field. | ||
This observation on the RTFM in nonmagnetic DMS materials such as TiO2 based system reveals that magnetic properties may not be completely depending on the magnetic ions, but may be mediated effectively by the point defects such as oxygen vacancies or host lattice vacancies. Thus, point defects mediated FM is termed as ‘d0 ferromagnetism’ which is commonly noticed in nanostructures having high surface area to volume ratio and exhibiting notable surface defects.66,67 Hence, the size and morphology of nanostructures can strongly determine the observed FM, which is so crucial in studying the defect-related FM. The occurrence of intrinsic magnetic moment in TiO2 nanoparticles can be explained by the magnetic interactions caused by the isolated magnetic moments arising as a result of partially filled electron shells due to imperfections at the surface and inter surface ultimately leading to the surface magnetic moments in nonmagnetic TiO2 material. Hence, it can be assumed that surface defect states of TiO2 nanoparticles could be responsible for the intrinsic origin of the macroscopic d0 FM in TiO2 nanostructures.
The presence of FM in both T-P and T-Cu and an increase in magnetic moment in T-Cu indicate that magnetism can be enhanced due to Cu-doping which may have created more vacancies/Ti3+ ions which is well in accordance with the PL results. But in the case of Zn-doped samples although magnetization is observed at lower fields as shown in Fig. 8(d), but an absence of clear PM/FM behavior indicates that long range FM ordering has been lost in the sample, which can be due to the interaction of oxygen vacancies/Zn2+ ions with Zn ions inhibiting FM/PM. Although, the T-Zn sample exhibits a diamagnetic behavior at higher magnetic fields, a positive response to the magnetic field well below 1 Tesla is observed (as shown in the inset of Fig. 8(d)). The observation of weak FM at lower magnetic fields might be due to the presence of oxygen vacancy defects and Ti/Zn site defects. A very weak FM observed at lower fields could be attributed to the d0 mechanism as explained above. This could lead to the formation of bound magnetic polarons (BMPs) similar to undoped and Cu-doped samples where small particle size could induce single domain in the system. Raman, UV-visible and XPS analysis indicate the presence of defects like Ti/Cu/Zn site vacancies or oxygen vacancies in T-P, T-Cu, T-Zn samples. The presence of these deficiencies in both undoped and Cu, Zn doped samples may have been obtained due to the synthesis conditions, surface defects especially arising when nanostructuring due to particle size reduction and these vacancy defects are responsible for variation in the magnetic behavior observed in undoped and doped samples of TiO2.68 A perfect diamagnetism is absent in Zn-doped sample as shown in Fig. 8(d) and a diamagnetic tail is observed which is due to the effect of surface defects and oxygen vacancy defects even though stable Zn2+ and Ti4+exist in the T-Zn sample.
In order to have a detailed understanding of the relationship between magnetic properties and oxidation states of Ti, Cu, Zn and oxygen, XPS spectra have been recorded for all the samples and are shown in Fig. 9–11. Fig. 9(a) shows the wide scan spectra of undoped TiO2. Elemental scan of Ti in undoped sample is shown in Fig. 9(b). The binding energies of Ti 2p3/2 and Ti 2p1/2 for the undoped sample are 458.09 eV and 463.76 eV, which are consistent with that of Ti4+. The small peaks at 457.31 eV and 461.10 eV confirm the presence of Ti3+ which indicate the existence of both Ti3+ and Ti4+ in the T-P sample.69 Hence, the peaks corresponding to the binding energy of both Ti3+ and Ti4+ ions were observed,70 which suggests the delocalization of electrons between oxygen vacancies and Ti3+ ions on the surface. The O 1s spectra of undoped sample is shown in Fig. 9(c) and the deconvoluted O 1s peak gives three peaks at 529.43 eV, 529.81 eV and 531.41 eV which are ascribed to surface oxygen, probably in the form of surface hydroxyl groups and Ti–O–Ti group.71,72
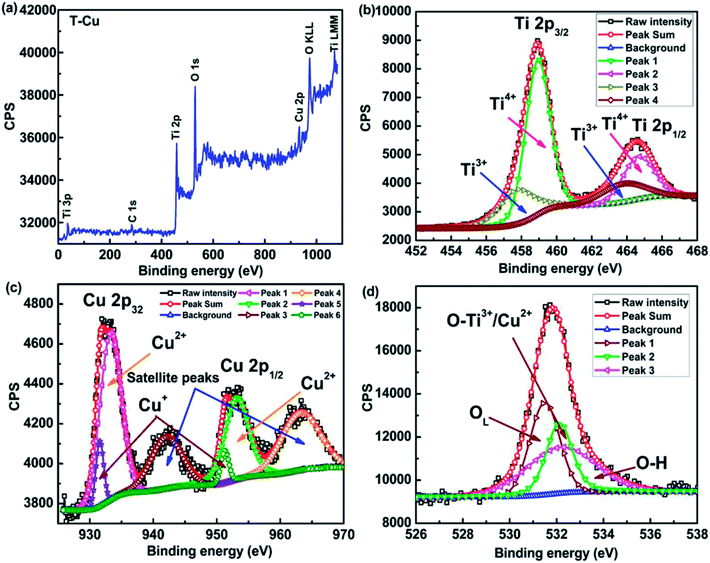 | ||
| Fig. 10 XPS spectra of T-Cu sample (a) wide scan showing the presence of Cu (b) Ti 2p and (c) Cu 2p (d) O 1s spectra along with deconvolution. | ||
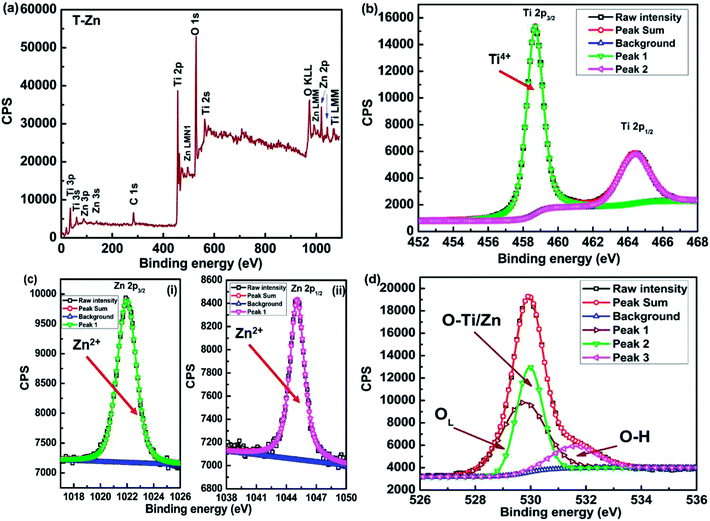 | ||
| Fig. 11 XPS spectra of T-Zn sample (a) wide scan showing the presence of Zn (b) Ti 2p and (c) Zn 2p and (d) O 1s spectra along with the deconvolution. | ||
The XPS wide scan of T-Cu is represented in Fig. 10(a), which indicates the presence of Cu with the appearance of Cu 2p peak.69 The elemental scans of Ti, Cu and O are shown in Fig. 10(b), (c) and (d) respectively. The peaks at 457.51 eV and 463.94 eV correspond to the presence of Ti3+ and at 458.97 eV and 464.72 eV corresponds to Ti4+ ions.69 Hence, the presence of both Ti3+ and Ti4+ is confirmed in Cu doped samples. The binding energy of 931.64 eV and 933.45 eV of Cu 2p3/2 suggest the presence of Cu+ and Cu2+ in the present system69,73 rather than metallic Cu74,75 and hence Ti3+/Ti4+/Cu+/Cu2+ interactions are possible in the Cu doped system. A slight shift in the peak position of O1s spectra was observed in Cu doped sample in comparison to the undoped sample indicating a change in the surface environments of Cu doped sample. The O 1s spectra of Cu doped sample show a red shift at 531.49, 532.10 and 533.33 eV respectively, which indicates a lesser contribution from the Ti3+–O bonds.76 The contribution of surface oxygen is significantly more in T-Cu in comparison to undoped T-P as shown in Fig. 10(d).
The appearance of Zn 3s and Zn 3p peaks in the wide scan of T-Zn sample indicates the presence of Zn in T-Zn sample which is represented in Fig. 11(a). The detailed elemental scans of Ti, Zn and O are depicted in Fig. 11(b), (c) and (d) respectively. The peaks corresponding to 458.69 and 464.48 eV represent the Ti 2p3/2 and Ti 2p1/2 states which suggest that Ti exists as Ti4+ in T-Zn sample as shown in Fig. 11(b) where peaks corresponding to Ti3+ are completely absent. In the elemental scan of Zn, two peaks of Zn 2p spectrum corresponding to Zn 2p3/2 and Zn 2p1/2 electronic states of Zn(II) with binding energies of 1021.99 eV and 1045.08 eV are observed which are clearly shown in Fig. 11(c). Hence, it is confirmed that Zn is bivalent in T-Zn. Therefore, it is well understood that Zn2+ exist mainly in ZnO clusters dispersed on TiO2 surface and this could be the reason for perfect diamagnetism exhibited by T-Zn as shown in Fig. 8(d). The O 1s spectra of T-Zn sample is shown in Fig. 11(d) and after deconvolution, the O 1s peak of the sample is split into three peaks at 529.89, 530.01 and 531.58 eV. The behavior of O 1s spectra of T-Zn is almost similar to T-P and slight peak shift observed among T-P, T-Cu and T-Zn could be due to the different surface oxygen contributions present in the respective samples. The intense peak at about 529.89 eV arises due to the oxygen in the TiO2 crystal lattice (OL), while the other oxygen peaks are the outcome of Ti–O/Zn–O bonds (OTi4+/OZn2+, 530.01 eV) and the hydroxyl group (OH, 531.58 eV) respectively as shown in Fig. 11(d).
In the present study, we have attempted to investigate the influence of TM ion site vacancies and oxygen vacancies on the magnetic behavior of the TiO2 material due to the incorporation of non-magnetic elements in TiO2. The origin of RTFM observed for the undoped sample (inset of Fig. 8(b)) has been mainly attributed to the particle size effect, defect concentration and Ti oxidation states. It has been observed that the reduction of particle size has a strong influence on the magnetic properties of nanostructured TiO2 material. The observed results suggest that the nanocrystalline material form in such a way that larger particles would be preferentially doped over the smaller particles. As the grain size further decreases, the surface area to volume ratio increases and the contribution from the grain boundary defects increases. Thus the inside of the nanocrystalline compound has magnetic properties same as that of the bulk counterpart while the amorphous outer layer is magnetically disordered due to more crystallographic defects and oxygen vacancies. Thus, due to the high disordered state of the outer region, the net magnetic moment of this amorphous region is zero, which in turn reduces the magnetization of the nanocrystalline compound compared to that of bulk counterpart. There is a strong exchange coupling taking place between the inner region and outer region of the nanocrystalline compound. The magnetically disordered state in the outer layer has a surface anisotropy contribution towards the effective anisotropy of the nanocrystalline compound. The effect of the surface anisotropy increases with a decrease in crystallite size. Thus the broken symmetry due to the grain surface effects has a strong influence on the magnetic properties of nanocrystalline materials. The variation of magnetic moment and coercivity with particle size has been plotted and is shown in Fig. S3.† One of the theoretical report suggest that a weak FM component in Ti can exist as a result of oxygen vacancy even without the presence of any secondary phases or magnetic impurities present at the Ti site.77 Even though there is a weak FM behavior, a considerable magnetic moment may not be observed with the generation of oxygen vacancy interaction with the trapped electrons in TiO2 material.78 Depending on the magnetic interactions present between the Ti3+/Ti4+ ions and Ti3+ interaction with oxygen site vacancies, magnetic interactions such as diamagnetism, AFM, ferrimagnetism or FM could be liable to occur in undoped TiO2 system. The charge redistribution associated with the oxygen vacancies can decide the magnetic properties of TiO2 material, which is reflected in the controversial results obtained in different TiO2 based systems.77,78 Oxygen vacancy is associated with the formation of F-centres and the interaction of these leads to the change in magnetic behavior of the material due to the trapping of electrons and charge redistribution occurring on the surface of TiO2. When such an electron trapping occurs on the surface of TiO2, it results in the formation of an F-centre and an electron interacting with the F-centre could play with the nearby localized Ti4+ and subsequently, conversion of Ti4+ ions to Ti3+ ions occurs, leading to the formation of an F+-centre.14 The formation of Ti3+ is confirmed from the XPS analysis and F+ defect centers are observed from the PL analysis as discussed in the previous section. Bound magnetic polarons (BMPs) may be generated as a result of localization of electrons in the F+-centre and could develop magnetism by ordering the electron spin associated with Ti3+ (3d1) located around oxygen vacancies. In the case of undoped TiO2 sample, s–d exchange interaction associated with the 1s1 electron spin of the F+-centre and the 3d1 electron spin originating from Ti3+ ions could easily favor a long-range FM ordering which is reflected in the magnetic measurements. Another possible way to get the FM behavior in undoped sample is the O 2p orbitals that arise from Ti site vacancy rather than the Ti 3d orbitals and oxygen vacancies. Hence, the intensity of d0 magnetism in the undoped TiO2 nanostructures is determined by the population of Ti site vacancy at surface and or edge regions. To control the RTFM in undoped TiO2 nanostructures, in general, factors towards surface defect state and defect density is to be manipulated. From these observations, the best strategy to promote RTFM in undoped TiO2 for spintronics related applications is to stabilize enough Ti vacancies near the surface in TiO2 nanostructures by maintaining the crystalline quality of the material. Hence, a combined effect among the surface defects, Ti site vacancy and oxygen vacancy is ultimately leading to the electrons trapped at the defect sites leading to the BMP formation and ultimately deciding the magnetic behavior of undoped TiO2 nanostructures. The interaction will be much stronger if the dopant ion contributes some 3d electrons which is exactly happening between the F+-centre and Cu2+ ions to generate more number of BMPs, hence along with the s-d interaction mentioned above, another interaction in Cu-doped TiO2 could arise among the F+-centers and 3d9 electron spin of Cu2+ ions leading to FM ordering and enhanced magnetic moment. Previous reports suggest the formation of a 1s2 state with the doubly occupied F-centers, which leads to a weak AFM interaction.79 It is clear from these discussions that the ability of a system to generate more number of BMPs either due to Ti3+ or Cu2+ ions with the F+-centre or both together, where an orbital overlapping with the unpaired 3d1 electron of Ti3+ ions or the unpaired 3d9 electron of Cu2+ ions is responsible for the observed RTFM which has happened in the present case, i.e., in T-Cu sample. Here, the concept of mixed valence ions also holds good along with the concept of surface defects and hence the possible role of charge transfer FM can also be used to explain the RTFM.80,81 The room temperature M–H loop at lower fields show a weak FM behavior in T-Zn, which further corroborates the PL results and the formation of defect centers and surface free electrons inherently present in the TiO2 system is crucial in determining the magnetic behavior in the T-Zn sample. Rather than the oxygen vacancies, O 2p orbitals resulting from Ti/Zn site vacancy could be favorable for the magnetic response of T-Zn at lower fields. However, the diamagnetic tail observed at higher fields indicates the presence of Ti4+ and Zn2+ in T-Zn sample which is in agreement with the XPS results. BMP fitting on undoped and Cu, Zn doped samples was carried out to investigate the impact of oxygen vacancy and non-magnetic ion concentrations. The fitting has been carried out on the recorded M versus H data to the BMP model as explained in the previous report.82,83 According to this model, the measured magnetization can be fitted using the following relation;
| M = M0L(x) + χmH. | (1) |
In the above mentioned equation, the first term accounts for BMP contribution and the second term is associated with the PM matrix contribution. The value of M0 can be represented as the product of N and ms, where N is the number of BMPs involved (per cm3) and ms is the effective spontaneous magnetic moment per BMP. The Langevin function, L(x) is defined as L(x) = coth(x) – 1/x where x = meffH/kβT. The term meff is the true spontaneous magnetic moment per BMP and it can be approximated to ms. The parameters M0, meff and χm are the variables in the fitting process. The experimental and fitted data to estimate the BMP concentration for both undoped and Cu, Zn doped samples are represented in Fig. 12(a), (b) and (c) respectively and it can be observed that the fitted data are very well in accordance with the experimental data. The obtained parameters are represented in Fig. 12(d) from which the BMP concentration is found to be highest in T-Cu sample due to which the magnetic moment is more in comparison to T-P or T-Zn which is corroborated with the size versus moment plot shown in Fig. S3.†
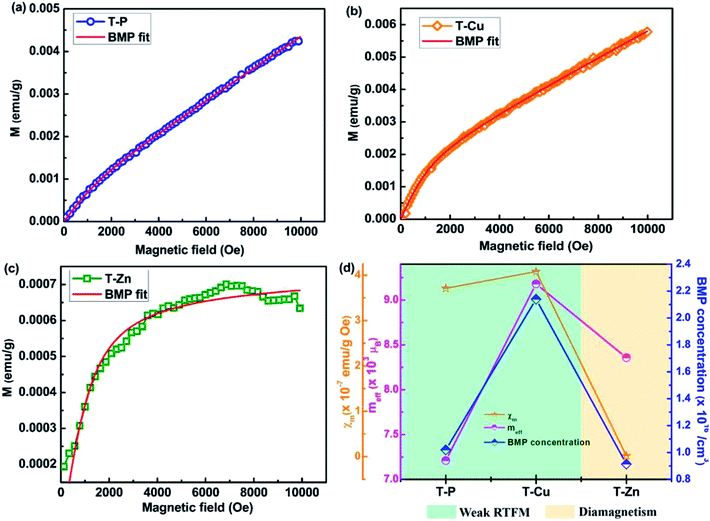 | ||
| Fig. 12 BMP fitting employed to estimate the concentration of magnetic polarons of (a) T-P and (b) T-Cu (c) T-Zn and (d) parameters obtained from langevin-fit for T-P, T-Cu and T-Zn. | ||
In order to have a clear understanding regarding the spin interactions in these samples, a schematic representation is developed based on the results of XPS analysis which is depicted in Fig. 13. As per the earlier discussions, the presence of Ti3+ is suggested in undoped T-P sample along with Ti4+. The ratio of Ti3+ to Ti4+ is considerably small as shown in Fig. 9(b). Still, this small fraction of Ti3+ could have unpaired electrons in the 3d state as shown in Fig. 13 and it can interact with the oxygen vacancy centers associated with the T-P sample as discussed previously. In the case of T-Cu, Cu2+ can be considered to be magnetic with one free electron and defect centers on the surface of TiO2 system locally traps the electrons, ultimately leading to the formation of an F-centre where one of the electrons associated with the F-centre will have a tendency to interact with the adjacent localized Ti4+ and convert Ti4+ ions to Ti3+ ions, resulting in the formation of an F+-centre. This mechanism can be well corroborated with the magnetic measurements also. But in the case of Zn-doped samples, Zn2+ is the most stable oxidation state which is diamagnetic in nature and the formation of both Ti3+ and F+-centre will be hindered here ultimately leading to the diamagnetic tail like behavior of the sample. The formation of F-centers and F+-centers will be facilitated due to the trapped electrons in these defect sites. The F+-center formation ultimately leads to the formation of BMPs, which favors the FM interaction. The room temperature M–H loop at lower fields shows a weak RTFM which further corroborates the PL results and the formation of defect centers and 3d1 interaction of Ti3+/Cu2+ plays a crucial role in generating the magnetic response in the undoped and Cu-doped sample.
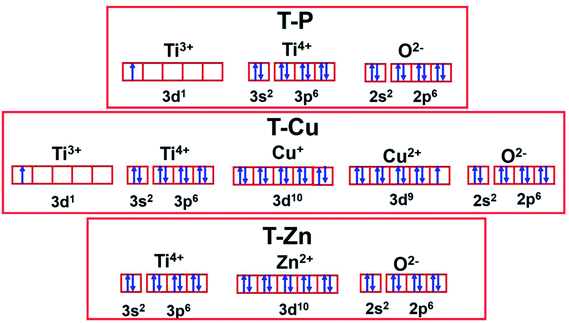 | ||
| Fig. 13 Schematic showing the spin state interactions of valence shell electrons in T-P, T-Cu and T-Zn. | ||
A similar behavior is observed for T-Zn also especially at lower magnetic fields, whereas at higher fields, i.e., above 10![[thin space (1/6-em)]](https://www.rsc.org/images/entities/char_2009.gif) 000 Oe, the magnetic contribution from Ti4+ and Zn2+ magnetic contribution is dominated and ultimately diamagnetic tails are observed and hence the ratio of Ti3+/Ti4+ is crucial in determining the magnetic behavior in both undoped and doped samples. The previous discussions suggest the absence of expected perfect diamagnetism in T-Zn due to the defects associated with the system and the XPS results illustrate the presence of Ti4+ and Zn2+ in the T-Zn system, where there is no unpaired electrons at all to contribute towards a long range FM as shown in Fig. 13 and 14.
000 Oe, the magnetic contribution from Ti4+ and Zn2+ magnetic contribution is dominated and ultimately diamagnetic tails are observed and hence the ratio of Ti3+/Ti4+ is crucial in determining the magnetic behavior in both undoped and doped samples. The previous discussions suggest the absence of expected perfect diamagnetism in T-Zn due to the defects associated with the system and the XPS results illustrate the presence of Ti4+ and Zn2+ in the T-Zn system, where there is no unpaired electrons at all to contribute towards a long range FM as shown in Fig. 13 and 14.
 | ||
| Fig. 14 Schematic showing the BMP interactions in (a) T-P, (b) T-Cu and (c) absence of BMP formation in T-Zn. | ||
Conclusion
Structural, optical and magnetic properties of sol–gel derived undoped, Cu and Zn doped TiO2 nanocrystals have been investigated. X-ray diffraction and Raman spectroscopy confirm the formation of anatase TiO2 phase and detailed morphological and structural analysis using high resolution transmission electron microscopy reveals the nanocrystal formation for both undoped and (Cu, Zn) doped TiO2. The UV absorption spectra illustrates a red shift in the absorption edge for the doped samples indicating the successful incorporation of doped ions into the TiO2 lattice. Cu doped TiO2 shows a large shift in the absorption edge giving rise a significant reduction in bandgap which favors the visible light photoactivity. The electronic transitions from conduction band to valence band, radiative recombination of self-trapped excitons and the information regarding the defect centers are explained using PL spectra. The undoped and Cu doped samples show a positive slope of magnetization up to a field of 9 tesla and the magnetic moment is more prominently enhanced in Cu-doped TiO2 than undoped TiO2. A significant reduction in bandgap along with enhanced magnetization makes Cu-doped TiO2 a suitable candidate material for future spintronic and magneto-optic applications. A diamagnetic tail is observed for Zn-doped TiO2 in the magnetic field ranging from 1 tesla to 9 tesla and a perfect diamagnetism is not observed in Zn doped TiO2 due to the defect centers which is well explained using the BMP model and detailed XPS analysis.Conflicts of interest
There are no conflicts of interest to declare.Acknowledgements
The authors would like to acknowledge the financial support received from Council of Scientific and Industrial Research (CSIR), Govt. of India. V. R. Akshay and B. Arun are thankful to Council of Scientific and Industrial Research (CSIR), Government of India for granting the Senior Research Fellowship and also thankful to Academy of Scientific and Innovative Research (AcSIR), CSIR. The authors would also like to thank Department of Science and Technology, sponsored project GAP 232339 for partially supporting this work.References
- B. Santara, B. Pal and P. K. Giri, J. Appl. Phys., 2011, 110, 114322 CrossRef.
- J. Schneider, M. Matsuoka, M. Takeuchi, J. Zhang, Y. Horiuchi, M. Anpo and D. W. Bahnemann, Chem. Rev., 2014, 114(19), 9919–9986 CrossRef CAS PubMed.
- J. Wei, Adv. Mater. Res., 2013, 750–752, 301–306 Search PubMed.
- Y. Tang, C. Lee, J. Xu, Z. Liu, Z. Chen, Z. He, Y. Cao, G. Yuan, H. Song, L. Chen, L. Luo, H. Cheng, W. Zhang, I. Bello and S. Lee, ACS Nano, 2010, 4(6), 3482–3488 CrossRef CAS PubMed.
- I. Gur, N. A. Fromer, M. L. Geier and A. P. Alivisatos, Science, 2005, 310, 462–465 CrossRef CAS PubMed.
- Y. Cong, J. Zhang, F. Chen, M. Anpo and D. He, J. Phys. Chem. C, 2007, 111, 10618–10623 CrossRef CAS.
- Z. Y. Zhao, Z. S. Li and Z. G. Zou, ChemPhysChem, 2012, 13, 3836 CrossRef CAS.
- X. H. Yu, T. J. Hou, X. H. Sun and Y. Y. Li, ChemPhysChem, 2012, 13, 1514 CrossRef CAS PubMed.
- H. M. Weng, X. P. Yang, J. M. Dong, H. Mizuseki, M. Kawasaki and Y. Kawazoe, Phys. Rev. B, 2004, 69, 125219 CrossRef.
- X. S. Du, Q. X. Li, H. B. Su and J. L. Yang, Phys. Rev. B, 2006, 74, 233201 CrossRef.
- L. H. Gan, C. C. Wu, Y. Tan, B. Chi, J. Pu and L. Jian, J. Alloys Compd., 2014, 585, 729 CrossRef CAS.
- Y. Li, Y. Yue, Z.-Q. Que, M. Zhang and M. Guo, Int. J. Miner., Metall. Mater., 2013, 20, 1012 CrossRef CAS.
- M. Pal, U. Pal, J. M. Gracia, Y. Jiménez and F. PérezRodrıguez, Nanoscale Res. Lett., 2012, 7, 1–12 CrossRef PubMed.
- B. Santara, P. K. Giri, K. Imakita and M. Fujii, Nanoscale, 2013, 5, 5476–5488 RSC.
- H.-Y. Lee, S. J. Clark and J. Robertson, Phys. Rev. B, 2012, 86, 075209 CrossRef.
- S. Na-Phattalung, M. F. Smith, K. Kim, M.-H. Du, S.-H. Wei, S. B. Zhang and S. Limpijumnong, Phys. Rev. B, 2006, 73, 125205 CrossRef.
- B. Santara, P. K. Giri, K. Imakita and M. Fujii, J. Phys. Chem. C, 2013, 117, 23402–23411 CrossRef CAS.
- D. J. Norris, A. L. Efros and S. C. Erwin, Science, 2008, 319, 1776–1779 CrossRef CAS.
- Y. C. Cao, Science, 2011, 332, 48–49 CrossRef PubMed.
- R. A. Abram, G. J. Rees and B. L. H. Wilson, Adv. Phys., 1978, 27, 799–892 CrossRef CAS.
- S. A. Wolf, D. D. Awschalom, R. A. Buhrman, J. M. Daughton, S. Von Molnar, M. L. Roukes, A. Y. Chtchelkanova and D. M. Treger, Science, 2001, 294, 1488 CrossRef CAS PubMed.
- H. Ohno, Science, 1998, 281, 951 CrossRef CAS.
- Y. Matsumoto, M. Murakami, T. Shono, T. Hasegawa, T. Fukumra, M. Kawasaki, P. Ahmet, T. Chikyow, S. Koshihara and H. Koinuma, Science, 2001, 291, 854 CrossRef CAS.
- A. Chanda, K. Rout, M. Vasundhara, S. R. Joshi and J. Singh, RSC Adv., 2018, 8, 10939–10947 RSC.
- T. Dietl, H. Ohno, F. Matsukura, J. Cibert and D. Ferrand, Science, 2000, 287, 1019 CrossRef CAS.
- A. Chanda, S. Gupta, M. Vasundhara, S. R. Joshi, G. R. Mutta and J. Singh, RSC Adv., 2017, 7, 50527–50536 RSC.
- M. Parras, A. Varela, R. C. Gil, K. Boulahya, A. Hernando and J. M. G. Calbet, J. Phys. Chem. Lett., 2013, 4, 2171 CrossRef CAS.
- J. Y. Zheng, S. H. Bao, Y. H. Lv and P. Jin, ACS Appl. Mater. Interfaces, 2014, 6, 22243 CrossRef CAS.
- S. Wang, L. Pan, J. J. Wang, W. Mi, J. J. Zou, L. Wang and X. Zhang, J. Am. Chem. Soc., 2015, 137, 2975 CrossRef CAS PubMed.
- K. Karthik, S. Kesava Pandian, K. Suresh Kumar and N. Victor Jaya, Appl. Surf. Sci., 2010, 256, 4757 CrossRef CAS.
- N. H. Hong, J. Sakai, N. Poirot and V. Brize, Phys. Rev. B, 2006, 73, 132404 CrossRef.
- S. D. Yoon, Y. Chen, A. Yang, T. L. Goodrich, X. Zuo, D. A. Arena, K. Zeimer, C. Vittoria and V. G. Harris, J. Phys.: Condens. Matter, 2006, 18, L355 CrossRef CAS.
- D. Kim, J. Hong, Y. R. Park and K. J. Kim, J. Phys.: Condens. Matter, 2009, 21, 195405 CrossRef.
- J.-Y. Kim, J.-H. Park, B.-G. Park, H.-J. Noh, S.-J. Oh, J. S. Yang, D.-H. Kim, S. D. Bu, T. W. Noh, H.-J. Lin, H.-H. Hsieh and C. T. Chen, Phys. Rev. Lett., 2003, 90, 017401 CrossRef.
- J. Xu, S. Shi, L. Li, X. Zhang, Y. Wang, X. Chen, J. Wang, L. Lv, F. Zhang and W. Zhong, J. Appl. Phys., 2010, 107, 053910 CrossRef.
- N. H. Hong, J. Sakai, N. Poirot and V. Brize, Phys. Rev. B, 2006, 73, 132404 CrossRef.
- M. Venkatesan, C. B. Fitzgerald and J. M. D. Coey, Nature, 2004, 430, 630 CrossRef CAS PubMed.
- B. Prajapati, S. Kumar, M. Kumar, S. Chatterjee and A. K. Ghosh, J. Mater. Chem. C, 2017, 5, 4257–4267 RSC.
- B. Parveen, M. ul-Hassan, Z. Khalid, S. Riaz and S. Naseem, J. Appl. Res. Technol., 2017, 15, 132–139 CrossRef.
- B. Choudhury, S. Paul, G. A. Ahmed and A. Choudhury, Mater. Res. Express, 2015, 2, 096104 CrossRef.
- B. Choudhury and A. Choudhury, Curr. Appl. Phys., 2013, 13, 1025–1031 CrossRef.
- B. Choudhury, M. Dey and A. Choudhury, Int. Nano Lett., 2013, 3, 25 CrossRef.
- S. A. Ahmed, J. Magn. Magn. Mater., 2017, 442, 152–157 CrossRef CAS.
- J. Yu, T. Ma and S. Liu, Phys. Chem. Chem. Phys., 2011, 13, 3491 RSC.
- Q.-H. Zhang, W.-D. Han, Y.-J. Hong and J.-G. Yu, Catal. Today, 2009, 148, 335 CrossRef CAS.
- T. Ohsaka, F. Izumi and Y. Fujiki, J. Raman Spectrosc., 1978, 7, 321–324 CrossRef.
- D. Berdani, P. P. Lottice and A. Montenero, J. Mater. Sci., 2000, 35, 4301–4305 CrossRef.
- H. A. Szymanski, Raman Spectroscopy: Theory and Practice, Plenum press, New York, 1967 Search PubMed.
- W. F. Zhang, Y. L. He, M. S. Zhang, Z. Yin and Q. Chen, J. Phys. D: Appl. Phys., 2000, 33, 912 CrossRef CAS.
- H. C. Choi, Y. M. Jung and S. B. Kim, Vib. Spectrosc., 2005, 37, 33–38 CrossRef CAS.
- L. H. Liang, C. M. Shen, X. P. Chen, W. M. Liu and H. J. Gao, J. Phys.: Condens. Matter, 2004, 16, 267 CrossRef CAS.
- A. Ali, E. Yassitepe, I. Ruzybayev, S. I. Shah and A. S. Bhatti, J. Appl. Phys., 2012, 112, 113505 CrossRef.
- A. Punnoose, J. Hays, V. ShutthanandanV and V. Gopal, Appl. Phys. Lett., 2004, 85, 155 CrossRef.
- M. Ahamed, M. A. M. Khan, M. J. Akhtar, H. A. Alhadlaq and A. Alshamsan, Sci. Rep., 2016, 6, 30196 CrossRef CAS.
- M. Cernea, C. Valsangiacom, R. Trusca and F. Vasiliu, J. Optoelectron. Adv. Mater., 2007, 9, 2648–2652 CAS.
- Z. Li, B. Hou, Y. Xu, D. Wu and Y. Sun, J. Colloid Interface Sci., 2005, 288, 149–154 CrossRef CAS PubMed.
- A. Bouaine, N. Brihi, G. Schmerber, C. Ulhaq-Bouillet, S. Colis and A. Dinia, J. Phys. Chem. C, 2007, 111(7), 2924–2928 CrossRef CAS.
- K. Nagaveni, M. S. Hegde and G. Madras, J. Phys. Chem. B, 2004, 108, 20204–20212 CrossRef CAS.
- K. Das, S. N. Sharma, K. Mahesh and S. K. De, J. Phys. Chem. C, 2009, 113, 14783–14792 CrossRef CAS.
- W. Y. Wu, Y. M. Chang and J. M. Ting, Cryst. Growth Des., 2010, 10, 1646 CrossRef CAS.
- R. Sanjines, H. Tang, H. Berger, F. Gozzo, G. Margaritondo and F. Lévy, J. Appl. Phys., 1994, 75, 2945 CrossRef CAS.
- J. Liu, J. Li, A. Sedhain, J. Lin and H. Jiang, J. Phys. Chem. C, 2008, 112, 17127–17132 CrossRef CAS.
- Y. Lei, L. Zhang, G. Meng, G. Li, X. Zhang, C. Liang, W. Chen and S. Wang, Appl. Phys. Lett., 2001, 78, 1125–1127 CrossRef CAS.
- N. Serpone, J. Phys. Chem. B, 2006, 110, 24287–24293 CrossRef CAS.
- L.-T. Tseng, X. Luo, T. T. Tan, S. Li and J. Yi, Nanoscale Res. Lett., 2014, 9, 673 CrossRef PubMed.
- B. Qi, S. Ólafsson and H. P. Gíslason, Prog. Mater. Sci., 2017, 90, 45–74 CrossRef CAS.
- J. M. D. Coey, Solid State Sci., 2005, 7, 660–667 CrossRef CAS.
- L. A. Errico, M. Rentería and M. Weissmann, Phys. Rev. B: Condens. Matter Mater. Phys., 2005, 72(1–8), 184425 CrossRef.
- http://srdata.nist.gov/xps.
- J. C. Huo, Nanoscale, 2014, 6, 9078–9084 RSC.
- H. Jensena, A. Solovieva, Z. S. Li and E. G. Sogaard, Appl. Surf. Sci., 2005, 246, 239–249 CrossRef.
- M. Xing and B. Tian, Chem. Commun., 2011, 47, 4947–4949 RSC.
- I. Nakai, Y. Sugitani, K. Nagashima and Y. Niwa, J. Inorg. Nucl. Chem., 1978, 40(5), 789–791 CrossRef CAS.
- B. R. Strohmeier, D. E. Levden, R. ScottField and D. M. Hercules, J. Catal., 1985, 94(2), 514–530 CrossRef CAS.
- B. Sudakshina, B. Arun, K. Devi Chandrasekhar, H. D. Yang and M. Vasundhara, Phys. B, 2018, 539(15), 14–20 CrossRef CAS.
- Z. Wang, C. Yang, T. Lin, H. Yin, P. Chen, D. Wan, F. Xu, F. Huang, J. Lin, X. Xie and M. Jiang, Adv. Funct. Mater., 2013, 23, 5444–5450 CrossRef CAS.
- D. Kim, J. Hong, Y. R. Park and K. J. Kim, J. Phys.: Condens. Matter, 2009, 21, 195405 CrossRef PubMed.
- S. K. Pandey and R. J. Choudhary, J. Phys.: Condens. Matter, 2011, 23, 276005 CrossRef PubMed.
- J. M. D. Coey, M. Venkatesan and C. B. Fitzgerald, Nat. Mater., 2005, 4, 173–179 CrossRef CAS PubMed.
- D. Y. Inamdar, A. D. Lad, A. K. Pathak, I. Dubenko, N. Ali and S. Mahamuni, J. Phys. Chem. C, 2010, 114, 1451–1459 CrossRef CAS.
- J. J. Beltrán, C. A. Barrero and A. Punnoose, J. Phys. Chem. C, 2016, 129(16), 8969–8978 CrossRef.
- C. Chiorescu, J. L. Cohin and J. J. Neumeier, Phys. Rev. B, 2007, 76, 020404(R) CrossRef.
- G. Madhu, K. Maniammal and V. Biju, Phys. Chem. Chem. Phys., 2016, 18, 12135–12148 RSC.
Footnote |
| † Electronic supplementary information (ESI) available. See DOI: 10.1039/c8ra07287f |
| This journal is © The Royal Society of Chemistry 2018 |


