 Open Access Article
Magnetic and microwave absorbing properties of low-temperature sintered BaZrxFe(12−x)O19
Li Deng ab,
Yang Zhaoab,
Zhaoming Xie
 *ab,
Zuohua Liuab,
Changyuan Taoab and
Rongrui Dengab
aChongqing Key Laboratory of Chemical Process for Clean Energy and Resource Utilization, Chongqing University, Chongqing 400044, China. E-mail: xiezm@cqu.edu.cn
bCollege of Chemistry and Chemical Engineering, Chongqing University, Chongqing 400044, China
First published on 17th December 2018
Abstract
In the present work, to enhance the reflection loss and change the magnetic resonance frequency of barium ferrite sintered at low temperature, different amounts of Zr ion were introduced to BaFe12O19 to substitute the Fe ion. A series of M-type barium hexaferrite samples having the nominal composition BaZrxFe(12−x)O19 (x = 0.0, 0.3, 0.6, 0.9 and 1.2) was successfully synthesized by heat treatment at a relatively low temperature (900 °C) for 2 h. In order to study the phases, morphologies and magnetic properties of the substituted barium ferrites, X-ray diffraction (XRD), scanning electron microscopy (SEM) and vibrating sample magnetometry (VSM) were used. The XRD patterns indicated that all samples were single phase M-type ferrites. The SEM images showed that all samples were hexagonal-shaped particles and the average size was about 500 nm. Simultaneously, a potassium chloride additive can effectively reduce the sintering temperature of barium ferrites and their formation and morphology are apparently not affected. The VSM results demonstrated that the coercivity steeply decreased from 4772.43 Oe to 797.34 Oe when the Zr ion substitution amount increased from 0.0 to 1.2 but the saturation magnetization remained almost constant (Ms = 49.71–63.06 emu g−1). Furthermore, the complex electromagnetic parameters were collected by a vector network analyzer (VNA) and the microwave absorbing properties were calculated according to transmission theory. It was found that the reflection loss is enhanced with increasing x. The minimum reflection loss value of −30.2 dB at 16.75 GHz was observed and the bandwidth is about 2.46 GHz for the x = 1.2 sample. BaZrxFe(12−x)O19 might be a promising candidate for applications of LTCC (low-temperature co-fired ceramic) substrates for millimeter wave circulators and filters.
1. Introduction
With the rapid development of communication technology and the electronic industry, problems of electromagnetic pollution (EMP) and electromagnetic interference (EMI) are becoming increasingly serious.1–3 In recent years, the research on electromagnetic wave absorbers with the capability of absorbing unwanted electromagnetic signals has become a hot spot. Ferrites with excellent magnetic and dielectric properties are regarded as the best magnetic material for electromagnetic wave absorbers. Compared to the ferrites that possess spinel and garnet structures, barium ferrites (BaFe12O19, often denoted as BaM) with a hexagonal magnetoplumbite structure are considered to be a promising absorbing material owing to their large magnetocrystalline anisotropy (K1 = 3.3 × 10⁵ J m−3),4 high saturation magnetization (Ms = 72 emu g−1), high coercivity (Hc = 6700 Oe),5 excellent chemical stability and high frequency application.At present, there are several common methods for synthesizing barium ferrite, such as the dynamic hydrothermal method,6 co-precipitation method,7 high-energy ball milling method,8 sol–gel method9 and so on. However, in order to form the crystalline structure of barium ferrite, the sintering temperature of these methods is usually higher than 1200 °C,10 which limits the application of barium ferrite in low temperature co-fired ceramic (LTCC) technology. LTCC technology is an important technology to realize the miniaturization and integration of portable communication devices (such as mobile phones) and wave absorbing devices (such as filters). In the process of LTCC fabrication, magnetic or dielectric materials and a silver electrode material are co-fired at low temperature (<961 °C),11 so it is necessary for materials sintered at low temperature to achieve their specific structure and properties. Therefore, for the purpose of reducing the sintering temperature, the addition of low melting-point materials has been tried. In our study, KCl with a melting point of 770 °C is selected as an additive to reduce the calcining temperature of ferrite.
For the pure barium ferrite, according to a report, the resonance frequency is too high (42.5 GHz),12 the minimum of reflection loss is larger than −5 dB and the microwave absorbing property is poor. Ion substitution has been considered to be the most efficient method to improve the properties of barium ferrite among various techniques. Currently, two methods of ionic substitution have been reported. One is to substitute Ba2+![[thin space (1/6-em)]](https://www.rsc.org/images/entities/char_2009.gif) 13–15 with other cations, and the other is the substitution of Fe3+.16–18 The saturation magnetization, coercive force, magnetic resonance frequency and magnetocrystalline anisotropy field were altered when other ions were introduced into the barium ferrite structure. However, so far, there has been no report on Zr-doped BaFe12O19 nanoparticles sintered at low temperature. So, the effect of Zr substitution at different levels on barium ferrite sintered at low temperature was studied.
13–15 with other cations, and the other is the substitution of Fe3+.16–18 The saturation magnetization, coercive force, magnetic resonance frequency and magnetocrystalline anisotropy field were altered when other ions were introduced into the barium ferrite structure. However, so far, there has been no report on Zr-doped BaFe12O19 nanoparticles sintered at low temperature. So, the effect of Zr substitution at different levels on barium ferrite sintered at low temperature was studied.
In the present study, BaZrxFe(12−x)O19 (x = 0.0, 0.3, 0.6, 0.9 and 1.2) ferrite powders were prepared with the co-precipitation method and sintered with potassium chloride as an additive at 900 °C. Subsequently, the impacts of doping Zr4+ on the phases, morphologies and magnetic properties of the samples were discussed. Finally, the complex permeability, permittivity and absorbing properties were discussed.
2. Experimental
BaZrxFe(12−x)O19 particles with different nominal compositions (x = 0.0, 0.3, 0.6, 0.9 and 1.2) were synthesized by a modified flux method, which consists of two processes, one is chemical co-precipitation, the other is synthesis from a salt melt.19 An aqueous solution containing the metal salts BaCl2·2H2O (AR), FeCl3·6H2O (AR) and ZrO(NO3)2·6H2O (AR) in the proportions needed for the ferrite was dropped into an aqueous solution of Na2CO3 (AR). Subsequently, a high concentration of Na2CO3 was added to adjust the pH of the mixing solution to 9 and the solution was heated at 70 °C for 2 h. The reacted solution was filtered, washed thoroughly and dried. Then, the as-prepared precursors were mixed with KCl (AR) and heated at 900 °C for 2 h in air. Ferrite grains crystallized from the KCl molten salt. After the KCl was dissolved in water, BaZrxFe(12−x)O19 particles were obtained.X-ray diffraction (XRD) with Cu Kα radiation was employed to identify the crystalline phases of the final product. The micrographs and the chemical composition of the ferrites were recorded using scanning electron microscopy (SEM) and energy dispersive X-ray (EDX) analysis. The magnetic properties of the samples were measured by vibrating sample magnetometry (VSM, Lake Shore 735). The complex permittivity and complex permeability of the ferrites in the frequency range of 2–18 GHz were measured directly with a vector network analyzer (VNA, N5244A).
3. Results and discussion
3.1. X-ray diffraction (XRD) analysis
The XRD patterns of the BaZrxFe(12−x)O19 nanoparticles with nominal compositions (x = 0.0, 0.3, 0.6, 0.9, 1.2) obtained at 900 °C are shown in Fig. 1. Fig. 1(a) shows that all peaks belong to the BaFe12O19 phase; no other phase is apparently detectable. The pure phase M-type barium ferrites were successfully synthesized under low temperature sintering by adding the KCl additive. Furthermore, the peak positions are obviously changed and the relative intensities alter slightly as the substitution value x increases. As Fe3+ ions were increasingly substituted by Zr4+ ions, the diffraction angles of the strongest three peaks (110), (107) and (114) were observed to decrease (shown in Fig. 1(b)). The result indicates that the crystal lattice expanded with the increase of Zr content. Table 1 displays the specific lattice parameters. It is obvious that lattice parameters “a” and “c” increase slightly, while “c” increases faster, as shown in Fig. 2. This suggests that the c-axis undergoes more expansion than the a-axis because of ion substitution. Furthermore, cell volume increases as x increases. This may be due to the fact that the ion radius of Zr4+ (0.072 nm) is larger than that of Fe3+ (0.067 nm). It has been reported that the structure type of ferrite may be quantified by the lattice parameter ratio. When the “c/a” ratio is lower than 3.98, the ferrite is considered to be in the form of an M-type hexaferrite structure.20 In this work, the “c/a” ratio varies from 3.9372 to 3.9432. This demonstrated that the obtained samples are of M-type hexagonal ferrite structure.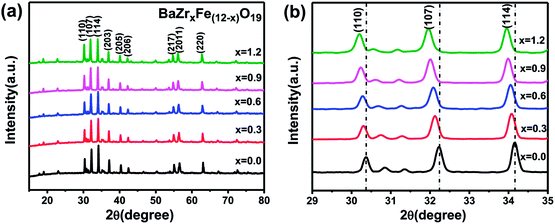 | ||
| Fig. 1 (a) XRD patterns of BaZrxFe(12−x)O19 (0.0 ≤ x ≤ 1.2) nanoparticles calcined at 900 °C for 2 h; (b) partially enlarged XRD patterns of (a). | ||
| x | a (Å) | c (Å) | c/a | Cell volume (Å3) | Crystallite size (nm) |
|---|---|---|---|---|---|
| 0.0 | 5.8650 | 23.0990 | 3.9384 | 688.09 | 58.7 |
| 0.3 | 5.8760 | 23.1700 | 3.9432 | 692.80 | 58.3 |
| 0.6 | 5.8760 | 23.1700 | 3.9432 | 692.80 | 54.0 |
| 0.9 | 5.8920 | 23.1980 | 3.9372 | 697.42 | 53.1 |
| 1.2 | 5.8945 | 23.2150 | 3.9384 | 698.52 | 52.6 |
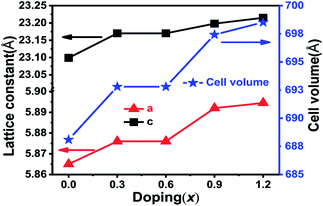 | ||
| Fig. 2 Variation in lattice constants and cell volumes as a function of doping (x = Zr) in BaZrxFe(12−x)O19. | ||
Fig. 1(b) also shows that upon increasing the substitution amount x, the relative intensities of the peaks in the XRD patterns decreased and the peaks broadened, implying that the grains became smaller and the crystallinity decreased. The average crystallite size (Dhkl) of different BaZrxFe(12−x)O19 nanoparticles was calculated according to Scherrer's equation. The results are summarized in Table 1. The crystallite sizes decrease from 58.7 nm (x = 0.0) to 52.6 nm (x = 1.2) for BaZrxFe(12−x)O19 with increasing Zr4+ substitution content. This may be attributed to the fact that the radius of Zr4+ is slightly different from that of Fe3+, so the substitution will cause the lattice to distort and the internal stress caused by lattice distortion will impede the growth of grains but the crystal structure will not be influenced.21 The relatively small size of the grains may also be attributed to the restriction of grain growth by liquid phase formation, which agrees with some reports in the literature.22
3.2. Morphology analysis
The SEM images of Zr-doped barium ferrites calcined at 900 °C for 2 h are shown in Fig. 3. The SEM images of the samples showed that well-formed hexagonal grains were present and the agglomeration of particles hardly occurred. The size of particles for all samples was less than 1 μm; most of them were about 500 nm. In the process of sintering, the KCl additive not only has little impact on the morphology of the nanoparticles but also plays an important role in reducing the calcining temperature.22 The hexagonal shape of the samples gradually became irregular as Zr concentration increased and the sizes increased slightly. This might be due to the fact that the ferrite formation reaction was promoted by the Zr4+ ion, which is in agreement with other research.23 It is clear that some small particles appeared as Zr was introduced. Furthermore, the number of small particles increased with x content.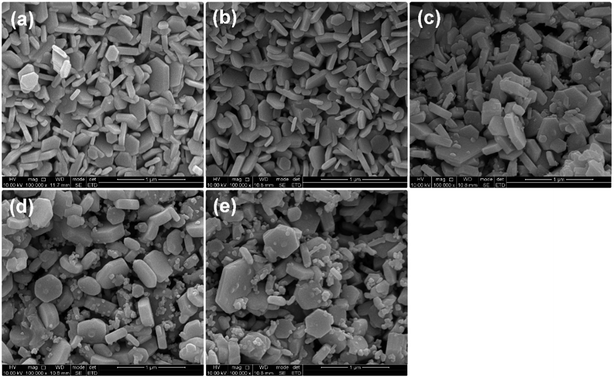 | ||
| Fig. 3 SEM images of BaZrxFe(12−x)O19 sintered at 900 °C for 2 h with KCl: (a) x = 0.0; (b) x = 0.3; (c) x = 0.6; (d) x = 0.9; (e) x = 1.2. | ||
Energy dispersive X-ray (EDX) analysis was carried out in order to confirm the chemical composition of BaZrxFe(12−x)O19 sintered at 900 °C for 2 h. Fig. 4 shows the typical EDX spectra and the inset table is the analysis data. It was observed that all samples contain Fe, Ba and O elements, and when the x value increases, the content of Zr increases, which is consistent with the designed composition.
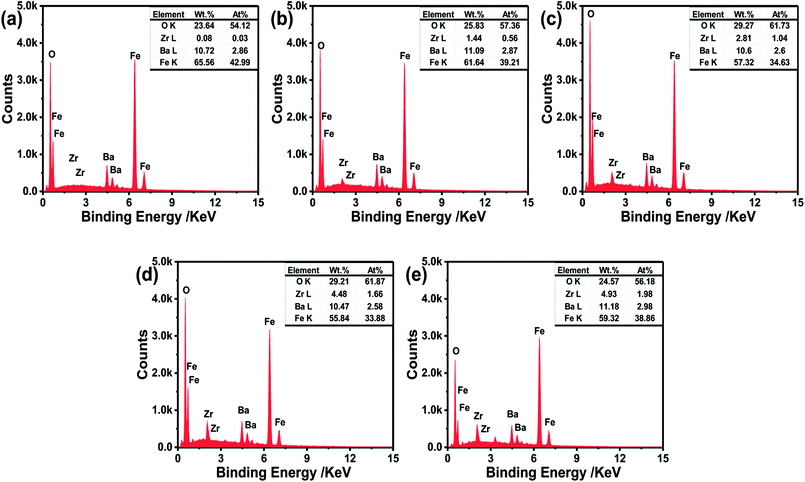 | ||
| Fig. 4 EDX images of BaZrxFe(12−x)O19 sintered at 900 °C for 2 h with KCl: (a) x = 0.0; (b) x = 0.3; (c) x = 0.6; (d) x = 0.9; (e) x = 1.2. | ||
3.3. Magnetic measurements
Zr4+ substitution does not greatly influence the morphology of the nanoparticles but it does have a significant effect on the magnetic properties. As shown in Fig. 5(a), the room temperature magnetic hysteresis loops of Zr-doped ferrites sintered at 900 °C suggest that the samples possess high coercivity. The changes of the saturation magnetization (Ms) and coercivity (Hc) values of BaZrxFe(12−x)O19 are also displayed in Fig. 5(b). Table 2 summarizes the derived magnetic parameters. Magnetism in ferrites is derived from the magnetic moments of ions in spin up and spin down orientations in the sublattice according to ferromagnetic theory.24 In general, the distribution of iron ions in the crystallographic lattice determines the magnetic properties of the M-type hexaferrite to some extent. Fe3+ ions occupy five distinct crystallographic sites: three octahedral sites, 12k (spin up), 4f2 (spin down), and 2a (spin up), a tetrahedral site, 4f1 (spin down), and a bipyramidal site, 2b (spin up), in the structure of pure BaM.25 Mössbauer studies demonstrated that the molar proportion of Fe3+ ions at different sites is Fe(12k)![[thin space (1/6-em)]](https://www.rsc.org/images/entities/char_2009.gif) :
:![[thin space (1/6-em)]](https://www.rsc.org/images/entities/char_2009.gif) Fe(4f1)
Fe(4f1)![[thin space (1/6-em)]](https://www.rsc.org/images/entities/char_2009.gif) :
:![[thin space (1/6-em)]](https://www.rsc.org/images/entities/char_2009.gif) Fe(4f2)
Fe(4f2)![[thin space (1/6-em)]](https://www.rsc.org/images/entities/char_2009.gif) :
:![[thin space (1/6-em)]](https://www.rsc.org/images/entities/char_2009.gif) Fe(2a)
Fe(2a)![[thin space (1/6-em)]](https://www.rsc.org/images/entities/char_2009.gif) :
:![[thin space (1/6-em)]](https://www.rsc.org/images/entities/char_2009.gif) Fe(2b) = 6
Fe(2b) = 6![[thin space (1/6-em)]](https://www.rsc.org/images/entities/char_2009.gif) :
:![[thin space (1/6-em)]](https://www.rsc.org/images/entities/char_2009.gif) 2
2![[thin space (1/6-em)]](https://www.rsc.org/images/entities/char_2009.gif) :
:![[thin space (1/6-em)]](https://www.rsc.org/images/entities/char_2009.gif) 2
2![[thin space (1/6-em)]](https://www.rsc.org/images/entities/char_2009.gif) :
:![[thin space (1/6-em)]](https://www.rsc.org/images/entities/char_2009.gif) 1
1![[thin space (1/6-em)]](https://www.rsc.org/images/entities/char_2009.gif) :
:![[thin space (1/6-em)]](https://www.rsc.org/images/entities/char_2009.gif) 1 for undoped BaM.26 The magnetic moment of barium ferrite can be inferred from the algebraic sum of iron magnetic moments at diverse sites: M = M(12k + 2a + 2b)↑ − M(4f1 + 4f2)↓.27 For pure BaFe12O19, the total magnetic moment is equal to 20 μB as the magnetic moment of Fe3+ is 5 μB.
1 for undoped BaM.26 The magnetic moment of barium ferrite can be inferred from the algebraic sum of iron magnetic moments at diverse sites: M = M(12k + 2a + 2b)↑ − M(4f1 + 4f2)↓.27 For pure BaFe12O19, the total magnetic moment is equal to 20 μB as the magnetic moment of Fe3+ is 5 μB.
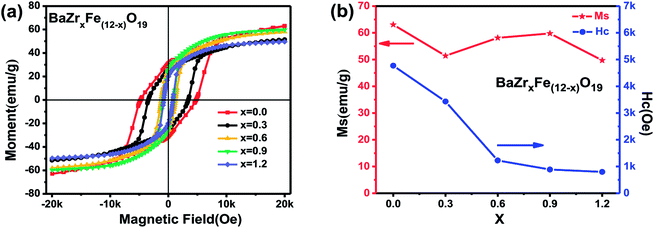 | ||
| Fig. 5 (a) Hysteresis loops for the BaZrxFe(12−x)O19 nanoparticles calcined at 900 °C for 2 h; (b) effect of x on values of Ms and Hc of BaZrxFe(12−x)O19 nanoparticles calcined at 900 °C for 2 h. | ||
| Sample (x) | Ms (emu g−1) | Hc (Oe) | Mr (emu g−1) | Mr/Ms |
|---|---|---|---|---|
| x = 0.0 | 63.06 | 4772.43 | 31.24 | 0.50 |
| x = 0.3 | 51.41 | 3431.29 | 25.80 | 0.50 |
| x = 0.6 | 58.13 | 1225.88 | 25.73 | 0.44 |
| x = 0.9 | 59.77 | 887.46 | 25.48 | 0.43 |
| x = 1.2 | 49.71 | 797.34 | 20.00 | 0.40 |
As shown in Fig. 5(b) and Table 2, the obtained barium ferrite series has a high level of magnetic characteristics. With increasing x, the value of Ms first decreases to 51.41 emu g−1 at x = 0.3 and then increases, reaching 59.77 emu g−1 at x = 0.9; when x = 1.2, Ms reduces to the minimum value of 49.71 emu g−1. Although there are some changes, Ms tends to be reasonably constant (Ms = 49.71–63.06 emu g−1). The theoretical value of Ms for single phase BaM is 72 emu g−1, as reported in the literature.5 In this study, the maximum value of Ms is lower than the theoretical value by 12%, and this phenomenon may be influenced by the method of preparation.
It is known that magnetic properties are chiefly influenced by the occupied position of doping ions in different lattice sites of Fe3+ and their magnetic nature. The first decrease of Ms may be due to the fact that the dopant is substituted at the parallel 2b site at x = 0.3 and that the magnetic moment of the doped ion (Zr4+ = 0 μB) is smaller than that of Fe3+ (5 μB). When x increased from 0.3 to 0.9, the increase of Ms can be attributed to the enhancement of the total magnetic moment, which is due to Zr4+ ions locating at the anti-parallel 4f1 site. As x continues to increase, more Fe3+ (high spin) ions are converted to Fe2+ (low spin) by substitution of Fe3+ with Zr4+ ions, resulting in magnetic dilution occurring. Thus, the Fe3+–O–Fe3+ superexchange interaction is disrupted and weakened by Fe2+ ions and spin canting.28 Hence, spin canting and the magnetic dilution effect may be two dominant reasons why BaZr1.2Fe10.8O19 possesses a lower Ms value.
Meanwhile, Fig. 5(b) shows that there is a relatively wide coercivity range when the substitution amount x increased from 0.0 to 1.2. It can be seen that the Hc values of the BaZrxFe(12−x)O19 nanoparticles decrease gradually from 4772.43 Oe to 797.34 Oe as Zr substitution increases (as shown in Table 2). The theoretical value of Hc is 6700 Oe for BaM, as reported in literature.5 The value of the coercive force in our study is reduced by 29% compared to the theoretical value, which may be affected by synthetic methods. The fall in coercivity is due partially to the larger particle sizes. As found in the SEM study (Fig. 3), the particle size of barium ferrite increased as x increased, but this fact cannot alone interpret the decline of Hc in the Zr doped samples. The other reason may be due to the fact that a reduction of the magnetocrystalline anisotropy field results from the substitution of nonmagnetic Zr4+ ions. As is well known, the contributions of a single Fe3+ ion in each position to the anisotropy constant K1 can be sorted as −0.18, 0.18, 0.23, 0.51 and 1.4, respectively, for 12k, 4f1, 2a, 4f2 and 2b.29 We already know that Zr4+ ions locate on the 2b site at low doping levels, which leads to a large decrease of Hc. And as x increases, Zr4+ ions gradually prefer to occupy the 4f1 site, which results in a slight decline of Hc.
3.4. Microwave characteristics
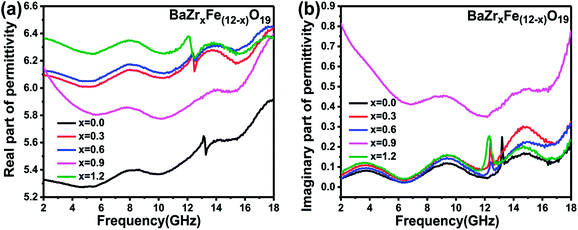 | ||
| Fig. 6 Permittivity response of BaZrxFe(12−x)O19 ferrite samples: (a) real part and (b) imaginary part. | ||
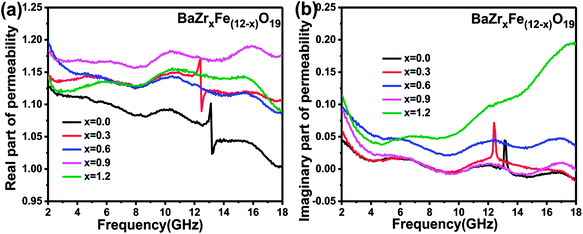
The variation of the real (μ′) and imaginary (μ′′) parts of complex permeability for BaZrxFe(12−x)O19 (x = 0.0, 0.3, 0.6, 0.9, 1.2) over the frequency range of 2–18 GHz is shown in Fig. 7(a) and (b). The μ′ of complex permeability declines from 1.13 to 1.00 as the frequency increases for the undoped sample while the μ′′ spectrum has a peak value at around 13.16 GHz. For all doped samples, the values of the real part (μ′) of complex permeability are larger than that of the undoped sample and remain nearly constant. Furthermore, the value of the imaginary part (μ′′) for the x = 1.2 sample is larger than that of the undoped sample from 2 to 18 GHz and its maximum value is about 0.19 at 18 GHz, which implies that doping Zr4+ can enhance the magnetic loss.
 | (1) |
 | (2) |
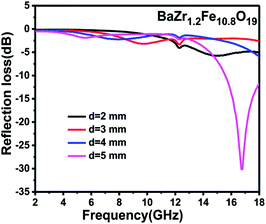
For the purpose of finding the appropriate thickness, the reflection losses with different thicknesses were calculated based on the equations for all samples. The calculations were executed for d = 2, 3, 4, and 5 mm. Fig. 8 shows the reflection loss of the BaZr1.2Fe10.8O19 samples at various thicknesses.
As can be seen from the figure, the absorbing property is poor and the minimum of reflection loss is larger than −10 dB from 2 to 18 GHz when the thickness is less than 4 mm. Furthermore, when the matching thickness increases to 5 mm, the minimum of the reflection loss of the BaZr1.2Fe10.8O19 nanoparticles reduces to as low as −30.2 dB at 16.75 GHz; all other samples were found to have a similar nature.
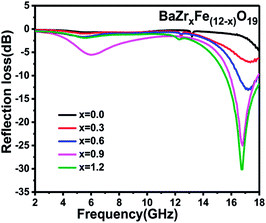
Fig. 9 shows the change of the reflection loss with frequency for the BaZrxFe(12−x)O19 nanoparticles (x = 0.0, 0.3, 0.6, 0.9 and 1.2) at the thickness of 5 mm. The bandwidth refers to a range of frequency where the reflection loss is lower than −10 dB. 90% of the microwaves can be absorbed in this frequency bandwidth. An excellent microwave absorbing material should possess not only a low reflection loss but also a wide frequency bandwidth. There is no obvious absorption for the samples with x ≤ 0.3. But, when the amount of doping is greater than 0.3, the reflection loss and the bandwidth increase obviously and the resonance frequency slightly moves toward a lower frequency. When x = 0.9, the strongest reflection loss is −25.1 dB at 16.79 GHz and the bandwidth is 2.15 GHz. The reason for the improvement of reflection loss of BaZr0.9Fe11.1O19 might be that the value of ε′′ for x = 0.9 is largest among all samples (shown in Fig. 6(b)), which indicates that more incident electromagnetic wave will be attenuated via dielectric loss. As compared to the other samples, the ferrite with the composition of BaZr1.2Fe10.8O19 shows the strongest microwave absorption. The minimum value of the reflection loss of the BaZr1.2Fe10.8O19 nanoparticles is about −30.2 dB at 16.75 GHz and the bandwidth is about 2.46 GHz, which implies that the BaZr1.2Fe10.8O19 nanoparticles possess excellent microwave absorption properties. This might be due to the fact that the value of μ′′ for x = 1.2 is larger than that of the other four samples (shown in Fig. 7(b)), which indicates that more incident electromagnetic wave will be attenuated via magnetic loss. According to our investigation, the absorbing property of BaFe12O19 is weak and the minimum of reflection loss is larger than −5 dB. The doped barium ferrites show relatively excellent absorption properties with respect to the pure barium ferrite.
The enhancement of microwave absorption properties of the Zr ion substituted samples might be attributed to two reasons: first, the crystallite size contraction caused by the slight difference of radius between Zr4+ and Fe3+ (shown in Table 1) can cause the surface state and grain surface energy level to vary obviously.37 The increased interface polarization and multiple reflection will cause more energy to be absorbed when the electromagnetic wave diffuses in the materials.38 Second, the substitution of Zr4+ for Fe3+ would result in converting some Fe3+ to Fe2+ in the ferrite structure to maintain charge neutrality. The electrons hopping between ions with different valence induces electric dipole polarization39 and thence the dielectric loss can be enhanced after Zr doping.
4. Conclusions
BaZrxFe(12−x)O19 (0 ≤ x ≤ 1.2) powders with potassium chloride as an additive were successfully synthesized by a sintering route at relatively low temperature (900 °C). The XRD patterns indicated that all samples were single phase M-type ferrites. SEM images revealed that all samples are small hexagonal-shaped particles and the particle sizes are about 500 nm. The obtained samples exhibit a high level of saturation magnetization but the coercivity is continuously reduced from 4772.43 Oe to 797.34 Oe when the Zr ion substitution amount increases from 0.0 to 1.2. The dominant reason for the variations of magnetic properties is that non-magnetic Zr4+ ions prefer to occupy 2b sites at a low substitution level, while they occupy 4f1 sites at a high doping level. The microwave absorbing properties of barium ferrite are greatly improved by doping Zr ions, especially BaZr1.2Fe10.8O19. The minimum of the reflection loss of the BaZr1.2Fe10.8O19 nanoparticles is about −30.2 dB at a matching frequency of 16.75 GHz and the bandwidth is about 2.46 GHz, which indicates that the BaZr1.2Fe10.8O19 nanoparticles possess excellent microwave absorption properties. The enhancement of microwave absorption properties of the Zr ion doped ferrite samples might be attributed to the fact that the reflection loss can be enhanced by the grain size shrinkage and electrons hopping between ions with different valence induced by substitution of Fe3+ with Zr4+ ions. BaZrxFe(12−x)O19 nanoparticles might be a good candidate for applications of LTCC substrates for millimeter wave circulators and filters.Conflicts of interest
There are no conflicts to declare.Acknowledgements
This study was supported by the National Science and Technology Support Plan (grant numbers: 2015BAB17B01 and 2015BAB17B00).References
- A. Ghasemi, A. Hossienpour, A. Morisako, A. Saatchi and M. Salehi, J. Magn. Magn. Mater., 2006, 302, 429–435 CrossRef CAS.
- B. Dai, X. Shao, Y. Ren, G. Wang, C. Pei and Y. Ma, Mater. Lett., 2012, 82, 188–190 CrossRef CAS.
- Y. Ren, S. Li, B. Dai and X. Huang, Appl. Surf. Sci., 2014, 311, 1–4 CrossRef CAS.
- V. G. Harris, Z. Chen, Y. Chen, S. Yoon, T. Sakai, A. Gieler, A. Yang, Y. He, K. S. Ziemer, N. X. Sun and C. Vittoria, J. Appl. Phys., 2006, 99, 08M911 CrossRef.
- S. K. Chawla, R. K. Mudsainiyan, S. S. Meena and S. M. Yusuf, J. Magn. Magn. Mater., 2014, 350, 23–29 CrossRef CAS.
- T. Ben Ghzaiel, W. Dhaoui, A. Pasko and F. Mazaleyrat, J. Alloys Compd., 2016, 671, 245–253 CrossRef CAS.
- E. V. Pashkova, E. D. Solovyova, T. V. Kolodiazhnyi, V. P. Ivanitskii and A. G. Belous, J. Magn. Magn. Mater., 2014, 368, 1–7 CrossRef CAS.
- A. M. Alsmadi, I. Bsoul, S. H. Mahmood, G. Alnawashi, K. Prokes, K. Siemensmeyer, B. Klemke and H. Nakotte, J. Appl. Phys., 2013, 114, 243910 CrossRef.
- Z. Mosleh, P. Kameli, A. Poorbaferani, M. Ranjbar and H. Salamati, J. Magn. Magn. Mater., 2016, 397, 101–107 CrossRef CAS.
- H. Zhang, J. Li, H. Su, T. Zhou, Y. Long and Z. Zheng, Chin. Phys. B, 2013, 22, 117504 CrossRef.
- Q. Yang, H. Zhang, Y. Liu and Q. Wen, Mater. Lett., 2009, 63, 406–408 CrossRef CAS.
- R. C. Pullar, S. G. Appleton and A. K. Bhattacharya, J. Magn. Magn. Mater., 1998, 186, 326–332 CrossRef CAS.
- A. Baykal, I. A. Auwal, S. Güner and H. Sözeri, J. Magn. Magn. Mater., 2017, 430, 29–35 CrossRef CAS.
- S. Verma, O. P. Pandey, A. Paesano and P. Sharma, Phys. B, 2014, 448, 57–59 CrossRef CAS.
- V. C. Chavan, S. E. Shirsath, M. L. Mane, R. H. Kadam and S. S. More, J. Magn. Magn. Mater., 2016, 398, 32–37 CrossRef CAS.
- Y. Liu, M. G. B. Drew, J. Wang, M. Zhang and Y. Liu, J. Magn. Magn. Mater., 2010, 322, 366–374 CrossRef CAS.
- D. A. Vinnik, D. A. Zherebtsov, L. S. Mashkovtseva, S. Nemrava, M. Bischoff, N. S. Perov, A. S. Semisalova, I. V. Krivtsov, L. I. Isaenko, G. G. Mikhailov and R. Niewa, J. Alloys Compd., 2014, 615, 1043–1046 CrossRef CAS.
- D. A. Vinnik, D. A. Zherebtsov, L. S. Mashkovtseva, S. Nemrava, A. K. Yakushechkina, A. S. Semisalova, S. A. Gudkova, A. N. Anikeev, N. S. Perov, L. I. Isaenko and R. Niewa, Mater. Chem. Phys., 2015, 155, 99–103 CrossRef CAS.
- C. S. Wang, F. L. Wei, M. Lu, D. H. Han and Z. Yang, J. Magn. Magn. Mater., 1998, 183, 241–246 CrossRef CAS.
- L. Wang, H. Yu, X. Ren and G. Xu, J. Alloys Compd., 2014, 588, 212–216 CrossRef CAS.
- N. Chen, K. Yang and M. Gu, J. Alloys Compd., 2010, 490, 609–612 CrossRef CAS.
- J. Li, H. Zhang, V. G. Harris, Y. Liao and Y. Liu, J. Alloys Compd., 2015, 649, 782–787 CrossRef CAS.
- C. Singh, S. Bindra Narang, I. S. Hudiara, Y. Bai and F. Tabatabaei, Mater. Res. Bull., 2008, 43, 176–184 CrossRef CAS.
- M. L. Néel, Ann. Phys., 1948, 12, 137–198 Search PubMed.
- J. Li, H. Zhang, Y. Li, Q. Li and G. Yu, J. Supercond. Novel Magn., 2014, 27, 793–797 CrossRef CAS.
- P. Sharma, R. A. Rocha, S. N. Medeiros, B. Hallouche and A. Paesano, J. Magn. Magn. Mater., 2007, 316, 29–33 CrossRef CAS.
- A. Ghasemi and A. Morisako, J. Alloys Compd., 2008, 456, 485–491 CrossRef CAS.
- S. Ounnunkad, P. Winotai and S. Phanichphant, J. Electroceram., 2006, 16, 357–361 CrossRef CAS.
- X. Z. Zhou, A. H. Morrish, Z. Yang and H. X. Zeng, J. Appl. Phys., 1994, 75, 5556–5558 CrossRef CAS.
- Z. Zheng and H. Zhang, IEEE Trans. Magn., 2013, 49, 4230–4233 CAS.
- S. M. Abbas, A. K. Dixit, R. Chatterjee and T. C. Goel, J. Magn. Magn. Mater., 2007, 309, 20–24 CrossRef CAS.
- C. G. Koops, Phys. Rev., 1951, 83, 121–124 CrossRef CAS.
- X. G. Liu, B. Li, D. Y. Geng, W. B. Cui, F. Yang, Z. G. Xie, D. J. Kang and Z. D. Zhang, Carbon, 2009, 47, 470–474 CrossRef CAS.
- L. T. Yan, X. J. Wei and G. Z. Kang, Ferro-Alloys, 2010, 28, 5 Search PubMed.
- C. Dong, X. Wang, P. Zhou, T. Liu, J. Xie and L. Deng, J. Magn. Magn. Mater., 2014, 354, 340–344 CrossRef CAS.
- S. Ozah and N. S. Bhattacharyya, J. Magn. Magn. Mater., 2013, 342, 92–99 CrossRef CAS.
- C. Li, B. Wang and J. Wang, J. Magn. Magn. Mater., 2012, 324, 1305–1311 CrossRef CAS.
- N. Chen, K. Yang and M. Gu, J. Alloys Compd., 2010, 490, 609–612 CrossRef CAS.
- Y. Wu, Z. W. Li, L. Chen, S. J. Wang and C. K. Ong, J. Appl. Phys., 2004, 95, 4235–4239 CrossRef CAS.
| This journal is © The Royal Society of Chemistry 2018 |

